Preparation and characterization of a covalent edge-functionalized lipoic acid–MoS2 conjugate

Misoon Jeong, Somin Kim and Sang-Yong Ju*
Department of Chemistry, Yonsei University, 50 Yonsei-ro, Seodaemun-Gu, Seoul 03722, Korea. E-mail: syju@yonsei.ac.kr

Received 12th January 2016 , Accepted 5th April 2016

First published on 6th April 2016


Abstract

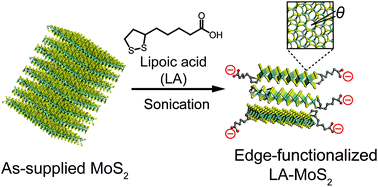
Covalent functionalization of semiconducting MoS2 is important in order to broaden the optoelectronic applications of this material. In the current study, we developed a one-step method for covalent edge functionalization of semiconducting MoS2 with lipoic acid (LA). The process, which utilizes a simple sonochemical aqueous dispersion approach, generates a LA–MoS2 conjugate that has a few layered nanoflake structure with a width of a few hundred nanometers and that display an intact crystalline basal plane. The MoS2 conjugate has the tendency to stack and fold with random relative angles owing to the presence of LA edge linked groups.

Introduction

Molybdenum disulfide (MoS2), a widely studied transition metal chalcogenide, has gained extensive interest over the last decade.1 Aside from its concurrent applications, such as a lubricant2 and catalyst,3 MoS2 has semiconductor properties. When combined with its ability to be grown and deposited over large areas,4 MoS2 holds high potential for use in field effect transistor and sensor applications.5,6

The optoelectronic property of MoS2 is a consequence of the fact that it possesses polytype lattice structures including 1T (one layer per repeat unit, octahedral coordination), 2H (two layers per repeat unit, trigonal prismatic coordination) and 3R (three layers per repeat unit, trigonal prismatic coordination),7,8 whose Arabic number indicates layer number per repeat. While the 1T phase exhibits metallic properties, the thermodynamically stable 2H phase9,10 displays semiconducting properties which cause a change in the bulk indirect band gap structure to a monolayer direct band gap structure.11,12 As a result of these features, it is possible to control the optoelectronic properties of MoS2 by altering layer numbers,6,11 doping,13 changing the polytype,9,14–16 introducing functionality17 and strain.18,19

A large effort has been made to devise methods to disperse MoS2 in various media in order to broaden its practical applications. Various solution exfoliation procedures, including those that involve the use of metal intercalation,14–16 organic solvents,20–22 and covalent17,23,24 and noncovalent25,26 functionalization. Representative of these approaches are exfoliation techniques that rely on reduction of MoS2 by using alkali metals (i.e., Li and Na).14–16 These methods produce the metallic monolayer 1T phase of MoS2 predominantly. Unfortunately, additional thermal annealing on a substrate14,17 or chemical functionalization17,24 is required to convert the monolayer 1T phase into the semiconducting 2H phase. A majority of the approaches to covalent functionalization of MoS2 utilize initial metal-based, pre-exfoliation to generate the 1T phase followed by reactions with, for example, alkyl halides,17 diazonium salt24 thiols,18 and lipoic acid (LA)27,28 to produce the semiconducting phase. However, this chemical covalent functionalization technique produces MoS2 with a high degree of defects on its basal plane.24 Consequently, a facile solution-based approach for the preparation of chemically functionalized semiconducting MoS2 with a small number of defects is needed in order to extend applications of this material.

In the study described below, X-ray diffraction (XRD), high-resolution (HR) TEM and X-ray photoelectron spectroscopy (XPS) were employed to investigate in depth the local MoS2 structure in a conjugate with LA and structure–property relationships. For this purpose, MoS2 was functionalized with LA using sonochemical aqueous dispersion based procedure. The results of XRD analysis showed that the LA–MoS2 conjugate forms an one layer per repeat, trigonal prismatic 1H structure with random stacking and folding. Close inspection of HR-TEM images reveals that stacked and folded LA–MoS2 has a twisted layer configuration and an edge covalent linkage between MoS2 and LA, along with an intact crystalline basal plane. The material was shown by using by XPS analysis to have 10% degree of covalent edge functionalization. Finally, the combined results of atomic force microscope (AFM) and Raman studies show that the LA–MoS2 conjugate has a nanoflake like, few-layered structure with a width of a few hundred nanometers.

Results and discussion

Lipoic acid (LA) (Fig. 1a) is an important naturally occurring organosulfur compound that is required in a number of biochemical process involved in aerobic metabolism and it used as antioxidant.29 LA has been utilized as a ligand for coordination with quantum dot. In addition, it has been linked to the CdSe core–ZnS shell using a disulfide bond. Coordination to LA causes the stabilities of quantum dots to be enhances and it creates a site for chemical functionalization.30 Therefore, biologically compatible LA is expected to covalently-link MoS2, and provide anionic stable dispersion due to carboxylic acid moiety of LA, which can be further functionalized by carbodiimide chemistry. This conjugate will be useful for Bio-23,27 and optoelectronic24 applications. Unlike in earlier studies where a two-step approach was used to form the IT MoS2 polytype, in the current investigation LA was used directly to covalently edge-functionalize and disperse as-supplied MoS2 (as-MoS2) in aqueous media. A facile sonochemical method was utilized for this purpose. As illustrated in Fig. 1a, sonication of a mixture of LA and as-MoS2 with an average size of ca. 6 μm in deionized water for 3 h, followed by adjusting the pH to 6.5, and subsequent centrifugation (optional) produces a stable (up to few months) aqueous dispersion.
image file: c6ra00901h-f1.tif
Fig. 1 (a) Schematic illustration of covalent edge functionalization of the LA–MoS2 conjugate. θ denotes the twist angle between two MoS2 layers. (b) Photograph of the LA–MoS2 dispersion in water.

Zeta (ζ) potential values of the dispersion [Fig. S1 of ESI] range from −41 to −31 mV, irrespective of centrifugation speed [3 to 100kg, where g is gravitational force (9.8 m s−2)] used. The negative sign of the ζ values originate from the fact that LA–MoS2 in the dispersion contains carboxylate groups (Fig. 1a). Importantly, it is known that when its absolute ζ value is greater than 30 mV, a dispersion maintains good colloidal stability.31 The reason for being slight decrease (from −41 to −31 mV) in ζ potential values as increasing g force seems to originate from stacking degree of edge-functionalized LA–MoS2 conjugate as will be explained in later section. It is well-known that higher centrifugal force precipitates large MoS2 bundles. Therefore, bundled LA–MoS2 which is abundant in lower g force has stacked LA–MoS2 with large number of edge-functionalized carboxylate, leading to higher ζ value whereas few-layered LA–MoS2 obtained by higher g force has smaller ζ value.

The optimal dispersion protocol was obtained by changing sonication time and LA amount. Fig. S2a and b show UV-vis-NIR extinction spectra by varying sonication time (0.5, 1, 3, and 6 h) and LA amount (0.5, 1, 5, 10, 80 mM), respectively. While increasing LA amount results in slightly increased optical density of extinction spectra, prolonged sonication time leads to proportional optical density increase of the resulting dispersion. This suggests that sonication time is more effective to achieve higher yield of LA–MoS2 conjugate dispersion than varying LA amount. Finally, the dispersion containing the LA-functionalized MoS2 conjugate (Fig. 1b), prepared by optimal condition (i.e., 3 h sonication of a mixture of 5 mM LA, 50 mg MoS2 in 30 mL water with pH 6.5, followed by 1 h 10kg centrifugation), has a dense greenish black color.

Information showing that LA-functionalized MoS2 has randomly-stacked trigonal prismatic 1H configuration was obtained by using XRD. A thin film of LA–MoS2 was prepared by transferring a mat obtained by filtering a dispersion through a solvent-dissolvable membrane to a glass substrate (see Experimental). The XRD pattern of the as-MoS2 powder, utilized as a control (Fig. 2a), displays various and strong (hkl) peaks. Analysis of the diffractogram suggests the existence of not only interlayer ordering such as (00l) but also in-plane related higher ordering (i.e., (113), (134), etc.), the intensities and positions of the peaks match those of semiconducting 2H MoS2 (red) that has a P63/mmc space group [provided by Joint Committee on Power Diffraction Standards (JCPDS) card no. 37-1492]. The strongest (002) peak in the pattern is positioned at 14.34° and corresponds to d(002) = 6.17 Å of the 2H MoS2 structure.


image file: c6ra00901h-f2.tif
Fig. 2 XRD patterns of (a) as-MoS2 powder and (b) LA–MoS2 film. The peak pattern given in red in (a) is the XRD intensity spectrum of 2H MoS2 powder obtained from JCPDS card. Insets in (a) and (b) are pictorial illustrations of the alignments of MoS2 suggested from each XRD pattern.

In contrast to that of as-MoS2, the XRD pattern of the LA-functionalized MoS2 is consistent with the existence of a randomly stacked 1H structure devoid of interlayer ordering, as shown in inset of Fig. 2b. XRD pattern of LA–MoS2 (Fig. 2b) contains broadened peaks for (002), weaker higher order (00l) MoS2 peaks (see ×10 spectrum), and the absence of peaks associated with various (hkl) diffractions except for the (00l) peaks. The fact that in-plane 2H MoS2 ordering [i.e., (hkl)], does not occur in LA–MoS2 yet out-of-plane ordering is retained in the latter material indicates that the random stacking of layers takes place in LA–MoS2. Folding and stacking of MoS2 are spontaneous processes, which have been observed previously.24,32 Because the surface energy (46.5 mJ m−2 at 298 K)33 of the basal plane of few-layered MoS2 is markedly different from that of water (72 mJ m−2), edge-functionalized exfoliated LA–MoS2 seems to have a tendency to stack and fold with random configurations in an aqueous environment. A similar trend exists in edge-functionalized graphene,34,35 whose XRD pattern contains a (001) diffraction peak position that is the same as that of graphite, a broadened (00l) diffraction peak, while various (hkl) diffraction peaks are absent. Based on the XRD observations, it appears that chemical modification of MoS2 with LA leads to formation of an edge-functionalized crystalline structure (right inset of Fig. 2b).

Moreover, although the position of the (002) peak in the XRD pattern of LA–MoS2 is similar to that of as-MoS2, its full-width at half maximum (FWHM: 0.48°) is greater than that (0.16°) of the (002) peak of 2H as-MoS2. Analysis using Debye–Scherrer's equation,36 which shows that the crystallite domain size is inversely proportional to the FWHM, broadening of (002) peak in the XRD pattern of LA–MoS2 suggests that it exists in smaller size crystals compared to as-MoS2. In addition, the similarity between its (002) peak position and that of as-MoS2 indicates that negligible LA intercalation between basal plane of MoS2 layers exists in LA–MoS2. This observation contrasts starkly with those made in studies of basal-plane metal-intercalated MoS2,37 whose XRD (002) peak position is shifted to a smaller angle.

In Fig. 3 are displayed TEM images of the LA–MoS2 conjugate. Analysis of the images shows the stacking and folding configurations of this material along with the edge location of the functionality. The low magnification TEM image (Fig. 3a) contains several few-layered MoS2 flakes with lateral lengths of several hundred nanometres. LA–MoS2 nanoflakes exhibit dominant stacking and folding features. In addition, straight lines (red arrows) seen in the images originate from folded MoS2 edges and the irregular boundary stems from bare edges. The basal plane of a LA–MoS2 flake (Fig. 3b) is comprised of a hole-free, well-arranged hexagonal MoS2 sheet along with minor organic residues on the surface. The fact that that crystalline LA–MoS2 is free of basal defects contrasts with the properties of materials made from lithiated MoS2 by using other basal plane functionalization methods.24,32 Materials made using these approaches have basal planes that contain holes and cracks.24 This finding suggests that the basal plane of MoS2 in flakes of the LA–MoS2 conjugate remains unreacted during the functionalization process. This result is consistent with the observation that position of the (002) peak in the XRD pattern of LA–MoS2 is similar to that of as-MoS2. The corresponding fast Fourier-transform (FFT) image contains two sets of intensity-different six-fold symmetry patterns. The six-fold symmetry originates from the (100) diffraction that has a relative rotation angle of ca. 15.4°. Thus, the MoS2 layers are randomly stacked during functionalization with LA (see additional TEM images in Fig. S2b and d of ESI). The combined results demonstrate that LA edge functionalization is benign method that preserve the in-plain crystallinity of MoS2.


image file: c6ra00901h-f3.tif
Fig. 3 TEM images showing the morphologies of LA–MoS2 flakes. (a) Low magnification TEM image of several LA–MoS2 flakes. HR-TEM images of (b) basal plane, and (c) folded edges. Inset: Fourier transform pattern. (d) Edges of twisted few-layered LA–MoS2, and (e) localized folded structures (yellow marker) on the MoS2 plane.

Consistent with the observations summarized above is the fact that the folded edges (Fig. 3c) of the LA–MoS2 conjugate are relatively clean and contain fewer functional groups. Interestingly, closer inspection of the folded edges reveals that the edge terrace of the MoS2 layers (red arrows) and folded vertex (yellow arrows) possess a large number of physisorped LA, suggesting that functionalization by LA occurs at dangling bond sites of MoS2 edge. The bare edge (Fig. 3d) of the conjugate also contains irregularly-shaped physisorped LA at the end of the crystalline MoS2 boundary, along with aforementioned twisted few-layered MoS2 with a rotation angle of 18.6° (inset). Moreover, localized folding features exist on the MoS2 sheet (Fig. 3e) with ca. 6.5 Å spacing, which closely matches the XRD determined interlayer distance of 6.2 Å. The variation in the layer spacing between folds is likely a consequence of differently-spaced twisted MoS2 layers,38 along with the acuteness of the folded structure. Overall, direct evidence has come from the TEM analysis to show that LA–MoS2 nanoflakes have a randomly-rotating stacked and folded layer configuration with various types of edge LA-functionalization including bare, terrace, and folded apex.

The results of XPS studies provide information about the nature of the covalent edge functionalization in the LA–MoS2 conjugate. In Fig. 4a and b are displayed the Mo3d, S2s, and S2p regions of the XPS acquired using as-MoS2 and LA–MoS2 samples. Deconvolution using a voigt fit shows that the Mo spectrum of as-MoS2 is comprised of peaks at 232.7 and 229.5 eV (red lines), which agree well with the expected 2H MoS2 doublet peak arising from Mo4+3d3/2 and 3d5/2 as a consequence of spin–orbit coupling.39 The 0.78 ratio of the areas in the d doublet of the individual peaks is slightly larger than the predicted value of 0.66.40 Similar to that observed for Mo, the S2p doublet in the spectrum of as-MoS2 is comprised of two major peaks at 163.6 and 162.4 eV, which correspond to 2p1/2 and 2p3/2, respectively, associated with the 2H phase. It is noteworthy that oxidation-related peaks of Mo (ca. 236 eV) and S (ca. 168 eV) are negligible.


image file: c6ra00901h-f4.tif
Fig. 4 XPS of (a) as-MoS2 and (b) LA–MoS2. Black dots: original data, grey curves: integrated value of voigt curve fitting.

The Mo3d spectrum of LA-functionalized MoS2 (Fig. 4b) contains peaks at 232.7 and 229.6 eV, which are nearly identical to those of the as-MoS2 2H peaks. This finding indicates that covalent functionalization of MoS2 by LA does not alter innate 2H polytypes. The position of the S2s peak is increased by ca. 0.9 eV and its intensity is enhanced in comparison to that (226.7 eV) of as-MoS2. The reason for the intensity increase is associated with the extra sulfur contained within unreacted LA.

The S2p spectrum reveals three sulfur species in LA–MoS2 conjugate. The deconvoluted S2p spectrum is comprised of three sets of doublets (Fig. 4d, purple, green, and red with 1.0, 1.4, and 1.1 eV doublet peak separations, respectively). The lower binding energy doublet (red) is comprised of peaks at 163.4 and 162.4 eV that are nearly identical to the position of the peaks in the 2H MoS2 doublet. Purple doublet (164.7 and 163.6 eV) is upshifted by 1.2 eV as compared to that of the 2H MoS2 doublet and originates from unbound, excess LA, based on its position.41

Green doublet upshifted by 0.7 eV as compared to that of 2H MoS2 doublet originates from covalently conjugated sulfur between LA and MoS2. Green doublet positions (162.7 and 164.1 eV) are situated between doublets originating from excess LA (purple doublet) and 2H MoS2. This doublet are alike that of alkyl-functionalized S2p of MoS2 (i.e., 162.9 and 164.0 eV),17,24,40 indicating successful edge covalent functionalization of LA on MoS2 by forming Mo–S-alkyl covalent bridge. A comparison of the area of the functionalized sulfur doublet peak (green) with those associated with the 2H structure (red) indicates that ca. 10% of total sulfur content stems from covalent functionalization. In addition, the large oxidation peak of S2p (inset of Fig. 4b) observed at 168.7 eV originates from sulfate species formed from LA42 upon exposure of the sample to air and water.43 The presence of sulfate derivatives of LA–MoS2 could be responsible for additional anionic dispersion stability in the water.

Further characterizations of covalent LA–MoS2 conjugate were performed with Fourier Transform Infrared spectroscopy (FT-IR) (see Experimental for sample preparation). Fig. S4a to c shows IR spectra of as-MoS2, LA salt, and LA–MoS2 conjugate. IR spectrum from MoS2 shows flat baseline except 464 cm−1, corresponding to Mo–S stretch vibration.44 On the other hands, LA salt and LA–MoS2 share similar vibrational features originating from LA. LA salt sample shows stretch vibration of aliphatic C–H at 2926 and 2853 cm−1, and LA–MoS2 shows those features at 2924 and 2854 cm−1.23 In addition, LA salt shows a broad carboxylate stretch band at 1564 cm−1, and LA–MoS2 displays the same band at 1556 and 1624 cm−1.45 These results indicate that LA are successfully functionalized onto MoS2. Moreover, unlike the case of LA salt, LA–MoS2 shows strong protonated and salt form of sulfate peak at 1261, 1089 and 1049 cm−1, in line with previous sulfate peak on LA-quantum dot conjugate,42 confirming the sulfate moiety formation discussed in the XPS result. The magnified IR spectra from 400 to 600 cm−1, due to low response of S–S bond shows that LA salt displays multiple peaks (486 and 449 cm−1), corresponding to S–S stretch vibration of LA.45 The reason for being two peaks seems to originate from isomer of lipoic acid we used. In the meanwhile LA–MoS2 displays only 470 cm−1, originating from Mo–S stretch vibration, without any bands from S–S stretch. This indirectly supports that S–S bond disappears by conjugating LA with MoS2. Moreover, the LA functionalization degree of the resulting LA–MoS2 conjugate was confirmed by using TGA analysis. Fig. S5 shows weight (wt) loss trace of LA–MoS2, along with those of LA salt and as-MoS2 for comparison, with 5 °C ramping rate under nitrogen atmosphere. First, LA salt shows three major wt losses at 262, 437, and 722 °C, whose remaining wt% are 91.6, 58.7, and 31.8, respectively. For comparison, as-MoS2 starts to show gradual weight loss at 475 °C, which is similar to that of MoS2 in the literature.32,46 On the other hand, LA–MoS2 shows 98.9% remaining weight at 262 °C which corresponds to first wt loss of LA salt. Based on this, we estimate that sulfur of MoS2 is functionalized with LA by 8.7%, which is in good agreement with 10% functionalization determined by XPS results.

AFM analysis confirms that the formed LA–MoS2 flakes mainly consist of a few layers. For obtaining accurate measurements, the LA–MoS2 sample was dropcast on piranha-cleaned 285 nm thick SiO2/Si substrate. The resulting sample was washed with copious amounts of water and dried (see Experimental for detail). Inspection of the height topography (Fig. 5a) show that the LA–MoS2 flakes are irregularly shaped (see Fig. S3 for additional AFM image) in a manner that is similar to dispersed MoS2 flakes generated by using sonochemistry.26 In some cases, the LA–MoS2 nanoflakes form large aggregates (Fig. S3b). Finally, the flakes (Fig. 5b) have an average height of 2.0 nm, which corresponds to that of trilayered MoS2.6,47


image file: c6ra00901h-f5.tif
Fig. 5 (a) AFM height topography of LA–MoS2 flakes on a 285 nm thick SiO2/Si substrate. (b) Height profile along yellow line in (a). (c) Raman spectrum of circled part in (a) excited by using a 532 nm laser. (d) Height and (e) length histograms of 50 different LA–MoS2 flakes.

The Raman spectrum (Fig. 5c) of LA–MoS2, excited by 532 nm, contains a band at 383.7 cm−1, corresponding to an in-plane E12g mode, and at 405.6 cm−1 for an out-of-plane A1g mode.42,43 It is well-known that as the layer numbers of MoS2 increase the respective E12g and A1g peaks shift to lower and higher frequencies. Moreover, the interpeak separation can be used to determine the numbers layer that exist in the nanoflake.47,48 By using this relationship, the observed peak separation of ca. 22 cm−1 corresponds to three layers6,47 value that compares well with that determined from AFM measurements. Height profile analysis of 50 different flakes shows that height (Fig. 5d) is 1.8 nm, the full-width at half maximum is 0.6 nm, and the average lateral length (Fig. 5e) is ca. 240 nm. The latter value is much smaller than that of as-MoS2 (ca. 6 μm).

Following an evaluation of its solid properties, LA–MoS2 dispersion was subjected to optical characterization. In Fig. 6a is given the UV-vis-NIR extinction spectra of aqueous the LA–MoS2 dispersion following centrifugation at 10[thin space (1/6-em)]000g. Bands in the extinction spectrum of the dispersion are centred at 387, 431, 609, and 667 nm that lie on top of broad extinction band. The four peaks correspond to D, C, B, and A excitons of MoS2 (ref. 12, 49 and 50) in that order. Those positions are in good agreement with those (ca. 610 and 660 nm) observed in chemically exfoliated few-layered MoS2.39,40 This observation supports the conclusion that the LA–MoS2 conjugate has a few-layered structure. As seen by inspection of the energy dispersion diagram displayed in Fig. 6b, while the D and C excitons originate from indirect transitions at a near zone center Γ and Λ in the Brillouin zone,49 the A and B excitons11,12 stem from direct transitions at zone boundary K due to spin–orbit coupling separated by ca. 160 meV. Under 635 nm laser irradiation, the sample of LA–MoS2 displays strong scattering (data not shown). The fact that extinction spectrum extends beyond the band edge (660 nm) suggests that this materials is comprised of particles that have a sufficiently large size to scatter incident light. However, the LA–MoS2 sample does not photoluminescence at 660 and 840 nm, which would originate from direct and indirect transitions.11 The absence of emission is presumably a result of the stacking and folding nature of the conjugate. In any event, analysis of the extinction spectrum provides information that is in line with the results of the TEM and AFM experiment and suggests that the LA–MoS2 conjugate is composed of particles whose sizes are comparable to the excitation light of a few hundred nm.


image file: c6ra00901h-f6.tif
Fig. 6 (a) UV-vis-NIR extinction spectra of LA–MoS2 (solid) and LA (dash). (b) The corresponding energy dispersion in the Brilloiun zone. C.B. and V.B. denote conduction and valence bands, respectively.

The remaining question to be answered is how MoS2 sheet is only edge-functionalized with LA. Previous work has suggested unstable Mo-terminated edges with higher sulfur affinities.23,51 Highly energetic ultrasonication renders various vacancies, defects, and tears in MoS2. For instance, when MoS2 sheet is torn upon sonication (Fig. 7a), it produces both sulfur terminated and Mo terminated edges. Mo terminated edges need energetically favourable “dimeric sulfur” (i.e., two sulfurs connected to same Mo), according to theoretical calculation.51 Energy gain for Mo edge to form dimeric sulfur is ca. 269 kJ mol−1,51 and is enough to form two Mo–S bonds of LA (Fig. 7b). Moreover, the distance between the nearest sulfurs linked to a Mo in 2H MoS2 sheet is ca. 3.17 Å. This is similar distance (3.29 Å) between sulfur moieties of dihydrolipoic acid whose configuration was obtained by energy-minimization at the Hartree Fock (HF)/STO-3G level of theory (see Experimental). This can facilitate LA functionalization to MoS2 edges without additional energetic cost. Moreover, the aforementioned random stacking of LA–MoS2 sheet is also expected to assist edge functionalization by protecting basal plane. This is in good agreement with favourable edge functionalization over basal plane observed in previous literature.52–55


image file: c6ra00901h-f7.tif
Fig. 7 Suggested mechanism for edge functionalization of LA with Mo edges of MoS2. (a) Sonication-assisted MoS2 tearing, producing S- and Mo-terminated edge. (b) Preferential Mo edge functionalization with dihydrolipoic acid due to favourable geometry.

Conclusions

In the investigation described above, we have devised a simple, one-step, sonication method to produce a lipoic acid edge-functionalized, semiconducting MoS2 dispersion. In this process, LA covalently bonds to the edges of MoS2 to produce a LA–MoS2 conjugate that has stacked and folded layers aligned with a random relative rotation angle owing to the absence of basal plane chemical functional groups. The dispersion behaves as a stable anionic colloid because of the presence of the carboxylate moiety of the LA component. That LA–MoS2 possesses a relative rotation angle is evidenced by the interesting (00l) XRD pattern, along with twisted six-fold symmetry pattern observed by using HR-TEM. Especially, interesting is the fact that covalent linked LA groups are localized along various edges of the conjugate (i.e., bare, terrace, and vertex edges). The LA–MoS2 conjugate displays typical few-layered characteristics such as the height of the flakes being ca. 2.0 nm and a Raman interpeak separation of 22 cm−1. This study provides a protocol for fabrication of edge-functionalized MoS2 with high degree of crystallinity. This finding should serve as a method for forming solution-processable chemically functionalized MoS2 which has potentially important uses in optoelectronic and biochemical applications.

Experimental

1. Materials and methods

MoS2 powder [Cat. #: 69860, size: ca. 6 μm (max. size: 40 μm)] was obtained from Sigma Aldrich. Isomeric mixture of LA (DL-α-LA, 98%) was purchased from Wako Pure Chemicals. Deionized water having resistance greater than 18.2 MΩ was used to disperse MoS2. ζ potentials were acquired using a Zen3600 zetasizer (Malvern instruments). The sample was introduced into a zeta dip cell (ZEN1002) with thermal controller and stabilized at 25 °C in order to reach thermal equilibrium. The potential values were determined by averaging the results of several measurements. Raman measurements were made using a custom-made setup with 532 nm laser and 1800 lines per mm grating, according to previous work.56 Prior to Raman and AFM measurements, a 150 μL sample was dropcasted on a 285 nm thick SiO2/Si substrate (P++-doped, Shinetsu) and then subjected to drying by using a nitrogen stream. A 50 μW laser was used to prevent unwanted sample damage. UV-vis-NIR extinction spectra were acquired using a JASCO V-770 with a cuvette having 1 cm path length. For the FT-IR and TGA measurements, the filtered LA–MoS2 sample on a filter paper was washed with copious amounts of water and ethanol several times, in order to remove unreacted LA. LA was neutralized to form LA sodium salt by reacting with sodium hydroxide, for comparison purpose of LA–MoS2 salt form. Samples are ground with completely dried KBr power to produce a pellet for IR measurements. FT-IR spectra were acquired with Vertex 70 (Bruker) and were obtained by 32 times accumulation. TGA measurements were conducted by TGA-50 (Shimadzu). Temperature of the samples in an aluminium fans was raised from rt to 900 °C with a ramping rate of 5 °C under nitrogen atmosphere. Energy minimization of dihydrolipoic acid was conducted in vacuum by using Gaussian 09W57 with HF/STO-3G basis set.

2. Preparation of LA–MoS2 conjugate

Optimal method is following. A 32 mg (0.15 mmol) sample of LA was added to 30 mL deionized water and the pH of the resulting solution was adjusted to 6.5. After LA was completely dissolved, 50 mg of MoS2 was added. The resulting mixture was tip-sonicated (probe tip diameter: 13 mm, VCX 750, Sonics & Materials) for 3 h at 300 W. The upper 80% supernatant was collected after 10kg centrifugation using a fixed angle rotor (Hanil supra 22k). For centrifugal force dependent measurements, samples were collected after various centrifugal forces (3, 10, 15, 30, 50, and 100kg) using an optional swing-bucket rotor (SW41 Ti, Beckman Coulter).

3. LA–MoS2 film preparation

Film preparation followed a procedure developed in our earlier work.58 A 10 mL aliquot of the LA–MoS2 conjugate dispersion was subjected to 10kg centrifugation and filtered through a mixed cellulose ester membrane (pore size: 0.2 μm, lot. #: 00728200, Advantec). Washing the precipitate with copious amounts of water was utilized to remove excess LA. Before the LA–MoS2 film on the membrane was completely dried, the sample side on the membrane was firmly pressed onto a piranha-cleaned slideglass, and then placed into acetone-vapor reflux chamber overnight so that the membrane slowly dissolved away. The resulting films were used for XRD measurements.

XRD measurements: X-ray diffractograms of the samples were obtained via Rigaku Ultima IV using Cu Kα radiation (λ = 1.541 Å) and scan speed of 2° min−1. The sample on a slideglass was placed onto the XRD mount. The resulting spectra were compared with standards in JCPDS PDF No. 37-1492.

4. TEM measurements

HR-TEM measurements were conducted using either JEOL JEM-ARM 200F or JEOL 2100, with 200 kV acceleration voltage. Copper TEM grids covered with an ultra-thin carbon support film on a lacey carbon support [LC200-Cu (Lot#: 110727), 200 mesh, Ted Pella] were used. A 20 μL LA–MoS2 sample was dropcast on the TEM grid. After 3 min of incubation, and excess dispersion was removed by wicking off with Kimwipers and water washing.

5. XPS measurements

XPS data were acquired with K-alpha (Thermo Scientific, U.K.). A monochromatic X-ray source (Al Kα line: 1486.6 eV), whose beam size is 400 μm, was used with power of 12 kV and 3 mA. Survey scans were acquired with 100 eV pass energy at resolution of 1 eV. Detailed scans were obtained at 20 eV pass energy with a resolution of 0.05 eV. The acquired spectra were baseline-subtracted using Shirley profile. C1s carbon peak (284.8 eV) of adventitious carbon and LA were used as internal references for as-MoS2 and LA–MoS2, respectively.

6. AFM measurements

AFM measurements were conducted using a commercial AFM (Nanowizard I, JPK instrument) installed onto an inverted microscope (Zeiss). Al-coated silicon AFM cantilevers (spring constant: 13–77 N m−1, frequency range: 200–400 kHz, AppNano) were used to obtain tapping mode imaging, whose pixel size are 512 × 512. Polynomial flattening routine was applied to height topography.

Acknowledgements

The authors thank YJ Jeong for initial help for sample preparation and E. Koo for energy minimization of dihydrolipoic acid. This research was supported financially by the Basic Science Research Program through the National Research Foundation of Korea (NRF) funded by the Ministry of Education, Science and Technology (2014R1A1A2055572), and in part by the Yonsei University Future-Leading Research Initiative of 2014.

Notes and references

  1. K. S. Novoselov, D. Jiang, F. Schedin, T. J. Booth, V. V. Khotkevich, S. V. Morozov and A. K. Geim, Proc. Natl Acad. Sci. USA, 2005, 102, 10451–10453 CrossRef CAS PubMed.
  2. W. O. Winer, Wear, 1967, 10, 422–452 CrossRef CAS.
  3. D. Voiry, M. Salehi, R. Silva, T. Fujita, M. Chen, T. Asefa, V. B. Shenoy, G. Eda and M. Chhowalla, Nano Lett., 2013, 13, 6222–6227 CrossRef CAS PubMed.
  4. K.-K. Liu, W. Zhang, Y.-H. Lee, Y.-C. Lin, M.-T. Chang and C.-Y. Su, et al., Nano Lett., 2012, 12, 1538–1544 CrossRef CAS PubMed.
  5. B. Radisavljevic, A. Radenovic, J. Brivio, V. Giacometti and A. Kis, Nat. Nanotechnol., 2011, 6, 147–150 CrossRef CAS PubMed.
  6. H. S. Lee, S.-W. Min, Y.-G. Chang, M. K. Park, T. Nam, H. Kim, J. H. Kim, S. Ryu and S. Im, Nano Lett., 2012, 12, 3695–3700 CrossRef CAS PubMed.
  7. D. Yi, W. Yanli, J. Jun, S. Lin, S. Siqi and T. Weihua, Physica B, 2011, 406, 2254–2260 CrossRef.
  8. Q. H. Wang, K. Kalantar-Zadeh, A. Kis, J. N. Coleman and M. S. Strano, Nat. Nanotechnol., 2012, 7, 699–712 CrossRef CAS PubMed.
  9. F. Wypych and R. Schollhorn, J. Chem. Soc. Chem. Commun., 1992, 1386–1388 RSC.
  10. F. Wypych, K. Sollmann and R. Schöllhorn, Mater. Res. Bull., 1992, 27, 545–553 CrossRef CAS.
  11. A. Splendiani, L. Sun, Y. Zhang, T. Li, J. Kim, C.-Y. Chim, G. Galli and F. Wang, Nano Lett., 2010, 10, 1271–1275 CrossRef CAS PubMed.
  12. K. F. Mak, C. Lee, J. Hone, J. Shan and T. F. Heinz, Phys. Rev. Lett., 2010, 105, 136805 CrossRef PubMed.
  13. S. Mouri, Y. Miyauchi and K. Matsuda, Nano Lett., 2013, 13, 5944–5948 CrossRef CAS PubMed.
  14. K. E. Dungey, M. D. Curtis and J. E. Penner-Hahn, Chem. Mat., 1998, 10, 2152–2161 CrossRef CAS.
  15. Z. Zeng, T. Sun, J. Zhu, X. Huang, Z. Yin and G. Lu, et al., Angew. Chem., Int. Ed., 2012, 51, 9052–9056 CrossRef CAS PubMed.
  16. H. S. S. Ramakrishna Matte, A. Gomathi, A. K. Manna, D. J. Late, R. Datta, S. K. Pati and C. N. R. Rao, Angew. Chem., Int. Ed., 2010, 49, 4059–4062 CrossRef PubMed.
  17. D. Voiry, A. Goswami, R. Kappera, E. SilvaCecilia de Carvalho Castro, D. Kaplan, T. Fujita, M. Chen, T. Asefa and M. Chhowalla, Nat. Chem., 2015, 7, 45–49 CrossRef CAS PubMed.
  18. H. J. Conley, B. Wang, J. I. Ziegler, R. F. Haglund, S. T. Pantelides and K. I. Bolotin, Nano Lett., 2013, 13, 3626–3630 CrossRef CAS PubMed.
  19. A. Castellanos-Gomez, R. Roldán, E. Cappelluti, M. Buscema, F. Guinea, H. S. J. van der Zant and G. A. Steele, Nano Lett., 2013, 13, 5361–5366 CrossRef CAS PubMed.
  20. J. N. Coleman, M. Lotya, A. O'Neill, S. D. Bergin, P. J. King and U. Khan, et al., Science, 2011, 331, 568–571 CrossRef CAS PubMed.
  21. V. Nicolosi, M. Chhowalla, M. G. Kanatzidis, M. S. Strano and J. N. Coleman, Science, 2013, 340, 1226419 CrossRef.
  22. Z. Tang, Q. Wei and B. Guo, Chem. Commun., 2014, 50, 3934–3937 RSC.
  23. S. S. Chou, M. De, J. Kim, S. Byun, C. Dykstra, J. Yu, J. Huang and V. P. Dravid, J. Am. Chem. Soc., 2013, 135, 4584–4587 CrossRef CAS PubMed.
  24. K. C. Knirsch, N. C. Berner, H. C. Nerl, C. S. Cucinotta, Z. Gholamvand and N. McEvoy, et al., ACS Nano, 2015, 9, 6018–6030 CrossRef CAS PubMed.
  25. K. Zhou, J. Liu, P. Wen, Y. Hu and Z. Gui, Appl. Surf. Sci., 2014, 316, 237–244 CrossRef CAS.
  26. J. Kang, J.-W. T. Seo, D. Alducin, A. Ponce, M. J. Yacaman and M. C. Hersam, Nat. Commun., 2014, 5, 5478 CrossRef CAS PubMed.
  27. T. Liu, C. Wang, W. Cui, H. Gong, C. Liang, X. Shi, Z. Li, B. Sun and Z. Liu, Nanoscale, 2014, 6, 11219–11225 RSC.
  28. C. Backes, N. C. Berner, X. Chen, P. Lafargue, P. LaPlace, M. Freeley, G. S. Duesberg, J. N. Coleman and A. R. McDonald, Angew. Chem., Int. Ed., 2015, 54, 2638–2642 CrossRef CAS PubMed.
  29. L. Packer, E. H. Witt and H. J. Tritschler, Free Radic. Biol. Med., 1995, 19, 227–250 CrossRef CAS PubMed.
  30. H. Mattoussi, J. M. Mauro, E. R. Goldman, G. P. Anderson, V. C. Sundar, F. V. Mikulec and M. G. Bawendi, J. Am. Chem. Soc., 2000, 122, 12142–12150 CrossRef CAS.
  31. D. H. Everett, Basic pinciples of Colloid Science, Roayl Society of Chemistry, London, 1988 Search PubMed.
  32. L. Zhou, B. He, Y. Yang and Y. He, RSC Adv., 2014, 4, 32570–32578 RSC.
  33. A. P. S. Gaur, S. Sahoo, M. Ahmadi, S. P. Dash, M. J. F. Guinel and R. S. Katiyar, Nano Lett., 2014, 14, 4314–4321 CrossRef CAS PubMed.
  34. I.-Y. Jeon, D. Yu, S.-Y. Bae, H.-J. Choi, D. W. Chang, L. Dai and J.-B. Baek, Chem. Mat., 2011, 23, 3987–3992 CrossRef CAS.
  35. I.-Y. Jeon, H.-J. Choi, S.-M. Jung, J.-M. Seo, M.-J. Kim, L. Dai and J.-B. Baek, J. Am. Chem. Soc., 2013, 135, 1386–1393 CrossRef CAS PubMed.
  36. Y. Waseda, M. Eiichiro and S. Kozo, X-Ray Diffraction Crystallography, Springer Berlin Heideberg, Berlin, 2011 Search PubMed.
  37. J. Zheng, H. Zhang, S. Dong, Y. Liu, C. Tai Nai, H. Suk Shin, H. Young Jeong, B. Liu and K. Ping Loh, Nat. Commun., 2014, 5, 2995 Search PubMed.
  38. J. He, K. Hummer and C. Franchini, Phys. Rev. B, 2014, 89, 075409 CrossRef.
  39. G. Eda, H. Yamaguchi, D. Voiry, T. Fujita, M. Chen and M. Chhowalla, Nano Lett., 2011, 11, 5111–5116 CrossRef CAS PubMed.
  40. C. Backes, R. J. Smith, N. McEvoy, N. C. Berner, D. McCloskey and H. C. Nerl, et al., Nat. Commun., 2014, 5, 4576 CAS.
  41. D. G. Castner, K. Hinds and D. W. Grainger, Langmuir, 1996, 12, 5083–5086 CrossRef CAS.
  42. J. Jiang, C. V. Conroy, M. M. Kvetny, G. J. Lake, J. W. Padelford, T. Ahuja and G. Wang, J. Phys. Chem. C, 2014, 118, 20680–20687 CAS.
  43. F. E. Stary, S. L. Jindal and R. W. Murray, J. Org. Chem., 1975, 40, 58–62 CrossRef CAS PubMed.
  44. J. Li, W. Tang, H. Yang, Z. Dong, J. Huang, S. Li, J. Wang, J. Jin and J. Ma, RSC Adv., 2014, 4, 1988–1995 RSC.
  45. A. G. Young, D. P. Green and A. J. McQuillan, Langmuir, 2007, 23, 12923–12931 CrossRef CAS PubMed.
  46. X. Wang, E. N. Kalali and D.-Y. Wang, J. Mater. Chem. A, 2015, 3, 24112–24120 CAS.
  47. C. Lee, H. Yan, L. E. Brus, T. F. Heinz, J. Hone and S. Ryu, ACS Nano, 2010, 4, 2695–2700 CrossRef CAS PubMed.
  48. H. Li, Q. Zhang, C. C. R. Yap, B. K. Tay, T. H. T. Edwin, A. Olivier and D. Baillargeat, Adv. Funct. Mater., 2012, 22, 1385–1390 CrossRef CAS.
  49. D. Kozawa, R. Kumar, A. Carvalho, K. Kumar Amara, W. Zhao and S. Wang, et al., Nat. Commun., 2014, 5, 4543 CAS.
  50. A. Chernikov, T. C. Berkelbach, H. M. Hill, A. Rigosi, Y. Li, O. B. Aslan, D. R. Reichman, M. S. Hybertsen and T. F. Heinz, Phys. Rev. Lett., 2014, 113, 076802 CrossRef PubMed.
  51. L. S. Byskov, B. Hammer, J. K. Nørskov, B. S. Clausen and H. Topsøe, Catal. Lett., 1997, 47, 177–182 CrossRef CAS.
  52. B. Hinnemann, P. G. Moses, J. Bonde, K. P. Jørgensen, J. H. Nielsen, S. Horch, I. Chorkendorff and J. K. Nørskov, J. Am. Chem. Soc., 2005, 127, 5308–5309 CrossRef CAS PubMed.
  53. T. F. Jaramillo, K. P. Jørgensen, J. Bonde, J. H. Nielsen, S. Horch and I. Chorkendorff, Science, 2007, 317, 100–102 CrossRef CAS PubMed.
  54. Y. Li, H. Wang, L. Xie, Y. Liang, G. Hong and H. Dai, J. Am. Chem. Soc., 2011, 133, 7296–7299 CrossRef CAS PubMed.
  55. K. Chang, Z. Mei, T. Wang, Q. Kang, S. Ouyang and J. Ye, ACS Nano, 2014, 8, 7078–7087 CrossRef CAS PubMed.
  56. E. Koo and S.-Y. Ju, Carbon, 2015, 86, 318–324 CrossRef CAS.
  57. M. J. Frisch, G. W. Trucks, H. B. Schlegel, G. E. Scuseria, M. A. Robb and J. R. Cheeseman, et al., Gaussian, Inc, Wallingford CT, 09W edn, 2009.
  58. W. Yoon, Y. Lee, H. Jang, M. Jang, J. S. Kim and H. S. Lee, et al., Carbon, 2015, 81, 629–638 CrossRef CAS.

Footnote

Electronic supplementary information (ESI) available: UV-vis-NIR extinction spectra and corresponding zeta potential table, FT-IR spectra, TGA analysis, additional TEM and AFM images. See DOI: 10.1039/c6ra00901h

This journal is © The Royal Society of Chemistry 2016
Click here to see how this site uses Cookies. View our privacy policy here.