
Preparation of PE/GO nanocomposites using in situ polymerization over an efficient, thermally stable GO-supported V-based catalyst†
He-Xin Zhangab,
Yan-Ming Hua,
Dong-Ho Leeb,
Keun-Byoung Yoon*b and
Xue-Quan Zhang*a
aKey Lab. of Synthetic Rubber, Changchun Institute of Applied Chemistry, Chinese Academy of Science, Changchun, China. E-mail: xqzhang@ciac.ac.cn
bDepartment of Polymer Science and Engineering, Kyungpook National University, Daegu, Korea. E-mail: kbyoon@knu.ac.kr
First published on 8th March 2016
Abstract
In the present article, an efficient and thermally stable vanadium (V)-based Ziegler–Natta catalyst supported on graphene oxide (GO) was synthesized. The resultant catalyst exhibited highly dispersed active sites along the surface, superior catalytic activity toward ethylene polymerization, and enhanced thermal stability, in contrast to the conventional VOCl3 catalyst. Interestingly, the resultant polyethylene (PE)/GO nanocomposite exhibited a higher thermal stability and better mechanical properties than PE obtained using VOCl3. Transmission electron microscopy reveals graphene homogeneously dispersed within the PE matrix.
Introduction
In recent years, several investigations have been conducted to manufacture tailored polymer nanocomposites using different types of carbon materials like carbon nanotubes,1 fullerenes,2 and graphene.3 The resultant polymer nanocomposites have shown remarkable improvements in their mechanical properties, thermal stability, flame resistance, and thermal and electrical conductivities. Despite their promising applications, graphene dispersion in polymers has always been a great challenge for polymer scientists because of the low compatibility of nanoparticles within a polymer matrix. This is especially the case when the selected polymer is non-polar, such as PE and polypropylene (PP).4 The issue of compatibility can be rectified using an in situ polymerization technique. For example, Dong et al.4c employed an in situ polymerization method to prepare PP/GO nanocomposites of well-dispersed graphene nanosheets in a PP matrix, which exhibited high electrical conductivity. Ramazani et al.4a prepared PE/GO nanocomposites using Mg(OEt)2 and a GO bi-supported titanium-based Ziegler–Natta catalyst. The resultant PE/GO nanocomposites exhibited enhanced thermal and mechanical properties compared to virgin PE (obtained using a TiCl4/Mg(OEt)2 catalyst). However, the drastic decrease in catalytic activity upon introduction of graphene presents a major problem. The catalytic activity declined ∼40% after introduction of GO into the Ziegler–Natta catalyst (TiCl4/Mg(OEt)2) for ethylene polymerization.Vanadium (V) catalysts have played a critical role in producing high-molecular-weight PE with a narrow molecular weight distribution, as well as ethylene/α-olefin or cyclo-olefin copolymers with high co-monomer incorporations.5 Several studies have reported that vanadium catalysts with alcohol or phenol ligands exhibited a higher activity toward olefin co-polymerization over their ligand-free counterparts.6 The hydroxyl and carboxyl functional groups of GO can serve as electron donating ligands that stabilize the valence state of V.7 This implies that well-dispersed PE/GO nanocomposites can be directly and efficiently produced by in situ olefin polymerization with a GO modified V-based Ziegler–Natta catalyst.
Experimental
Materials
Commercial VOCl3 (supported by PetroChina Jilin Petrochemical Company), ethylaluminum sesquichloride (EASC, AkzoNoble) and ethyl trichloroacetate (ETCA, J&K Scientific) were used as received. n-Hexane was refluxed and distilled over sodium/diphenylketyl under N2 before use. Ethylene (polymerization grade) was fed through two columns of P2O5 and CaSO4 before being directed into the reactor.Preparation of GO
GO was prepared according to a modified Hummer method.8 Briefly, 5 g of graphite and 2.5 g of NaNO3 were mixed together, followed by addition of 100 mL of H2SO4 under constant stirring in an ice bath. Next, 15 g of KMnO4 were slowly added in order to maintain a temperature below 5 °C. After the suspension reacted for 2 h in ice bath, the mixture was stirred for 60 min, and stirred for an additional 5 h in a 40 °C water bath. The resulting solution was diluted by adding 500 mL of water under vigorous stirring, and was further treated with a 30% H2O2 solution (15 mL) to ensure completion of the reaction with KMnO4. The resulting mixture was washed with HCl, followed by H2O, then filtered and freeze-dried.Preparation of GO-supported V-based catalyst
All manipulations of air- and/or moisture-sensitive compounds were carried out under a dry N2 or argon atmosphere using standard Schlenk techniques. The dried GO (0.3 g) was dispersed in n-hexane (300 mL) in a Schlenk flask at −10 °C, then an excess of VOCl3 (5 mL) was added dropwise over 10 min. After vigorous stirring for 1 h, the temperature was slowly raised to 60 °C and maintained for 5 h. Thereafter, the suspension was filtered and the precipitate was washed five times with n-hexane (ultrasonic assistant) to remove unreacted VOCl3. The resultant catalyst was then dried under vacuum.In situ ethylene polymerization
The polymerization was carried out in a 300 mL glass reactor equipped with a magnetic stir bar. The reactor was back-filled three times with N2, and charged with the 100 mL of n-hexane. At the stipulated temperature, the reaction solution was vigorously stirred under a continuous feed of ethylene for a desired period, after which the EASC co-catalyst was added to the reactor. After the EASC co-catalyst was added, the GO-supported V-based catalyst was injected and the polymerization initiated with a continuous ethylene feed. After a specified period, the polymerization was terminated by adding 10% HCl–methanol solution, and the mixture was poured into 400 mL of methanol to precipitate the polymer. The dry weight of the polymer was obtained after drying under vacuum at 60 °C, and used to calculate the catalytic activity (kg-PE per mol Ti per h per atm).Characterization
Scanning electron microscopy (SEM) images were taken on a XL30 ESEM FEG microscope. Transmission electron microscopy (TEM) images were taken on a HITACHI H-8100 microscope (Tokyo, Japan). X-ray photoelectron spectroscopy (XPS) data were collected on an ESCALAB MK II X-ray photoelectron spectrometer using Mg as the exciting source. The differential scanning calorimeter (DSC) measurements were performed on a Perkin-Elmer Pyris at a rate of 10 °C min−1 and the results of the second run were used for analysis. Thermalgravimetric analysis (TGA) was performed on a SDTQ600 thermal analyzer (TA Instruments). The samples for PE and its nanocomposites with a mass of 7.5 ± 0.2 mg were heated from room temperature at 10 °C min−1 under N2 atmosphere. The weight average molecular weight (Mw) and the molecular weight distribution (MWD) of the resultant polymer were determined at 135 °C by a PL-220 type high-temperature gel-permeation chromatograph (GPC) equipped with three PLgel 10 μm Mixed-B LS type columns. 1,2,4-Trichlorobenzene was employed as the solvent at a flow rate of 1.0 mL min−1 and a calibration was made using a polystyrene standard, EasiCal PS-1 (PL Ltd).Results and discussion
The fabrication process of PE/GO nanocomposites with well dispersed GO fillers through in situ polymerization method is summarized in Scheme 1. GO was first treated with excess VOCl3 in dry n-hexane solution under argon atmosphere. This process involved supporting VOCl3 catalysts to the GO surface with the formation of air and moisture sensitive adducts. The resultant catalyst in ethylene polymerization was evaluated after activation with an EASC co-catalyst. | ||
| Scheme 1 Fabrication of PE/GO nanocomposites by an in situ polymerization. | ||
The morphology of pristine GO and GO-supported catalyst were examined by SEM and TEM. As shown in Fig. 1a and b, the sheet structure of the graphene is retained subsequent to anchoring of a VOCl3 catalyst. In order to investigate the distribution of V element in the resultant catalyst, an EDX analysis was performed. Fig. 1c shows the corresponding EDX elemental mapping images of C, O, V, and Cl, further revealing that elemental V is uniformly distributed in whole GO sheets. In other words, the active site was well dispersed in the GO-supported V-based catalyst. The resulting GO-supported catalyst had a V content of 1.8 wt%, as determined by ICP. TEM analysis of cast film samples at 1.0 mg mL−1 in n-hexane was performed to further characterize the structure of the obtained GO-supported catalyst. The TEM image of a typical GO-supported V-based catalyst (Fig. 1d) shows that the V was well dispersed along the surface of the GO layers.
 | ||
| Fig. 1 SEM images of (a) GO and (b) GO-supported V-based catalyst; (c) elemental mapping images of GO-supported V-based catalyst; (d) TEM image of GO-supported V-based catalyst. | ||
The XPS analysis on GO and GO-supported V-based catalyst was conducted to investigate the surface chemical properties corresponding to the nature and reaction of the sample. The XPS spectra presented in Fig. 2a shows that the C, O, V, and Cl elements appear on GO-supported V-based catalyst, while only C and O are detected on pristine GO. The XPS data shows V peaks at 516.8 eV and 524.2 eV, Cl peaks at 197.9 eV (V–Cl bond), and 200.2 eV (C–Cl bond) for GO-supported V-based catalyst, indicating successful immobilization of the VOCl3 onto GO. This also suggests VOCl3 incorporation as opposed to surface absorption on the GO (Scheme 2).9 The C 1s peak region in the XPS spectrum of GO was deconvoluted into five peaks related to C![[double bond, length as m-dash]](https://www.rsc.org/images/entities/char_e001.gif) C, C–C, C–O, CO, and OC–O.10 With the introduction of VOCl3, the intensity of the functional peaks drastically declined. This phenomenon could be correlated to the chemical reaction of VOCl3 with the functional group on the GO surface, once again proving the chemical incorporation of VOCl3 on the GO surface. With respect to coordination polymerization with VOCl3, the catalyst is normally activated by an EASC co-catalyst. Thus, the XPS structure of GO and GO-EASC was investigated. As given in Fig. 2a, the Al (74.7 eV) and Cl peak (198.8 eV) are observed for EASC treated GO and GO-VOCl3. Additionally, a lower count of functional groups was measured after the reaction, corresponding to the chemical reaction occurred between GO and EASC.
C, C–C, C–O, CO, and OC–O.10 With the introduction of VOCl3, the intensity of the functional peaks drastically declined. This phenomenon could be correlated to the chemical reaction of VOCl3 with the functional group on the GO surface, once again proving the chemical incorporation of VOCl3 on the GO surface. With respect to coordination polymerization with VOCl3, the catalyst is normally activated by an EASC co-catalyst. Thus, the XPS structure of GO and GO-EASC was investigated. As given in Fig. 2a, the Al (74.7 eV) and Cl peak (198.8 eV) are observed for EASC treated GO and GO-VOCl3. Additionally, a lower count of functional groups was measured after the reaction, corresponding to the chemical reaction occurred between GO and EASC.
 | ||
| Fig. 2 XPS spectra of (a) survey area of GO, GO-VOCl3, GO-EASC, and GO-VOCl3-EASC and corresponding (b) C 2s spectra; (c) Cl 2p spectrum of GO-VOCl3; (d) Raman spectra of GO and GO-EASC. | ||
 | ||
| Scheme 2 Reaction mechanism of GO with VOCl3. | ||
The composition of GO, GO-VOCl3 and GO-VOCl3-EASC was further characterized by elemental analysis. As presented in Table 2, the C/O ratio in the present research is 1.2, 1.1 and 1.1 for GO, GO-VOCl3 and GO-VOCl3-EASC respectively.
The GO and GO-EASC was further studied by Raman analysis, and the spectra are given in Fig. 2d. The band appearing at 1360 cm−1 is assigned to the D-band, which originates from lattice distortion in sp2-hybridized carbon. The band observed at 1600 cm−1 is assigned to the G-band, which reflects the structural intensity of sp2-hybridized carbon atoms. The G-band represents the presence of crystalline graphitic carbon, while the D-band suggests a disordered graphite structure was present. The intensity ratio of the D and G bands (ID/IG) can be used to measure the degree of disorder of the samples.11 The ID/IG for GO was calculated to be ∼0.81 based on the data shown in Fig. 3, while the ratio for EASC-reacted GO was 0.59. After the introduction of EASC, the defects on the graphene carbon skeleton decreased, thus reducing the extent of distortion by the introduction of EASC. Dong et al.12 also observed the similar phenomenon for graphite oxide that reacted with n-BuMgCl reagent.
 | ||
| Fig. 3 XRD patterns of GO, GO-VOCl3 and GO-VOCl3-EASC. | ||
In Fig. 3, the XRD patterns of GO, GO-VOCl3 and GO-VOCl3-EASC are compared. The XRD pattern of GO shows a sharp, tall peak at approximately 12.1°, which is the characteristic peak of GO, corresponding to a d-spacing of approximately 0.73 nm. The larger interlayer spacing than that of graphite (∼0.34 nm) is attributable to the presence of functional groups. After treatment with VOCl3 and EASC, the intensity of the peak decreased markedly, indicating that the functional groups of GO was chemical reacted with VOCl3 and EASC.13
The performance of the synthesized GO-supported V-based catalyst in ethylene polymerization was evaluated after activation with an EASC co-catalyst and summarized in Table 1. The catalytic activities were in the range of 286–1200 kg PE per mol V per h per atm depending on the catalyst feed, polymerization time, and temperature. The catalyst with an ETCA activator performed with an activity of 743 kg per PE mol V per h per atm (run 3), which was over 2 times that of the ETCA free system (run 1). This phenomenon could be ascribed to the continuous oxidation of low oxidation state V (inactive or less active) to a higher oxidation state (highly active) by ETCA.14 Thus, detailed investigations have been carried out by employing ETCA as an activator. In general, the polymer yield increased remarkably with increasing polymerization time and catalyst feed amount. For comparison, polymerization was also conducted using VOCl3. In contrast to the VOCl3 catalyst, the GO-supported catalyst exhibited relatively higher activity on the same catalyst feed (run 4, 6, 7 vs. 8, 9, 10). Such a phenomenon can be explained by the electron-donating properties of the GO, which could increase the electron density of V and stabilize the active species. These are favorable for the coordination polymerization of ethylene, therefore resulting in a better activity. Generally, the electron-donating ligand is beneficial for the thermal stability of the transition metal catalyst. Thus, polymerization at higher temperature was also investigated.
| Run | Cat. (mg) | t (min) | Temp. (°C) | Yield (g) | Activity (kg per mol V per h per atm) | GO content (wt%) | Tm (°C) | Tc (°C) | Mw (×10−4) | Mw/Mn |
|---|---|---|---|---|---|---|---|---|---|---|
| a Polymerization conditions: 100 mL n-hexane, EASC co-catalyst, [Al]/[V] = 50, [ETCA]/[V] = 3, 1 atm.b ETCA free.c 7 μmol VOCl3. | ||||||||||
| 1b | 20 | 30 | 20 | 1.2 | 343 | 1.7 | 134.4 | 120.2 | 27.2 | 2.4 |
| 2 | 20 | 15 | 20 | 2.1 | 1200 | 1.0 | 134.9 | 120.3 | 20.1 | 2.6 |
| 3 | 20 | 30 | 20 | 2.6 | 743 | 0.8 | 134.9 | 119.8 | 24.6 | 2.5 |
| 4 | 20 | 60 | 20 | 3.4 | 486 | 0.6 | 134.5 | 120.0 | 26.9 | 2.6 |
| 5 | 40 | 60 | 20 | 6.1 | 436 | 0.7 | 134.9 | 119.7 | 25.8 | 2.7 |
| 6 | 20 | 60 | 40 | 3.8 | 514 | 0.5 | 133.5 | 119.0 | 22.9 | 2.5 |
| 7 | 20 | 60 | 60 | 2.0 | 286 | 1.0 | 131.2 | 119.8 | 16.5 | 2.5 |
| 8c | — | 60 | 20 | 2.9 | 414 | — | 134.8 | 118.5 | 25.1 | 2.4 |
| 9c | — | 60 | 40 | 1.7 | 243 | — | 134.0 | 118.3 | 21.6 | 2.3 |
| 10c | — | 60 | 60 | 0.9 | 129 | — | 132.5 | 118.0 | 15.7 | 2.5 |
| C (wt%) | O (wt%) | C/O ratio | |
|---|---|---|---|
| GO | 45.8 | 38.1 | 1.2 |
| GO-VOCl3 | 38.5 | 36.9 | 1.1 |
| GO-VOCl3-EASC | 35.4 | 32.4 | 1.1 |
Regarding the VOCl3 catalyst, catalyst deactivation was observed at elevated polymerization temperatures from 20 °C to 60 °C (runs 8–10). For GO-supported catalyst, the catalytic activity initially increased, then decreased with increasing polymerization temperature. Thus, we could conclude that the thermal stability of the VOCl3 was enhanced by the introduction of the GO support. Adjustment of the polymerization parameters produced PE/GO nanocomposites with a GO content range of 0.5–1.7 wt%.
All the resultant PE/GO nanocomposites were characterized by DSC and GPC, and the results listed in Table 1. It was found that the melting temperature (Tm) of PE/GO nanocomposites was identical to that of PE itself. In addition, the DSC traces (Fig. 4a) were generally smooth curves with relatively sharp endothermic peaks, reflecting the overall homogeneity of the matrix PE. This implied that the GO-supported VOCl3 catalyst was homogeneous in terms of active site distribution in the GO as a whole. Non-isothermal crystallization temperature, Tc, was slightly increased by the addition of GO, compared to that of pure PE, indicating that the GO nanoplatelets can act as a nucleating agent. By extracting the neat PE from their GO containing raw products, the PE was revealed to have a slightly higher Mw than the PE obtained by a VOCl3 catalyst. As expected, the Mw of the resultant PE gradually decreased with increasing polymerization temperature (both VOCl3 and GO supported V-based catalyst). This may be due to a stronger chain transfer reaction at higher polymerization temperature. The GPC curves of the PE (extracted from PE/GO nanocomposites) obtained at different polymerization temperatures are given in Fig. 4b. The GPC traces are unimodal with narrow Mw/Mn. This also suggested that the active sites of the resultant catalyst are homogeneously distributed on the GO surface.
 | ||
| Fig. 4 (a) DSC and (b) GPC curves of PE/GO nanocomposites obtained at different polymerization temperatures. | ||
Furthermore, the morphology of the resultant PE/GO nanocomposite was investigated by TEM. Fig. 5 shows the TEM micrograph of the PE/GO nanocomposites. The relatively dark ripple lines can be observed, being the cross sections of GO layers that were in a disordered but well-dispersed state in the PE matrix.
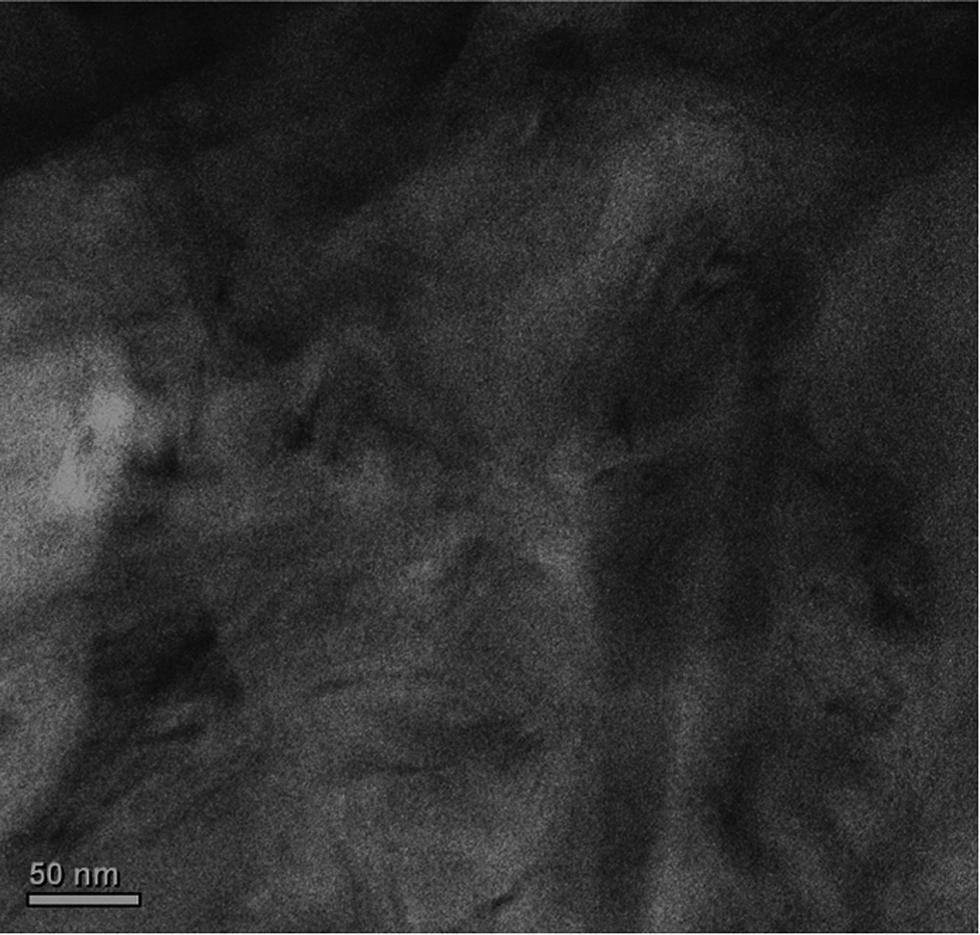 | ||
| Fig. 5 TEM micrograph of the PE/1.7 wt% GO nanocomposite. | ||
TGA of the PE/GO nanocomposites was carried out to assess its degradation temperature and thermal stability. Fig. 6 displays TGA curves for PE (run 9) and PE/GO nanocomposites with 0.5 wt% (run 6), 1.0 wt% (run 2) and 1.7 wt% (run 1) GO. One can see that all the TGA curves exhibit a single degradation. The degradation temperature at 5 wt% loss of the PE/GO nanocomposites are 433 °C, 437 °C and 439 °C for 0.5 wt%, 1.0 wt% and 1.7 wt% GO, respectively. With a degradation temperature for 5 wt% loss of pure PE at 416 °C, the enhancement in thermal stability of PE in the presence of GO could be attributed to the high dispersion of GO, which may act as an insulator between the heat source and polymer surface where combustion occurs. Additionally, the GO layers may hinder the diffusion of volatile decomposition products within the PE/GO nanocomposites by promoting char formation.15 As shown in Fig. 6, the char yield of PE and PE/GO nanocomposites with 0.5 wt%, 1.0 wt% and 1.7 wt% GO are 0.2 wt%, 2.6 wt%, 3.7 wt% and 5.7 wt%, respectively. The char formed layer acts as a mass transport barrier that retards the escape of the volatile products generated as the PE decomposes.
 | ||
| Fig. 6 TGA curves of PE and PE/GO nanocomposites. | ||
The mechanical properties of PE and PE/GO (run 5) nanocomposites are presented in Table 3. The tensile strength and modulus of the resultant PE/GO nanocomposites is significantly enhanced with the incorporation of GO, even at only 0.7 wt% GO loading. Interestingly, elongation at break value of PE/GO nanocomposites was also improved. The better mechanical properties of PE/GO nanocomposites could be attributed to the well dispersion and the strong interfacial adhesion between GO and PE matrix.
| Sample | Tensile strength (MPa) | Modulus (MPa) | Elongation at break (%) |
|---|---|---|---|
| PE | 24.5 | 670 ± 15 | 620 ± 50 |
| PE/0.7 wt% GO | 27.5 | 690 ± 15 | 750 ± 50 |
Conclusions
In summary, we have successfully fabricated PE/GO nanocomposites with well-dispersed GO nanosheets using in situ polymerization of ethylene on a highly active, thermally stable GO-supported V-based catalyst. The resultant PE/GO nanocomposites also displayed a slightly high molecular weight with a narrow distribution, enhanced thermal stability and better mechanical properties over other PE obtained from the VOCl3/EASC catalyst system. Therefore, the GO-supported V-based catalyst developed in this work supplies a simple and inexpensive way to prepare high-performance PE/GO nanocomposites.Acknowledgements
This work was supported by the Natural Science Foundation of China (No. U1462124). Dr H. X. Zhang would like to thank the China Scholarship Council (201504910334) for the financial support on his visit at KNU.References
- A. Dey, O. P. Bajpai, A. K. Sikder, S. Chattopadhyay and M. A. S. Khan, Renewable Sustainable Energy Rev., 2016, 53, 653 CrossRef CAS
; G. Mittal, V. Dhand, K. Y. Rhee, S. J. Park and W. R. Lee, J. Ind. Eng. Chem., 2015, 21, 11 CrossRef
- P. Pereira, L. Fernandes, H. Gaspar and G. Bernardo, Polym. Test., 2015, 45, 124 CrossRef CAS
- N. Song, J. Yang, P. Ding, S. Tang and L. Shi, Composites, Part A, 2015, 73, 232 CrossRef CAS
-
(a) A. Kheradmand, A. Ramazani S. A., F. Khorasheh, M. Baghalha and H. Bahrami, Polym. Adv. Technol., 2015, 26, 315 CrossRef CAS
- J. Q. Wu and Y. S. Li, Coord. Chem. Rev., 2011, 255, 2303 CrossRef CAS
- G. A. Mortimer, J. Appl. Polym. Sci., 1976, 20, 55 CrossRef CAS
- D. R. Dreyer, S. Park, C. W. Bielawski and R. S. Ruoff, Chem. Soc. Rev., 2010, 39, 228 RSC
- W. S. Hummers Jr and R. E. Offeman, J. Am. Chem. Soc., 1958, 80, 1339 CrossRef CAS
- R. C. Paul and A. Kumar, J. Inorg. Nucl. Chem., 1965, 27, 2537 CrossRef CAS
- C. Hu, Y. Liu, Y. Yang, J. Cui, Z. Huang, Y. Wang, L. Yang, H. Wang, Y. Xiao and J. Rong, J. Mater. Chem. B, 2013, 1, 39 RSC
- K. Ghosh, M. Kumar, T. Maruyama and Y. Ando, Carbon, 2009, 47, 1565 CrossRef CAS
- Y. Huang, Y. Qin, N. Wang, Y. Zhou, H. Niu, J. Y. Dong, J. Hu and Y. Wang, Macromol. Chem. Phys., 2012, 213, 720 CrossRef CAS
- F. Wang, F. Wang, G. Gao and W. Chen, Environ. Toxicol. Chem., 2015, 34, 1975 CrossRef CAS PubMed
- M. K. Reinking, P. D. Bauer and J. W. Seyler, Appl. Catal., A, 1999, 189, 23 CrossRef CAS
- P. Song, Z. Cao, Y. Cai, L. Zhao, Z. Fang and S. Fu, Polymer, 2011, 52, 4001 CrossRef CAS
Footnote |
| † Electronic supplementary information (ESI) available. See DOI: 10.1039/c6ra00746e |
| This journal is © The Royal Society of Chemistry 2016 |