Structure–activity relationship and binding mode studies for a series of diketo-acids as HIV integrase inhibitors by 3D-QSAR, molecular docking and molecular dynamics simulations

Dan Han, Min Su, Jianjun Tan*, Chunhua Li, Xiaoyi Zhang and Cunxin Wang
College of Life Science and Bio-engineering, Beijing University of Technology, Beijing 100124, China. E-mail: tanjianjun@bjut.edu.cn; Tel: +86 13651057420

Received 9th January 2016 , Accepted 6th March 2016

First published on 8th March 2016


Abstract

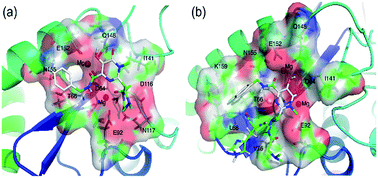
At present, the approved HIV integrase (IN) inhibitors are all diketo-acids (DKAs). To have a better understanding of DKA inhibitors, comparative molecular field analysis (CoMFA), comparative molecular similarity indices analysis (CoMSIA), docking, and molecular dynamics (MD) were performed on 88 DKAs. The constructed CoMFA and CoMSIA models were shown to be statistically significant for the training set with the cross-validated value (q2) of 0.94, non cross-validated value (r2) of 0.96 for CoMFA; q2 of 0.96, r2 of 0.94 for CoMSIA. External q2 of the test set Q2F1, Q2F2 and Q2F3 were 0.79, 0.77 and 0.81 for CoMFA; Q2F1, Q2F2 and Q2F3 were 0.60, 0.56 and 0.63 for CoMSIA. Further interpretation of contour maps provided instructive insights into the optimization and designing of lead compounds. The interaction between IN and two DKAs (the inhibitors with the highest and lowest activity) were investigated using ‘relaxed receptor’ molecular docking and molecular dynamics simulations. Molecular mechanics Poisson–Boltzmann surface area (MM-PBSA) and molecular mechanics Generalized-Born surface area (MM-GBSA) were employed to evaluate the binding affinity and the energy decomposition for residues, respectively. Further analysis indicated that the dominating effect of van der Waals drives the binding of IN and DKA inhibitors and key residues. In addition, we found that the MD conclusion was consistent with QSAR models after the analysis of the interaction between DKAs and each residue. These findings may be of immense importance in the development of DKA inhibitors.


1. Introduction

Acquired immune deficiency syndrome (AIDS), which is caused by human immunodeficiency virus (HIV), has become a hazard to human health in the 21st century as one of the most serious diseases. HIV is a retrovirus that attacks the immune system, including HIV-1 and HIV-2 two subtypes, but the vast majority of AIDS is caused by HIV-1.1,2 The in vivo life cycle of HIV-1 includes multiple steps: receptor binding, fusion, reverse transcription, integration, translation, assembly, budding and maturation.3,4 For different process, there are already 37 anti-HIV drugs approved by the US food and drug administration (FDA).3 At present, the clinical therapy of AIDS is mainly adopted highly active antiretroviral therapy (HAART), which is the combination of several protease and reverse transcriptase inhibitors to reduce the possibility of single point mutation and thus delay the generation of drug resistance, to achieve the therapeutic effect.5

However, long-term medication is a must for patients using HAART. In addition, HARRT is difficult to suppress the viral replication at a low concentration while long-term medication of high concentrations will bring greater side effects and resistance.6,7 Therefore, to accelerate the research of anti HIV-1 drugs, the development of new and low toxic drugs with new mechanisms and targets is imminent.8 Integrase (IN), an essential enzyme for the viral replication, is an ideal target for potential treatment of AIDS as human has no analog in the host cell and IN has less toxic to normal human cells.9,10

IN, which is encoded by pol and has 288 amino acid residues, is divided into three domains: n-terminal domain (NTD), catalytic core domain (CCD), and c-terminal domain (CTD). 49 amino acid residues in the initial terminal constitute NTD, where His16, Cys40, Cys43 and Zn2+ are combined to construct an HHCC zinc finger motif.11 NTD can identify the terminal of virus DNA specifically and promote four INs into a tetramer. CCD, composed of the 50th to 212th amino acid residues, is the main part of IN that participate in the catalytic reaction and also known as a catalytic domain. CCD contains a highly conserved DDE motif that consisting three acidic residues (i.e. Asp64, Asp116 and Glu152) and the active site is formed by the motif and a divalent metal ion (Mn2+or Mg2 +).12 CTD,13 consisting of the 213th to 288th amino acid residues, is mainly involved in the combination of non-specific DNA and is conducive to the multimerization of IN.

IN is responsible for catalyzing the integration of viral DNA with the host chromosome DNA.14 More specifically, IN catalyzes two interactions: the 3′-processing step (3′-P) in the cytoplasm and the strand transfer in the cell nucleus.15 IN is requisite for the generation of future virions as it produced the proviral gene.6

At present, there are only three inhibitors, raltegravir (RAL), elvitegravir (EVG) and dolutegravir (DTG), targeting IN approved by the US-FDA:3 RAL was approved by FDA in October 2007 as the first listed IN inhibitors. RAL showed good inhibitory activity with the EC95 of 31 nM. However, since the registering, there had been many resistant mutations, such as Q148H/R/K, N155H, E92Q, Y143R/C, and so on.16 EVG, developed by Japan Tobacco Company with the in vivo inhibitory of 5 nM, was approved by FDA in August 2012.17 Nevertheless, there were also several resistant mutations against EVG. DTG, approved by FDA in August 2013, has a strong resistance for the mutations against RAL and became the second generation of strand transfer integrase.18 Except for its better in vivo (IC50 = 7 nM) and cell (EC50 = 1.7 nM) inhibitory activity, no significant resistant mutants appeared. Compared to the previous integrases, DTG exhibits a taller barrier to gene mutations and has a higher half-life of dissociation.19

Until now, the approved three drugs targeted IN are diketo-acids (DKAs), which are potent and selective IN inhibitors, but the interaction mechanism between DKA inhibitors and IN is still not understood. Meanwhile, drug resistance conferred by mutations in the HIV-1 genome has emerged in a large number of patients. And the efficacy of anti-AIDS drugs is greatly compromised by drug resistance and toxicity. There is in urgent need to develop anti-HIV drugs with considerable toxicity tolerability and an acceptable mutation profile.

Three-dimensional quantitative structure–activity relationship (3D-QSAR) is an important method which established a correlation between biological activity and chemical structure;20 comparative molecular field analysis (CoMFA) and comparative molecular similarity induces analysis (CoMSIA) are two effective methods in drug discovery. CoMFA analysis is performed by correlating the calculated electrostatic (coulombic) and steric (Lennard-Jones) fields of the molecules with the corresponding experimental activities. CoMSIA is an extension of CoMFA, which used more descriptors (steric, electrostatic, hydrophobic, H-bond donor, and H-bond acceptor fields) to establish the correlation with activities. These two methodologies are all evaluated by a partial least squares (PLS) analysis. The obtained CoMFA and CoMSIA contour maps are used as visual guides for the future designing of new and potent compounds.21 In addition, if the binding mechanism is fully mastered, it would give a hand to drug discovery. Nowadays, the combination of docking and molecular dynamics (MD) have been successfully employed in rational drug design to improve initial docking results and to get an understanding of inhibition mechanisms.22–28

Many studies had carried out on HIV IN over the past few years. Dayam et al. employed docking technique to study the active site binding modes of β-DKA inhibitors.29,30 Makhija et al. performed a CoMFA model for different classes of IN inhibitors through a new alignment technique based on molecular electrostatic potentials (MEPs) to study the design and synthesis of IN inhibitors.30,31 Costi et al. carried out CoMFA on 2, 6-bis(3,4,5-trihydroxyben-zylydene) derivatives of cyclohexanone like a kind of novel IN inhibitors to develop a model that could predict their inhibitory activities and design novel potent IN inhibitors.30,32 Ma et al. performed CoMFA and docking for the aim of comprehending pharmacophore properties of styrylquinoline derivatives and designing new inhibitors targeted HIV IN.30,33 Nunthaboot et al. applied CoMFA and CoMSIA to a set of 89 HIV-1 IN inhibitors to get a better understanding of the structural requirements of HIV-1 IN inhibitors and some helpful information for the designing of new IN inhibitors.34 Huang et al. performed 10 ns comparative molecular dynamics simulations on HIV-1 IN bound with three most representative DKA inhibitors: S-1360 and two Merck inhibitors L-731[thin space (1/6-em)]988 and L-708[thin space (1/6-em)]906 to study the inhibition mechanism of DKAs.23

In the present work, several molecular modeling approaches were used to investigate the relationship of molecular properties with biological activity and the interaction of IN, including CoMFA, CoMSIA, docking, and MD. As a result, we got some useful information for the structure reformation of IN inhibitor and had a better understanding of the mechanism between DKA inhibitors and IN.

2. Materials and methods

2.1 3D-QSAR study

2.1.1 Data set. A set of 88 DKAs with their corresponding activity data reported from the laboratory of Merck were collected to perform this study35–37 (specific information were in ESI). Considering the structural diversity and wide range of activities in the data set, we divided the compounds into two classes manually: a training set of 70 compounds and a test set of 18 compounds (Fig. 1). IC50 values were converted into pIC50 according to formula (1):
 
pIC50 = −log(IC50) (1)

image file: c6ra00713a-f1.tif
Fig. 1 Distribution of the inhibiting activities for the training set and test set compounds.
2.1.2 Molecular structure and alignment. The three-dimensional structures of these 88 compounds were obtained using SYBYL-X 2.0. Partial atomic charges calculated using the Gasteiger–Hückel method were assigned to each atom and the minimize cycle limit was set to 2000 steps. Energy minimization was carried out in the Tripos force field using Powell Gradient Algorithm until an energy convergence criterion of 0.005 kcal (mol−1 Å−1) was achieved.

The alignment mode is of great significance to the reliability of the models; it also influences the prediction ability of the model. To get the conformation with the minimum root-mean-square deviation (RMSD), we executed the alignment based on the common framework. Presently, compound 54, which has the highest activity, was used as the template of alignment (Fig. 2 and 3).


image file: c6ra00713a-f2.tif
Fig. 2 Structure on template compound, * for common substructure.

image file: c6ra00713a-f3.tif
Fig. 3 Alignment of training set based on template compound.
2.1.3 Calculation of CoMFA and CoMSIA models. CoMFA and CoMSIA were performed using the QSAR module in SYBYL-X 2.0. CoMFA is a popular QSAR technique that could construct a relationship between structure and chemical or biological properties.38 CoMFA models were performed on the training set of 70 DKA compounds, in which Lennard-Jones and Coulomb potentials were employed to calculate the steric and electrostatic fields,39 respectively. These two descriptors were calculated with the SYBYL parameters: 0.2 Å grid points spacing, a sp3-carbon atom as the probe atom having a +1.0 unit charge and the default 30 kcal mol−1 energy cutoff. CoMFA uses the partial least squares (PLS) to do the analysis46–48 and the leave-one-out (LOO) cross-validation procedure to determine the optimum number of components (ONC) for the final non-cross-validation model. To minimize the overfitting, we chose a smaller ONC to establish models under the condition of a high q2. According to the ONC derived from the cross-validation, we got the regression model after performing the non-cross-validation procedure. Then, various statistical parameters were taken into consideration to estimate the predictive capability of the final model, such as q2 (eqn (2)), non cross-validated value (r2) and standard error of estimate (SEE). q2 is calculated using the following equation:
 
image file: c6ra00713a-t1.tif(2)
where Ypred and Yexp are the predicted and experimental activity of training set, respectively. Ȳ is the mean experimental activity of training set.

CoMSIA methodology built models in terms of a more comprehensive point, in which steric, electrostatic, hydrophobic, H-bond donor, and H-bond acceptor fields were considered. Moreover, gaussian type distance dependence was used compared to CoMFA.40 CoMSIA models were constructed through changing the combination of these five fields. These five fields were calculated like CoMFA. The PLS regression analysis was almost the same with the CoMFA methodology.

2.1.4 Validation of the models. After the development of QSAR models, PLS was carried to validate the constructed models using LOO. The generated q2 and r2 were used to do the internal validation while the calculated Q2F1 (eqn (3)), Q2F2 (eqn (4)) and Q2F3 (eqn (5)) were utilized to do the external evaluation.41–43 Q2F1 was first raised by Shi et al.44 whereas Q2F2 was first discussed in the paper of Hawkins.41 Both the two functions were compared by Schüürmann45 et al. The only difference between the two equations lay on the mean used in the denominator for the calculation of the sum of squares. Q2F1 and Q2F2 are determined as eqn (3) and (4).
 
image file: c6ra00713a-t2.tif(3)
 
image file: c6ra00713a-t3.tif(4)
where ŷi and yi represent the predicted and experimental activity of training set, respectively. Ȳ and ȳi are the mean experimental activity of training and test set.

Consonni41,42 proposed Q2F3 as an external validation parameter in 2009. In the function, we can get that the summation in the numerator runs over the external test set while that in the denominator over the training set; numbers of the training set and external objects are usually different in most cases. ntra and next indicate the total number of training and test sets objects in the following equation.

 
image file: c6ra00713a-t4.tif(5)

2.2 Molecular dynamics simulation and docking

2.2.1 Preparation. In our studies, the X-ray crystal structure of IN with high resolution (1.9 Å) was retrieved from RCSB Protein Data Bank (PDB entry code: 4AHU). This PDB file has two core parts: chain A and chain B, respectively. The missing residues in the loop region (chain A: residues 190 and 191, chain B: residues 189 to 191) were reconstructed by using SYBYL-X 2.0 software package. Energy minimization (EM) of the final IN structure was performed using the steepest descent and conjugate gradient algorithms with 2000 steps. The final IN structure was taken as the starting structure for the MD simulation. We chose the binding site that was on chain A in the molecular docking process, if not otherwise stated, all the analysis for IN were revolved around chain A.
2.2.2 Molecular dynamics simulation. The force field parameters of compound 53 and 54 were developed under the general amber force field (GAFF) using the Antechamber program implemented in Amber12.46,47 The force field parameters of the IN complex were described by the ff12SB force field in the Amber12, which was suitable for the biological organic system. The molecular structure of the system was treated with the leap program surrounded by TIP3P water and set the distance between the IN and the edges of the box greater than 10 Å. Finally, we added counter-ions to maintain the system's electrical neutrality.

All molecular dynamics simulations were performed with NAMD2.9 program.48 The solvent system was treated for 40 ps of energy optimization in three steps: firstly, all the atoms of IN and inhibitors were fixed by applying 10 kcal (mol−1 Å−2) harmonic potential and optimized the solvent and ion; secondly, the framework atoms of IN were fixed by adopting 2.0 kcal (mol−1 Å−2) harmonic potential and optimized the rest of atoms; finally, we optimized the whole system without any constraints. In order to avoid the influence of rapid heating, we applied the Langevin thermostat to perform the slow heating process from 0 K to 310 K in 400 ps for the optimized system. During the heating process, the Cα atoms and Mg2+ ions of IN were applied a weak constraint of 2 kcal (mol−1 Å2). In the end, a 100 ns MD simulation with a time step of 2 fs at 300 K and 1 atm of the IN_53 and IN_54 complex were performed without constraints, respectively. We adopted the SHAKE algorithm to enforce the vibration of the covalent bond, which is connected with a hydrogen during the MD simulation.

2.2.3 Molecular docking. To understand the detailed ligand–receptor interactions, molecule docking was carried out by using AutoDock 4.2 software package. Considering the changing conformation of the receptor, especially for the residues in the binding site, we applied the “multi-conformation docking”. Firstly, a 10 ns MD simulation was performed for the complex; we extracted 12 conformations from the trajectory and performed docking with compound 53 and 54, respectively.

The grid maps of 60 × 60 × 60 grid points with a grid spacing of 0.375 Å, centered on the active site of chain A, were used to cover the binding pockets. AutoDock automatically computed Gasteiger charges and determined rotatable bonds. All rotatable bonds were set to be flexible. Since the ligand has so many flexible bonds, the maximum amount of the energy of evaluation was also bigger, so, we set it 2.5 × 10⁷, other parameters were taken as default. Then, AutoDock 4.2 (ref. 49) was performed using Lamarckian genetic algorithm to launch the docking step. In each run, a population of 100 complexes was generated. Cluster analysis was performed on the docked results. Finally, we considered both the results of ranking, cluster analysis, and experimental information, to select the most reasonable pose as the initial structure of MD simulation.

2.2.4 Binding free energy calculations and energy decompositions. Molecular mechanics Poisson–Boltzmann surface area (MM-PBSA) is a potent method to calculate the binding free energies of a protein–ligand complex, and it has been successfully applied to compute the binding free energy of numerous protein–ligand interactions.50 In our study, 800 poses were selected from the final 80 ns of the equilibrium stage in the MD simulation with the interval of 100 ps to calculate binding free energy by the mm_pbsa.py program in the Amber12 package.

The binding free energy of the IN to an inhibitor in solution can be estimated by eqn (6).51

 
ΔGbind = Gcomplex − (GIN + Ginhibitor) (6)

According to the MM-PBSA methodology, ΔGbind is estimated as eqn (7), where ΔGsolv denotes the solvation term, ΔEMM is the molecular mechanics contribution in vacuo consisting of the sum of internal, electrostatics, and van der Waals energies.51

 
ΔGbind = ΔEMM + ΔGsolvTΔS (7)

ΔEMM is given by eqn (8), ΔEint represents the bond, angle, and torsional angle energies, ΔEele and ΔEvdw indicate the intramolecular electrostatic energies and van der Waals interactions, respectively.50

 
ΔEMM = ΔEint + ΔEele + ΔEvdw (8)

The solvation term ΔGsolv (eqn (9) or (10)) is expressed as the sum of polar ΔGPBGGB) and nonpolar ΔGNP contributions. The solvation term ΔGsolv is expressed as the sum of polar and nonpolar contributions. The polar part can be calculated either with the finite-difference solution to the Poisson–Boltzmann (PB) equation for MM-PBSA or the generalized born (GB) equation52,53 for Molecular mechanics Generalized-Born surface area (MM-GBSA), ΔGNP has some connection with the solvent accessible surface area (SASA), and it is determined by eqn (11), where γ = 0.007 kJ (mol−1 Å−2) and β = 0.000 kJ mol−1.

 
ΔGsolv(PBSA) = ΔGPB + ΔGNP (9)
 
ΔGsolv(GBSA) = ΔGGB + ΔGNP (10)
 
ΔGNP = γSASA+ β (11)

MM-GBSA is a method widely used in the calculation and decomposition of binding free energies. In the further study, it was used to do the energy decomposition to find the key residues in the binding process. The binding free energy was further divided into non-polar (ΔEvdw + ΔGNP) and electrostatic interaction energy (ΔEele + ΔGGB), wherein the polar contributions were calculated with the GB equation, and non-polar part to solvation were determined with the eqn (11). The interaction between inhibitor and each residue was computed using the MM-GBSA decomposition process in Amber12.

4. Results and discussion

4.1 CoMFA and CoMSIA

4.1.1 Statistical results of CoMFA and CoMSIA. The final CoMFA model gave a satisfactory predictive result containing the q2 = 0.94, r2 = 0.98 with 5 components and the SEE of 0.11, which can obviously show that the model has a good predictive ability (Table 1). To validate the external predictive ability of the models, pIC50 values of test set was predicted using the developed model. The Q2F1, Q2F2 and Q2F3 for CoMFA models were 0.79, 0.77 and 0.81, respectively; the three parameters were all larger than 0.60,54 which effectively illustrated the external predictive ability of the model was robust. Table 2 lists the experimental and predicted pIC50 values of the training and test sets from the CoMFA model. The pIC50 values of all compounds were mostly close to the diagonal; only a few had a slightly larger deviation (Fig. 4), which indicated that the CoMFA model had a high prognosticative ability. The model has a higher predicted value for the compound with low activity, which may be attributed to the small amount of low pIC50 inhibitors in the training set. These results suggested that the CoMFA model had a good fitting and predictive ability while considering the contribution of the steric and electrostatic field, the distributions of these two effects were all contribute to the compound activity, of which the former was stronger.
Table 1 Statistical results of CoMFA and CoMSIA
  CoMFA CoMSIA
q2 0.94 0.96
ONC 5 6
r2 0.98 0.94
SEE 0.11 0.13
F 283.59 169.13
Q2F1 0.79 0.60
Q2F2 0.77 0.56
Q2F3 0.81 0.63
Steric 36.20
Electrostatic 63.80
Hydrophobic 29.60
Hydrogen bond donor 29.20
Hydrogen bond acceptor 41.30


Table 2 Experimental and corresponding predictive data of pIC50 for training set and test set of CoMFA and CoMSIA
Compound no. Experimental values CoMFA CoMSIA
1 7.70 7.61 7.81
2 7.18 7.14 7.31
3 6.76 6.66 6.84
4 7.21 7.28 7.31
5 7.21 7.19 7.18
6 7.72 7.73 7.74
7 6.85 6.88 7.10
8 7.68 7.71 7.54
9 7.07 7.05 7.11
10 7.55 7.69 7.57
11 7.10 7.02 6.94
12 6.92 7.00 6.86
13 7.05 7.08 7.05
14 7.16 7.23 7.09
15 7.67 7.54 7.83
16 7.40 7.36 7.41
17 6.89 7.03 6.97
18 7.67 7.56 7.29
19 7.67 7.70 7.65
20 7.30 7.22 7.39
21 6.26 6.41 6.38
22 7.00 6.84 7.03
23 7.52 7.62 7.59
24 7.00 6.97 7.04
25 7.22 7.25 7.12
26 8.40 8.36 8.31
27 7.70 7.50 7.79
28 7.82 7.70 7.74
29 6.36 6.30 6.16
30 6.75 6.90 6.73
31 6.70 6.75 6.69
32 6.89 7.01 6.77
33 7.52 7.45 7.58
34 7.22 6.98 7.11
35 7.70 7.72 7.56
36 7.52 7.56 7.37
37 7.82 7.62 7.52
38 7.36 7.50 7.44
39 7.22 7.20 7.34
40 7.16 7.07 7.29
41 6.85 6.75 6.91
42 6.70 6.85 6.79
43 6.60 6.56 6.54
44 6.89 6.87 7.10
45 7.39 7.36 7.37
46 7.50 7.48 7.45
47 5.40 5.44 5.63
48 8.40 8.33 8.25
49 7.28 7.10 7.32
50 8.16 8.21 8.33
51 7.30 7.36 7.46
52 7.48 7.39 7.54
53 7.68 7.75 7.74
54 7.21 7.27 7.24
55 6.77 6.93 6.71
56 6.73 6.85 6.66
57 7.62 7.61 7.52
58 7.30 7.33 7.34
59 7.68 7.76 7.57
60 7.30 7.13 7.31
61 7.68 7.68 7.57
62 7.75 7.81 7.74
63 7.59 7.59 7.72
64 7.72 7.81 7.72
65 7.60 7.85 7.52
66 7.68 7.80 7.70
67 7.66 7.51 7.80
68 6.89 6.98 6.71
69 7.16 7.15 7.12
70 8.05 8.07 8.04
71 7.70 7.70 7.32
72 6.60 7.02 7.04
73 6.66 6.97 6.94
74 7.85 8.03 8.08
75 8.22 8.04 7.85
76 7.00 7.01 7.24
77 7.00 7.24 7.15
78 7.30 7.09 7.31
79 7.92 7.85 7.34
80 7.52 7.19 7.45
81 6.73 6.91 7.06
82 7.64 7.27 7.27
83 7.44 7.50 7.14
84 7.75 7.49 7.90
85 7.68 7.70 7.67
86 7.68 7.76 7.75
87 7.44 7.28 7.31
88 7.75 7.65 7.32


image file: c6ra00713a-f4.tif
Fig. 4 Plots of experimental versus predicted activities for training set and test set based on CoMFA model. The solid line signifies unity and the dashed lines signify 3-fold SEE between experimental and predicted values.

CoMSIA considers more factors in model constructing processes, such as hydrophobicity, hydrogen bond donor, and acceptor. Statistical results from the CoMSIA model showed believable predictability based on the cross-validated value (q2 = 0.96), and the non cross-validated value (r2 = 0.94). The ONC = 6 and the standard error of estimate was 0.13. External validations further proved the predictive potential of the model with the Q2F1, Q2F2 and Q2F3 values of 0.60, 0.56 and 0.63, which suggested that the model could predict external data. Among the three external validation parameters, only Q2F2 had a value lower than 0.60, which may be caused by the similar response values of test sets. Fig. 5 shows the correlation between experimental and predicted values, and pIC50 values distributed evenly near the line X = Y. Statistical results suggested that the CoMSIA model was also effective. While taking into account more factors, variable factors are also correspondingly increased in the constructing process, thus, the reliability of the model will be relatively decreased. Thus, the CoMSIA is still reliable.


image file: c6ra00713a-f5.tif
Fig. 5 Plots of experimental versus predicted activities for training set and test set based on CoMSIA model. The solid line signifies unity and the dashed lines signify 3-fold SEE between experimental and predicted values.
4.1.2 CoMFA contour maps. As compound 54 has the highest inhibitory activity, we analyzed the steric and electrostatics contour maps of compound 54 (Fig. 6). In the steric field, green contours represent bulky substituents (such as benzyl) would be favorable while yellow contours suggest substitutions of big groups would not be tolerated.39 There was a green contour region over the right side (Fig. 6a), the analysis results were consistent with the fact that compound 31 (R2 = image file: c6ra00713a-u1.tif, pIC50 = 6.70), 32 (R2 = image file: c6ra00713a-u2.tif, pIC50 = 6.89) and 33 (R2 = image file: c6ra00713a-u3.tif, pIC50 = 7.52). We can get the conclusion that compound 31 and 32 would get a higher activity if they increase their steric hindrance at the green contour. The same conclusion can also be gotten from compound 46 and 54.
image file: c6ra00713a-f6.tif
Fig. 6 Contour map of CoMFA model generated by alignment of compound (a) steric contour plots (b) electrostatic contours plots.

Fig. 6b describes the distribution of the electrostatic field, positive-charge favored areas in blue, negative-charge favored areas in red. The red contour region over the right side suggested that negative-charge substitution could improve the activity.34 This might be the reason that why the pIC50 of compound 54 (R2 = image file: c6ra00713a-u4.tif, pIC50 = 8.40) is higher than compound 44 (R2 = image file: c6ra00713a-u5.tif, pIC50 = 6.89). Meanwhile, compound 45 (R2 = image file: c6ra00713a-u6.tif, pIC50 = 7.39) with an electron-withdrawing but small group was smaller than compound 54, and the lower pIC50 agrees with both the steric and electrostatic fields.

Compared to compound 54, the CoMFA maps indicated that bulky and negative-charge substitutions were favored at the right side, nevertheless, compound 53 was a small and positive-charge group there. This might be part of the reason for the lower activity of compound 53.

4.1.3 CoMSIA contour maps. Fig. 7 shows the hydrophobic and H-bond donor contour maps of compound 54 from CoMSIA model. The steric and electrostatic contour maps of CoMSIA were similar to CoMFA, hence, they were not discussed. In the hydrophobic contour maps, the red contour region suggests that hydrophilic groups are favored here for its activity while the yellow block indicates that the hydrophobic group is favorable.55 A large yellow contour was covered R3 group (Table 1), which indicating that a hydrophilic group was favored at this place (Fig. 7a). Compared compound 4 (R3 = 3-Cl, pIC50 = 7.21), compound 5 (R3 = 3-Br, pIC50 = 7.72) and compound 6 (R3 = 3-OMe, pIC50 = 6.85), we could find that the compound has a hydrophilic stronger group is with a higher activity, which is in agreement with the hydrophobic contour maps of CoMSIA. Compound 8 (R3 = 4-F, R4 = 3-Me, pIC50 = 7.07) has a more hydrophobic group in the yellow contour region (R4) compared with Compound 7 (R3 = 4-F, R4 = 3-F, pIC50 = 7.68), thus the activity of compound 8 is lower.
image file: c6ra00713a-f7.tif
Fig. 7 Contour map of CoMSIA model generated by alignment of compound (a) hydrophobic contour plots (b) H-bond donor contour plots.

In the H-bond donor field, the presence of the H-bond donor group would lead to enhance the inhibitory activity in purple regions, while the presence of the H-bond donor group would lead to decrease the inhibitory activity in red regions.38 H-bond donor group favorable purple contour near the right side suggesting the H-bond donor group increases the activity in this place (Fig. 7b). This could be justified by comparing compound 33 (R2 = image file: c6ra00713a-u7.tif, pIC50 = 7.52) and compound 34 (R2 = image file: c6ra00713a-u8.tif, pIC50 = 7.22), the former has more H-bond donors, and thus it has a higher IC50.

For compound 53, there was an Ac group (H-acceptor substitution) at the place where H-donor substitutions were welcomed. Moreover, compound 53 had a small and positive-charge group in the place where bulky and negative-charge substitution was welcomed in the CoMFA contour. Thus, the CoMSIA and CoMFA contour maps together might explain the lower activity of compound 53 in some ways.

4.2 Molecular dynamics simulation and docking

4.2.1 RMSD and RMSF analyses. The inhibitors with the lowest and highest inhibitory activity were carried out molecular docking with IN, respectively. After that, we got two complexes IN_53 and IN_54. To check the stability of the docked structures, the two complexes were performed 100 ns simulations; the root mean square deviation (RMSD) and the root mean square fluctuation (RMSF) were analyzed in order to speculate the conformational variations and stability of protein structure with inhibitor during entire simulation.

RMSD of the backbone against the initial complex conformations was calculated to determine the stability of the two systems. After 5 ns, the RMSD of IN_54 tended to be stable (at about 0.5 Å), indicated the stabilization of the complex, whereas the convergence rate of IN_53 was relatively slow. In addition, the fluctuation of RMSD was higher and the RMSD was still increasing at the end of 100 ns for the IN_53 system (Fig. 8a and b). The average RMSDs of protein (backbone atoms) and inhibitors (non-hydrogen atoms) were 1.9 Å and 1.3 Å, respectively. The high RMSD indicated the volatility of the system, which could also be seen from the RMSD of active site residues (Fig. 8c). IN_53 was more unstable than IN_54 while the lower RMSD of IN_53 in Fig. 8c additionally suggested that these residues might interact with other atoms in the binding process. Although the average RMSD of compound 53 was lower, but the greater fluctuating indicated the instability of the system.


image file: c6ra00713a-f8.tif
Fig. 8 Comparative analyses of the MD trajectories of the two complex systems: IN_53 and IN_54 (a) RMSD of backbone atoms of IN (b) RMSD of the non-hydrogen atoms of ligand (c) RMSD of atoms around active sites (d) RMSF of backbone atoms for IN_53 and IN_54.

The RMSF of amino acid residues is an important physical property for measuring the protein flexibility. The two simulation systems showed a similar distribution and dynamic trend (Fig. 8d). Higher RMSF values were found in the 70, 82, 110 and 190 residues, corresponding to the loop region and the corner of the β sheet of the IN structure. In addition, RMSF IN_53 and IN_54 systems differ greatly in the functional loop area (residue 132 to 140). We hypothesized that the combination of the inhibitor 54 with IN at the active sites may limit the flexibility of the functional loop region, thereby interfering with the 3′-end processing and the subsequent transfer reactions. The low fluctuation of the DDE motif (Asp 64, Asp 116 and Glu 152) suggested that these two systems had a greater rigidity at the active site, which further indicated that these amino acids were important for the binding effect. Generally speaking, the fluctuation of IN_54 is obviously less than that of the IN_53 system.

4.2.2 Binding free energy calculations and energy decompositions. We calculated the binding free energy the snapshots collected from equilibrated trajectories of the two simulation systems using MM-PBSA and the results were listed in Table 3. Calculated binding free energy values are significantly lower than the experimental (ΔGbind,exp = RT[thin space (1/6-em)]ln[thin space (1/6-em)]IC50), but they are still in good correlation with each other, it can be properly used for ranking the binding free energy. Besides, another advantage of the MM-GBSA method is that it can decompose the total binding free energy into each energy term, which is convenient for us to understand the interaction mode. For the two systems, the main differences lay in ΔEvdw and ΔEele. For IN_53, the electrostatic interaction was the main driving force for the combination of IN and compound 53; while van der Waals contributed mostly for IN_54. ΔEvdw and ΔGNP were negative since they were beneficial for the combination of IN with an inhibitor. The ΔEele between the IN and inhibitor as a helpful contribution for the binding free energy was offset by the unfavorable ΔGGB. Thus, the total electrostatic interaction (ΔEele + ΔGGB) was positive, which was not conducive to the binding free energy. The ΔEvdw in the complex IN_54 was almost three times of that in the IN_53 system, and this might be part of the reason for the decreasing of the binding affinity of the compound 53 in the binding process.
Table 3 Binding free energy calculations for IN_53 and IN_54 systems
  ΔEele ΔEvdw ΔGPB ΔGNP ΔEMM ΔGsolv ΔGbind ΔGbind,exp
IN_53 −16.31 −9.47 16.67 −2.28 −25.78 14.39 −11.39 −7.65
IN_54 −12.57 −31.26 18.06 −3.66 −43.83 14.40 −29.43 −11.91


4.2.3 Identification of critical residues. To further identify the critical residues in the binding process, the binding free energy was decomposed into each residue (Fig. 9). Fig. 9a shows the difference of binding free energy on every residue between IN_54 and IN_53 (ΔGIN_54 − ΔGIN_53); a negative value represents favorable for binding while positive is unfavorable. As can be seen from Fig. 9a, for the energy that resulting the increase of inhibitory activity, the advantageous contributions were mainly from residues T66, L68, I73, V75, E152, N155, K159 and I162, and the unhelpful contributions were from residues D64, E92 and D116. The binding free energy was further divided into non-polar (ΔEvdw + ΔGNP) and electrostatic interaction terms (ΔEele + ΔGGB), and these two kinds of energies on critical residues in IN_53 and IN_54 systems were analyzed (Fig. 9b and c). The energy of residues T66, L68, E152, N155 and K159 were all negative and their absolute values were significantly greater than IN_53 system (Fig. 9b). These residues were all near the pocket and had a stronger interaction with inhibitor 54, which was conducive to the formation of a stable complex system, namely, the increasing of the inhibitory activity. For the electrostatic interaction energy, the energies of residues D64, E92 and D116 were all negative and their absolute values were higher than that in complex IN_54 (Fig. 9c). However, the difference between the two was so small that it could not widen the difference of binding free energy. N155 was the residue that had the biggest difference in the two complexes on the aspect of energy contribution. For the IN_53 and IN_54 systems, the total energy contribution was −2.19 kcal mol−1 and −0.04 kcal mol−1, and the non-polar interaction energy was −3.38 kcal mol−1 and −0.22 kcal mol−1, and the electrostatic interaction energy was 0.18 kcal mol−1 and 1.19 kcal mol−1, respectively.
image file: c6ra00713a-f9.tif
Fig. 9 Binding free energy decomposition (a) total energy difference between IN_54 and IN_53 (b) VDW and nonpolar solvation energy (ΔEvdw + ΔGNP) and (c) electrostatic and polar solvation energy (ΔEele + ΔGGB).
4.2.4 Analysis of the binding mode. Two IN structures were collected from two systems in the stable stage, respectively. Then, they were performed alignment with the initial structure (Fig. 10). The helix 1, sheet 1 and loop 2 regions could be folded together, but the loop 1 region could not be well folded. Loop1 region referred to the 132nd to 148th amino acid residues, although it was far from the binding site, but the flexible loop 1 region was closely related to the activity of IN. For loop 1 region, the fluctuation of IN_38 was significantly smaller than that of the IN_53, which probably be caused by the stable conformation. In addition, the sheet 1 region in the IN_53 system was not steady, but the critical residues related to the inhibition (D64, T66, L68, I73 and V75) were located in this area. Compound 53 were relatively far away from these residues, from Fig. 10a and b, we can also clearly see that there is little interaction between them, for which may cause the unstable of β sheet.
image file: c6ra00713a-f10.tif
Fig. 10 The structures of the average IN superimposed with origin IN in the simulation (a) the IN_53 system (b) the IN_54 system.

For IN_53 and IN_54, two differences lie in the substitutions with the nitrogen in the ortho-position and meta-position. The calculated binding free energy by MM-PBSA was −29.43 kcal mol−1 for IN_54, which was significantly lower than that of IN_53 (−11.39 kcal mol−1) and consistent with the experimental activities. Through the observation of the trajectory in the dynamic simulation, the structure of compound 53 was found to be more erratic, while the compound 54 tended to be stable. This might be related with the binding ability of the compound with the IN.

To get further information about the difference of the binding mode between IN_53 and IN_54, we analyzed the typical structure in the stable stage. The binding modes between IN_53 and IN_54 were alike; the structure of ketenes and D64 oxygen were all fairly close to Mg2+. In addition, they all had a distance (smaller than 4 Å) with several amino acid residues, like D64, T66, E92, Q148, E152 and N155. Thus, we suspected that there was some interaction between them. Totally, compound 54 occupied the groove of the active pocket, and its binding site was lower. In addition, the pyrimidine and piperazine were closer to sheet 1(Fig. 11). The acetyl group of piperazine was located near E92, which is an acidic amino acid and a key target residue in the future of drug design. However, the energy contributions of E92 almost come from non-polar interaction (−0.33 kcal mol−1), a kind of relatively weak interaction. Consequently, we got the conclusion that the more positive-charge substitutions here, the steadier the complex would be. The conclusion was consistent with the electrostatic contour map. The dimethylamino and ortho-methyl were near V75 and L68, respectively. Compared with compound 53, the steric hindrance was meaningfully increased, and the non-polar interaction energy of L68 and V75 was also significantly increased, −1.58 kcal mol−1 and −0.42 kcal mol−1, correspondingly. The hydrophobic interaction between compound 54 and these groups were apparently increased, which might be the reason that why compound 54 has a higher inhibitory activity. Meanwhile, we suggested that these interactions also explained the stableness of sheet1. The fluorobenzene group of compound 54 near N155 and K159 covered the binding site of IN and DNA. Therefore, compound 54 can form strong interactions with these residues. For N155, the non-polar interaction (−2.28 kcal mol−1) of the side chain contributed mainly to its binding free energy (−2.19 kcal mol−1). Hence, we can draw a conclusion that the activity would be higher when hydrophobic or negative groups increased here. Similarly, the conclusion was in agreement with the hydrophobic and electrostatic contour maps. Although compound 53 had a short distance with D64, E92, D116, N117, Q148 and E152 and there were some interactions, but compound 53 didn't occupy the groove of the active pocket. As a result, it cannot interfere with the binding of IN and DNA and leading to a decrease in activity. We found that the polar interaction is the major force that prevent the binding process (Table 3). In addition, only one red contour indicating hydrophilic groups are favored was near the piperazine ring (Fig. 7a). For compound 54, its piperazine ring was toward outside (Fig. 11), and the group was hydrophilic favored. Meanwhile, the fluorine benzene and pyrimidine ring were covered with yellow blocks which means hydrophobic groups are favorable and these groups were embedded in the IN binding pocket (Fig. 11), which can eliminate the contact surface of compound 54 with water. Thus compound 54 can form stronger interaction with the binding pocket. However, for compound 53, its piperazine ring was also toward outside, but the fluorine benzene and pyrimidine ring were not located in the IN binding pocket, so, its binding ability with IN is lower than compound 54.


image file: c6ra00713a-f11.tif
Fig. 11 The binding mode of DKAs and IN. (a) The IN_53 system (b) the IN_54 system. The contact residues here refer to the residues that are within 4 Å with the compound.

5. Conclusion

DKAs inhibitor has become the most promising anti-HIV drug for its good inhibitory activity and less toxicity. In this study, we focused on this kind of inhibitors to find some practical information for the future anti-HIV drug design through QSAR, molecular docking and MD. We chose 88 DKAs that with the same mechanism and framework as our dataset. Considering the IC50 and structure differences, we divided the data set into a training set and test set randomly and build CoMFA and CoMSIA models with the training set. The constructed models all had good predictive ability with the non cross-validated values of 0.96 and 0.94, respectively. In addition, the external predictive correlation coefficients effectively proved the predictive ability of the models were excellent. Statistical results showed these two models occupied preferable prediction performance. Furthermore, the analysis of contour maps suggested that positive-charge substitutions would be favorable to fluorinated benzene for its activity as well as hydrophilic groups at pyrimidine. The constructed relationship of activity and structure could provide theoretical guidance for the modification and optimization of DKAs inhibitors.

We carried out multi-conformation docking, ranking and cluster analysis on the inhibitors with the highest and lowest activity and selected the most rational structure, IN_53 and IN_54. A 100 ns molecular dynamic was performed for IN_53 and IN_54; binding-free energy was calculated by MM-PBSA and decomposed into every residue by MM-GBSA. The inhibitory activity can be sorted in a good order by the calculated energy for which had a good correlation with the experimental values. We found that van der Waals was the driving force for the combination of IN with inhibitors through the decomposition of binding free energy. By the decomposition of binding free energy in residues, we got the conclusion that the van der Waals interaction with N155, K159 and hydrophobic pockets was the main reason for the difference between compound 53 and 54. Conclusions through further analysis of the binding mode of compound 53 and individual groups, residues were consistent with the results obtained from QSAR models. Meanwhile, there were also some limitations in our works. For one thing, we didn't have any experimental works to support our conclusions, we got much information for integrase inhibitors that belong to the class of DKAs designing, if we could synthesize inhibitors that according to our conclusions and carry out relative experiments to confirm the accuracy of our conclusions, our work would be more complete; for another, we don't consider the application domain of our QSAR models. If we have analyzed the application domain, an effective range would be determined. All in all, our work would provide some useful information for further designing IN inhibitors.

Acknowledgements

The authors thank Chinese Natural Science Foundation project (No. 21173014 and 11474013).

References

  1. T. Hatziioannou, G. Q. Del Prete, B. F. Keele, J. D. Estes, M. W. McNatt, J. Bitzegeio, A. Raymond, A. Rodriguez, F. Schmidt, C. Mac Trubey, J. Smedley, M. Piatak Jr., V. N. KewalRamani, J. D. Lifson and P. D. Bieniasz, Science, 2014, 344, 1401–1405 CrossRef CAS PubMed.
  2. P. M. Sharp and B. H. Hahn, Cold Spring Harbor Perspect. Med., 2011, 1, a006841 Search PubMed.
  3. V. R. Yedavalli and K. T. Jeang, Retrovirology, 2007, 4, 9 CrossRef PubMed.
  4. J. Tan, M. Su, Y. Zeng and C. Wang, Bioorg. Med. Chem., 2016, 24, 201–206 CrossRef CAS PubMed.
  5. E. Chiappini, E. Berti, K. Gianesin, M. R. Petrara, L. Galli, C. Giaquinto, M. de Martino and A. De Rossi, Cancer Lett., 2014, 347, 38–45 CrossRef CAS PubMed.
  6. H. Sharma, S. Patil, T. W. Sanchez, N. Neamati, R. F. Schinazi and J. K. Buolamwini, Bioorg. Med. Chem., 2011, 19, 2030–2045 CrossRef CAS PubMed.
  7. J. L. Blanco, V. Varghese, S. Y. Rhee, J. M. Gatell and R. W. Shafer, J. Infect. Dis., 2011, 203, 1204–1214 CrossRef CAS PubMed.
  8. M. Su, J. Tan and C. Y. Lin, Drug Discovery Today, 2015, 20, 1337–1348 CrossRef CAS PubMed.
  9. O. Delelis, K. Carayon, A. Saib, E. Deprez and J. F. Mouscadet, Retrovirology, 2008, 5, 114 CrossRef PubMed.
  10. V. Nair and M. Okello, Molecules, 2015, 20, 12623–12651 CrossRef CAS PubMed.
  11. F. D. B. Alan Engelman and R. Craigie, EMBO J., 1993, 12, 7 Search PubMed.
  12. R. C. Alan Engelman, J. Virol., 1992, 66, 9 Search PubMed.
  13. R. C. Yehuda Goldgurt, G. H. Cohent, T. Fujiwara, T. Yoshinaga, T. Fujishita, H. Sugimoto, T. Endo, H. Murai and D. R. Davies, PANS, 2015, 96, 4 Search PubMed.
  14. R. Craigie, Future Virol., 2012, 7, 679–686 CrossRef CAS PubMed.
  15. J. J. Tan, X. J. Cong, L. M. Hu, C. X. Wang, L. Jia and X. J. Liang, Drug Discovery Today, 2010, 15, 186–197 CrossRef CAS PubMed.
  16. T. G. Dewdney, Y. Wang, I. A. Kovari, S. J. Reiter and L. C. Kovari, J. Struct. Biol., 2013, 184, 245–250 CrossRef CAS PubMed.
  17. D. Cada, S. Torres, T. Levien and D. Baker, Hosp. Pharm., 2013, 48, 48–56 CrossRef CAS PubMed.
  18. B. M. Shah, J. J. Schafer and J. A. Desimone Jr., Pharmacotherapy, 2014, 34, 506–520 CrossRef CAS PubMed.
  19. J. M. Llibre, F. Pulido, F. Garcia, M. Garcia Deltoro, J. L. Blanco and R. Delgado, AIDS Rev., 2015, 17, 56–64 Search PubMed.
  20. S. Wu, W. Qi, R. Su, T. Li, D. Lu and Z. He, Eur. J. Med. Chem., 2014, 84, 100–106 CrossRef CAS PubMed.
  21. N. Phosrithong and J. Ungwitayatorn, Bioorg. Chem., 2013, 49, 9–15 CrossRef CAS PubMed.
  22. L. Minini, G. Alvarez, M. Gonzalez, H. Cerecetto and A. Merlino, J. Mol. Graphics Modell., 2015, 58, 40–49 CrossRef CAS PubMed.
  23. M. Huang, G. H. Grant and W. G. Richards, J. Mol. Graphics Modell., 2011, 29, 956–964 CrossRef CAS PubMed.
  24. G. Alvarez, J. Martinez, B. Aguirre-Lopez, N. Cabrera, L. Perez-Diaz, M. T. de Gomez-Puyou, A. Gomez-Puyou, R. Perez-Montfort, B. Garat, A. Merlino, M. Gonzalez and H. Cerecetto, J. Enzyme Inhib. Med. Chem., 2014, 29, 198–204 CrossRef CAS PubMed.
  25. R. Chavez-Calvillo, M. Costas and J. Hernandez-Trujillo, Phys. Chem. Chem. Phys., 2010, 12, 2067–2074 RSC.
  26. L. M. Espinoza-Fonseca and J. G. Trujillo-Ferrara, Bioorg. Med. Chem. Lett., 2004, 14, 3151–3154 CrossRef CAS PubMed.
  27. L. M. Espinoza-Fonseca and J. G. Trujillo-Ferrara, Biochem. Biophys. Res. Commun., 2005, 328, 922–928 CrossRef CAS PubMed.
  28. L. M. Espinoza-Fonseca and J. G. Trujillo-Ferrara, Bioorg. Med. Chem. Lett., 2006, 16, 6288–6292 CrossRef CAS PubMed.
  29. R. Dayam and N. Neamati, Bioorg. Med. Chem., 2004, 12, 6371–6381 CrossRef CAS PubMed.
  30. L. Saiz-Urra, M. P. Gonzalez, Y. Fall and G. Gomez, Eur. J. Med. Chem., 2007, 42, 64–70 CrossRef CAS PubMed.
  31. M. T. Makhija, R. T. Kasliwal, V. M. Kulkarni and N. Neamati, Bioorg. Med. Chem., 2004, 12, 2317–2333 CrossRef CAS PubMed.
  32. R. Costi, R. Di Santo, M. Artico, A. Roux, R. Ragno, S. Massa, E. Tramontano, M. La Colla, R. Loddo, M. E. Marongiu, A. Pani and P. La Colla, Bioorg. Med. Chem. Lett., 2004, 14, 1745–1749 CrossRef CAS PubMed.
  33. X. H. Ma, X. Y. Zhang, J. J. Tan, W. Z. Chen and C. X. Wang, Acta Pharmacol. Sin., 2004, 25, 950–958 CAS.
  34. N. Nunthaboot, S. Tonmunphean, V. Parasuk, P. Wolschann and S. Kokpol, Eur. J. Med. Chem., 2006, 41, 1359–1372 CrossRef CAS PubMed.
  35. M. Donghi, O. D. Kinzel and V. Summa, Bioorg. Med. Chem. Lett., 2009, 19, 1930–1934 CrossRef CAS PubMed.
  36. E. Nizi, M. V. Orsale, B. Crescenzi, G. Pescatore, E. Muraglia, A. Alfieri, C. Gardelli, S. A. Spieser and V. Summa, Bioorg. Med. Chem. Lett., 2009, 19, 4617–4621 CrossRef CAS PubMed.
  37. E. N. Cristina Gardelli, E. Muraglia, B. Crescenzi, M. Ferrara, F. Orvieto, P. Pace, G. Pescatore, M. Poma, M. del Rosario Rico Ferreira, R. Scarpelli, C. F. Homnick, N. Ikemoto, A. Alfieri, M. Verdirame, F. Bonelli, O. G. Paz, M. Taliani, E. Monteagudo, S. Pesci, R. Laufer, P. Felock, K. A. Stillmock, D. Hazuda, M. Rowley and V. Summa, J. Med. Chem., 2007, 50, 22 Search PubMed.
  38. S. Babu, H. Sohn and T. Madhavan, Comput. Biol. Chem., 2015, 56, 109–121 CrossRef CAS PubMed.
  39. H. Zhi, J. Zheng, Y. Chang, Q. Li, G. Liao, Q. Wang and P. Sun, J. Mol. Struct., 2015, 1098, 199–205 CrossRef CAS.
  40. X. Li, L. Ye, X. Wang, H. Liu, Y. Zhu and H. Yu, Toxicol. Appl. Pharmacol., 2012, 265, 300–307 CrossRef CAS PubMed.
  41. V. Consonni, D. Ballabio and R. Todeschini, J. Chem. Inf. Model., 2009, 49, 1669–1678 CrossRef CAS PubMed.
  42. V. Consonni, D. Ballabio and R. Todeschini, J. Chemom., 2010, 24, 194–201 CrossRef CAS.
  43. N. Chirico and P. Gramatica, J. Chem. Inf. Model., 2012, 52, 2044–2058 CrossRef CAS PubMed.
  44. H. F. Leming, M. Shi, W. Tong, J. Wu, R. Perkins, R. M. Blair, W. S. Branham, S. L. Dial, C. L. Moland and D. M. Sheehan, J. Chem. Inf. Comput. Sci., 2001, 41, 186–195 CrossRef.
  45. G. Schuurmann, R. U. Ebert, J. Chen, B. Wang and R. Kuhne, J. Chem. Inf. Model., 2008, 48, 2140–2145 CrossRef PubMed.
  46. R. Salomon-Ferrer, A. W. Gotz, D. Poole, S. Le Grand and R. C. Walker, J. Chem. Theory Comput., 2013, 9, 3878–3888 CrossRef CAS PubMed.
  47. T. A. D. D. A. Case, T. E. Cheatham III, C. L. Simmerling, J. Wang, R. E. Duke, R. Luo, R. C. Walker, W. Zhang, K. M. Merz, B. Roberts, S. Hayik, A. Roitberg, G. Seabra, J. Swails, A. W. Goetz, I. Kolossváry, K. F. Wong, F. Paesani, J. Vanicek, R. M. Wolf, J. Liu, X. Wu, S. R. Brozell, T. Steinbrecher, H. Gohlke, Q. Cai, X. Ye, J. Wang, M. J. Hsieh, G. Cui, D. R. Roe, D. H. Mathews, M. G. Seetin, R. Salomon-Ferrer, C. Sagui, V. Babin, T. Luchko, S. Gusarov, A. Kovalenko and P. A. Kollman, Amber12, University of California, San Francisco, 2012 Search PubMed.
  48. J. C. Phillips, R. Braun, W. Wang, J. Gumbart, E. Tajkhorshid, E. Villa, C. Chipot, R. D. Skeel, L. Kale and K. Schulten, J. Comput. Chem., 2005, 26, 1781–1802 CrossRef CAS PubMed.
  49. D. S. G. G. M. Morris, R. S. Halliday, R. Huey, W. E. Hart, R. K. Belew and A. J. Olson, J. Comput. Chem., 1998, 19, 26 CrossRef.
  50. C. Paissoni, D. Spiliotopoulos, G. Musco and A. Spitaleri, Comput. Phys. Commun., 2014, 185, 2920–2929 CrossRef CAS.
  51. S. I. Virtanen, S. P. Niinivehmas and O. T. Pentikainen, J. Mol. Graphics Modell., 2015, 62, 303–318 CrossRef CAS PubMed.
  52. X.-J. Cong, J.-J. Tan, M. Liu, W.-Z. Chen and C.-X. Wang, Prog. Biochem. Biophys., 2010, 37, 904–915 CrossRef CAS.
  53. A. Onufriev, D. Bashford and D. A. Case, Proteins, 2004, 55, 383–394 CrossRef CAS PubMed.
  54. N. Chirico and P. Gramatica, J. Chem. Inf. Model., 2011, 51, 2320–2335 CrossRef CAS PubMed.
  55. P. Lu, X. Wei and R. Zhang, Eur. J. Med. Chem., 2010, 45, 3413–3419 CrossRef CAS PubMed.

Footnote

Electronic supplementary information (ESI) available. See DOI: 10.1039/c6ra00713a

This journal is © The Royal Society of Chemistry 2016
Click here to see how this site uses Cookies. View our privacy policy here.