Tumor-targeted docetaxel-loaded hyaluronic acid-quercetin polymeric micelles with p-gp inhibitory property for hepatic cancer therapy

Chenfeng Xu, Yu Ding, Jiang Ni, Lifang Yin, Jianping Zhou* and Jing Yao*
State Key Laboratory of Natural Medicines, Department of Pharmaceutics, China Pharmaceutical University, 24 Tongjiaxiang, Nanjing 210009, China. E-mail: yaojing@cpu.edu.cn; zhoujpcpu@163.com; Fax: +86 25 83301606; Tel: +86 25 83271102

Received 7th January 2016 , Accepted 27th February 2016

First published on 1st March 2016


Abstract

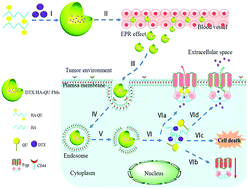
Docetaxel (DTX) has profound effects on several hepatic cancer (HC) cells, but shows unsatisfactory clinical efficacy due to the lack of tumor specificity and p-gp mediated drug efflux. Herein, a novel targeted drug delivery nanosystem based on hyaluronic acid (HA) and quercetin (QU) was designed to improve the in vivo therapeutic efficacy of DTX on HC through HA-CD44 mediated targeting and QU-based p-gp efflux inhibition. DTX-loaded HA–QU polymeric micelles (DTX/HA–QU PMs) displayed a mean particle size of 176.8 ± 3.4 nm with a low polydispersity index (<0.2). The drug loading and entrapment efficiency were 23.6 ± 1.3% and 86.8 ± 1.8%, respectively. Not only did the nanosystem facilitate cellular uptake via HA-CD44 mediated endocytosis, but it also preferentially accumulated at the tumor site via the EPR effect. Moreover, DTX/HA–QU PMs showed prolonged circulation time and high stability in the bloodstream, and achieved AUC0–∞ and t1/2 values that were 3.0-fold and 5.51-fold higher than those of Taxotere®, respectively. In addition, an in vitro cytotoxicity study showed that DTX/HA–QU PMs were 13.6-fold more effective than Taxotere®, judging by the IC50. Importantly, DTX/HA–QU PMs presented the highest antitumor efficacy in a xenograft tumor-bearing mice model and the tumor inhibition ratio was 73.91%. Meanwhile, DTX/HA–QU PMs could down-regulate p-gp expression in tumor cells. These results suggested that the targeting moiety and p-gp efflux inhibitory property help DTX to accumulate at the tumor site and improve its antitumor efficacy in vivo.


Introduction

Hepatic cancer (HC) is one of the major health problems in the world, accounting for a third of all cancer-related deaths every year.1 Treatments for HC are traditionally divided into surgical resection, radiotherapy and chemotherapy. Among them, surgical resection is very limited for patients with multiple or metastatic tumors and the prognosis of patients with HC is still poor, while HC is less sensitive to radiotherapy. Hence, chemotherapy continues to be an important therapeutic option for different HCs, especially for primary advanced HC.2,3

Docetaxel (DTX) is a semi-synthetic taxane analog and chemotherapy drug, derived from the rare Pacific yew tree Taxus brevifolia.4 It is structurally similar to paclitaxel, but has greater affinity for the β-tubulin binding site.5 Some studies have demonstrated that DTX has significant effects on several HC cells, such as SMMC-7221, HepG2, BEL7402, etc.6–8 However, DTX didn’t show a satisfactory clinical effect in patients with HC, which is mainly attributed to the lack of tumor specificity and inherent or acquired resistance to DTX.9–11 Multidrug resistance (MDR) is the ability of drug-resistant cells to exhibit simultaneous resistance to numerous structurally or functionally unrelated chemotherapeutic agents, and is associated with various mechanisms. The overexpression of the ATP binding cassette superfamily (ABCs), particularly p-glycoprotein (p-gp), is one of the most well-known mechanisms, resulting in reduction of intracellular drug concentration.12 It has been reported that intrinsic and acquired DTX resistance is primarily mediated by p-gp, but not by multidrug resistance protein (MRP) or breast cancer resistance protein (BCRP), and is markedly reversed by p-gp modulators.13 Therefore, a HC-targeted DTX delivery system with a p-gp inhibitory property is a prominent strategy for HC therapy in the future.

In recent years, polymeric micelles (PMs), a typical core–shell structured drug carrier, have been widely researched due to their advantages, including narrow size distribution, high stability, high encapsulation efficiency, sustained drug release, enhanced cellular uptake, and passive tumor targeting by the enhanced permeability and retention (EPR) effect.14–17 Among the PMs, polysaccharide PMs possess several distinctive benefits besides the general superior characteristics described above, including biocompatibility, biodegradability and non-immunogenicity. Importantly, polysaccharide PMs have abundant surface functional groups (e.g. –COOH, –NH2 and –OH) for ligand conjugation so they can be modified to possess specific functions, such as active targeting ability, pH sensitivity or MDR reversal effect.18,19 Hyaluronic acid (HA) is one of the most popular FDA-approved biodegradable polyanionic polysaccharides, having low toxicity, and more importantly is a ligand for the CD44 receptor overexpressed in various types of HC cells, such as HepG2 and HepB3.20 Therefore, HA-based PMs are expected to possess enhanced targeting ability to HC cells. Coradini et al.21 constructed CD44-mediated cellular targeting PMs using HA-But, a HA esterified with butyric acid (But) residues, for the treatment of HC. In vitro cytotoxicity in two human HC cell lines (HepB3 and HepG2) and hepatic metastases in vivo in a tumor-bearing mice model indicated that HA-But tended to concentrate in the liver and appeared to be a promising new drug carrier for HC therapy.

Herein, we developed multi-functional PMs based on a new amphiphilic polymer composed of HA and quercetin (QU), with the aim to improve the therapeutic efficacy of DTX for HC through HA-mediated targeting to HC cells and QU-based p-gp efflux inhibition. QU is a natural polyphenolic flavonoid abundantly found in a wide variety of plants and present in fruits, roots, stems and flowers.22 Besides its various physiological activities (e.g. apoptosis induction, angiogenesis inhibition, and activity against several human carcinoma cells, oxidative stress, mutagenesis, etc.), QU can competitively inhibit ABC transporters, such as p-gp, MRP1 and BCRP.23–25 It has been reported that QU can directly interact with purified p-gp and effectively suppress its activity.26 It is also capable of down-regulating p-gp expression in a dose-dependent manner by inhibiting heat shock protein (HSF)–DNA binding activity or suppressing the beta-catenin signaling pathway.27–29

As displayed in Fig. 1, an amphiphilic HA–QU conjugate was fabricated, which physically entrapped DTX to form DTX-loaded HA–QU PMs (DTX/HA–QU PMs). Owing to the HA-based specific tumor-targeting and hydrophilic particle surface, as well as the so-called EPR effect, DTX/HA–QU PMs were expected to exhibit considerable accumulation at tumor sites and possess prolonged blood circulation, and to be internalised into tumor cells via CD44 receptor-mediated endocytosis. After endocytosis, DTX/HA–QU PMs were disassembled in tumor cells, attributed to the more acidic environment (pH ∼ 5.5) and esterase hydrolysis,30–32 resulting in the release of DTX and QU. The released DTX specifically binds to β-tubulin for subsequent triggering of apoptosis and cytotoxicity.5 QU acts as a p-gp inhibitor to down-regulate p-gp expression and simultaneously hinder the efflux of DTX,27–29 which might ensure a high intracellular concentration and enhanced antitumor efficacy of DTX in vivo. In this study, we successfully developed the amphiphilic HA–QU conjugate and prepared DTX/HA–QU PMs. Subsequently, the physicochemical characteristics of the HA–QU conjugate and DTX/HA–QU PMs were investigated. Further to this, the cell uptake and biodistribution were studied to confirm the tumor targeting ability of the HA–QU conjugate. The cytotoxicity in HepG2 cells and antitumor efficacy in xenograft Heps tumor-bearing mice were investigated to further demonstrate the potential clinical application of DTX/HA–QU PMs. Meanwhile, the level of p-gp expression in tumor cells was evaluated.


image file: c6ra00460a-f1.tif
Fig. 1 The schematic representation of self-assembly and in vivo trafficking pathway of DTX/HA–QU PMs. (I) Self-assembly of DTX/HA–QU PMs. (II) Injection via tail vein. (III) Accumulation at tumor site via the EPR effect. (IV) CD44 receptor-mediated endocytosis. (V) Endosomal/lysosomal escape. (VI) Disassembly and release of DTX and QU. QU mediated p-gp efflux inhibition (VIa); p-gp expression down-regulation (VIb); combination of DTX on β-tubulin inducing cell death (VIc); p-gp mediated DTX efflux (VId).

Experimental section

Materials

Hyaluronic acid (HA, MW 7300 Da) was purchased from Freda Biopharma Co., Ltd. (Shandong, China). Quercetin (QU) and docetaxel (DTX) were purchased from Sanwei Pharmaceutical Co., Ltd. (Shanghai, China) and Jintai Biological Engineering Co., Ltd. (Shanxi, China), respectively. Anhydrous formamide was from Shanghai Lingfeng Chemical Reagent Co., Ltd. (Shanghai, China). N-Hydroxysuccinimide (NHS) and 1-ethyl-3-(3-dimethylaminopropyl)carbodiimide (EDC) were purchased from Aladdin Reagent Database Inc. (Shanghai, China). All other reagents were of HPLC or analytical grade and were used without further purification.

Animals were purchased from Qinglong mountain animal breeding center (Nanjing, China). Animals were cared for in accordance with the National Institute of Health (NIH) guidelines for the care and use of laboratory animals (NIH publication 80-23, revised in 1996). All animal experiments complied with the requirements of the National Act on the Use of Experimental Animals (China) and were approved by Society of Animal Ethics, China Pharmaceutical University.

Synthesis and characterisation of HA–QU conjugate

The HA–QU conjugate was synthesised by esterification. Briefly, HA (190.3 mg) was dissolved in 20 mL anhydrous formamide at 50 °C. After the HA solution was cooled to room temperature, EDC (191.7 mg) and NHS (115.5 mg) were added. The mixture was then continuously stirred for 2 h in an ice bath. QU (151.2 mg) was dissolved in 20 mL anhydrous formamide and then slowly added into the above mixture under vigorous stirring, followed by being kept in the dark for additional 24 h under a nitrogen atmosphere. Next, the reaction mixture was precipitated in acetone and filtrated. The precipitate was carefully washed with alcohol until the subsequent filtrate was colorless, to wash away the free QU. The gelatinous product was dispersed in de-ionized (DI) water, and then dialysed against DI water using a dialysis bag (MWCO 3500) for two days with a bath change every 8 h, followed by filtration with a 0.8 μm water membrane and lyophilization.

The chemical structure of the HA–QU conjugate was confirmed by 1HNMR and FT-IR spectroscopy. The molar degree of substitution (DS), i.e. the number of QU molecules grafted per HA molecule, was evaluated by UV-vis spectrometry at a wavelength of 255 nm, using a calibration curve generated with known concentrations (ranging from 5 to 20 μg mL−1) of QU/methanol (MeOH) solution. In addition, the hydroxyl grafting site in the QU skeleton was determined using UV-vis spectrometry by comparing the difference in UV spectra between HA–QU in MeOH with and without chemical diagnostic reagents.

Moreover, the critical micelle concentration (CMC) of the HA–QU conjugate was determined using a fluorescence probe technique, with pyrene as a probe.18 In brief, 1 mL of pyrene solution in acetone (1 × 10⁻⁶ M) was added into 10 mL brown volumetric flasks and acetone was subsequently evaporated under a gentle nitrogen gas flow. HA–QU solutions (concentrations ranging from 0.2 to 2000 μg mL−1) were added into each brown volumetric flask, followed by sonication for 30 min and incubation at 60 °C for 1 h, and then equilibration overnight at room temperature in the dark. The fluorescence intensities of the different samples were measured using a fluorescence spectrophotometer (RF-5301 PC, Shimadzu, Japan) and the excitation spectra (300–400 nm) were obtained at a fixed emission wavelength of 390 nm. The intensity ratio of I338/I333 in the excitation spectra was analysed for calculation of the CMC.

In addition, the zeta potential and particle size distribution of the HA–QU PMs were measured using a dynamic light scattering instrument (DLS, Brookhaven, USA) at room temperature.

Haemolysis tests

The haemolysis testing of the amphiphilic HA–QU conjugate was performed using 2% v/v rabbit red blood cells (RBCs) with Tween80 as a control. 2.5 mL of RBC suspension was added into the same volume of HA–QU solution to make concentrations of HA–QU ranging from 0.02 to 4 mg mL−1. The mixture was incubated at 37 °C for 3 h and then centrifuged at 3000 rpm for 10 min to remove non-lysed RBC. The supernatant was analysed by UV-vis spectrometry at 540 nm. Free saline and DI water were used as positive (100% haemolysis) and negative (0% haemolysis) controls, respectively. The haemolysis percentage was calculated using the following equation:
Haemolysis (%) = [(AsampleA0%)/(A100%A0%)] × 100%
Asample, A100% and A0% stand for the absorbance values of the sample group, positive group and negative group, respectively.

Preparation and characterisation of DTX/HA–QU PMs

DTX/HA–QU PMs were prepared by a probe-type ultrasonic and dialysis method. Briefly, 20 mg of lyophilized HA–QU powder was dissolved in 4 mL DI water and 8 mg of DTX was dissolved in 0.5 mL anhydrous ethanol. Next, the DTX/ethanol solution was dropped into the HA–QU PM solution under vigorous stirring at room temperature. The mixture was then sonicated using a probe-type ultrasonicator for 20 min in an ice bath, followed by dialysis against DI water for 8 h. The post-dialysis solution was centrifuged at 3000 rpm for 10 min to eliminate the non-entrapped DTX, and the supernatant was then filtered through a 0.45 μm membrane and lyophilized.

The drug loading (DL) and entrapment efficiency (EE) were measured using high performance liquid chromatography (HPLC, Inertsil SIL-100A LC-2010 system, Tokyo, Japan) with UV detection at 229 nm. A C18 column (Inertsil ODS-SP, 4.6 × 250 mm, 5 μm) was used and the column temperature was maintained at 30 °C. The mobile phase, composed of acetonitrile/distilled water (50[thin space (1/6-em)]:[thin space (1/6-em)]50, v/v), was freshly prepared and degassed prior to use and the flow rate was set at 1.0 mL min−1. A certain amount of lyophilized DTX/HA–QU powder was dissolved in DI water and diluted 10-fold with MeOH. The mixture was then sonicated for 20 min to completely destroy the structure of the micelles and release the DTX, followed by filtration with a 0.22 μm membrane, and 20 μL was injected for HPLC analysis. The amount of DTX was calculated from a standard curve over the linear range of 0.5 to 50 μg mL−1. All the measurements were performed three times. The DL and EE were calculated using the following equations:

DL (%) = (weight of DTX in DTX/HA–QU)/(weight of DTX/HA–QU) × 100%

EE (%) = (weight of DTX in DTX/HA–QU)/(weight of DTX added) × 100%

Furthermore, the zeta potential, particle size and poly-dispersity index (PDI) of the DTX/HA–QU PMs were assessed by DLS at room temperature. The morphology of the DTX/HA–QU PMs was observed using atomic force microscopy (AFM, Nano Scope IIIa, Veeco, USA) and transmission electron microscopy (TEM, JEOL 100CX, Tokyo, Japan). The interaction of the HA–QU conjugate with DTX was evaluated by differential scanning calorimetry (DSC, Netzsch 204, Germany); the DSC experiment was performed to investigate the physical properties of the DTX, blank HA–QU conjugate, physical mixture of DTX plus HA–QU conjugate and blank DTX/HA–QU PMs.

In vitro drug release

The in vitro release profiles of DTX from DTX/HA–QU PMs were investigated by a dialysis method using PBS (0.1 M, pH 7.4 or pH 5.8, containing 0.1% w/v Tween80) as the release medium. In brief, 1 mL of DTX/HA–QU PM solution (containing 4.4 mg DTX/HA–QU PMs) was loaded into dialysis tubes with a molecular weight cut-off of 3.5 kDa. The dialysis tubes were then fully submerged into release medium at 80–90 rpm with a water bath maintained at 37 °C. Tween80 was used to improve the solubility of DTX in PBS and avoid the binding of DTX with the tube wall. At predetermined intervals, 1 mL of release medium was sucked out and replaced with an equal volume of fresh medium. Next, the collected medium was extracted thrice with 2 mL dichloromethane, then dried under a stream of nitrogen and dissolved with 200 μL MeOH for HPLC analysis. The analysis procedure was similar to that previously described. All assays were carried out in triplicate.

The extraction efficiency tests were assessed in triplicate using PBS (0.01 M, pH 7.4 or pH 5.8, containing 0.1% w/v Tween80) containing a known concentration (ranging 2.5–50 μg mL−1) of pure DTX, and the extraction procedure was similar to that described above.

In vitro cellular uptake

The HepG2 cells were cultured in DMEM medium containing 1% penicillin–streptomycin and 10% FBS, and then maintained under standard culture conditions at 37 °C and 5% CO2 in a humidified environment. Before the experiments, the cells were pre-cultured until the cellular confluence was 70%.

To visualise the in vitro cellular uptake and intracellular distribution of the HA–QU PMs, coumarin-6 (C6, Sigma, USA) was encapsulated into the HA–QU PMs as a fluorescence marker using a probe-type ultrasonic and dialysis method. Briefly, 15 mg of lyophilized HA–QU powder was dissolved in 5 mL DI water, and then 100 μL C6/ethanol solution (300 μg mL−1) was dropped into the HA–QU PM solution under vigorous stirring at room temperature in the dark. The mixture was then sonicated for 20 min in an ice bath, followed by dialysis against DI water for 8 h in the dark. Next, the post-dialysis solution was centrifuged at 3000 rpm for 10 min to remove the non-entrapped C6, followed by filtration through a 0.45 μm membrane and lyophilization. The C6 content in the C6-loaded HA–QU PMs (C6/HA–QU PMs) was determined by fluorescence spectrometry (Ex/Em: 467/505 nm).

HepG2 cells were seeded at a density of 1 × 10⁴ cells per well and incubated at 37 °C in a humidified environment with 5% CO2 for 24 h. The medium was then replaced by free C6 or C6/HA–QU PMs diluted in the medium at equivalent concentrations of C6. At designated time points (2 and 4 h after incubation), the cells were washed thrice with PBS and fixed with 4% paraformaldehyde for 20 min. The cells were further washed three times and the nuclei were then stained using DAPI for 20 min. Finally, the fixed monolayer cells were washed thrice with PBS and observed by confocal laser scanning microscopy (CLSM, Olympus Flowview FV 1000, Japan) (Ex/Em, 495/520 nm).

In vitro cytotoxicity

The MTT assay was used to evaluate the in vitro anti-proliferative activity of DTX/HA–QU PMs, Taxotere® and HA–QU plus Taxotere®. The HepG2 cells were seeded into 96-well plates at a density of 5 × 10³ per well and incubated with 200 μL DMEM medium at 37 °C in a humidified atmosphere with 5% CO2 for 24 h. The cells were then incubated for 48 h with 200 μL fresh medium containing DTX/HA–QU PMs, Taxotere® or HA–QU plus Taxotere® at equivalent DTX concentrations of 20, 2, 0.2, 0.02 and 0.002 μg mL−1. MTT solution (20 μL, 5 mg mL−1, Sigma, USA) was then added to each well and incubated for another 4 h at 37 °C. The medium was then removed and 100 μL DMSO was added into each well to dissolve the formazan crystals. The absorbance at 570 nm was measured with a microplate reader (Thermo Electron Corporation, USA). The cell viability (%) and half maximal inhibitory concentration (IC50) were calculated. Each point was performed in sextuplicate.

Pharmacokinetics study

The pharmacokinetics study was performed in SD rats (200–250 g). The rats were randomly distributed into two groups (n = 5), then DTX/HA–QU PMs and Taxotere®, respectively, were intravenously administered at a DTX dose of 10 mg kg−1. At predetermined intervals, blood samples (∼0.5 mL) were collected and immediately centrifuged at 10[thin space (1/6-em)]000 rpm for 10 min; the plasma was stored at −20 °C until analysis. DTX in the plasma was extracted thrice with equal volumes of methyl tert-butyl ether. Next, the mixture was centrifuged at 10[thin space (1/6-em)]000 rpm for 5 min; the organic phase was then collected and evaporated to dryness. The residues were dissolved with 200 μL MeOH for HPLC analysis. The analysis procedure was similar to that previously described. The DTX concentration in the plasma was calculated using a standard curve obtained for known concentrations of DTX in plasma processed similarly. The pharmacokinetic parameters were calculated using a non-compartmental model by the Drug and Statistics (DAS) software (version 2.1.1, Mathematical Pharmacology Professional Committee, China).

In vivo imaging study

A near-infrared fluorescent dye, DiR (Sigma, USA), was loaded into HA–QU PMs to monitor in vivo dynamic distribution and tumor-targeting capability. When the volume of the tumor reached to 100–200 mm3, the Heps tumor-bearing mice were intravenously injected with free DiR or DiR-loaded HA–QU PMs (DiR/HA–QU PMs) at a DiR dose of 0.4 mg kg−1, and then anesthetised using intraperitoneal injection of chloral hydrate (10 mg kg−1). At predetermined time points, fluorescence images were obtained using an IVIS Lumina imaging system (Caliper, USA) at 710 nm for excitation and 760 nm for emission. After 24 h scanning, the mice were euthanised. The tumors as well as the major organs were harvested and lightly washed with saline, followed by ex vivo imaging, and the fluorescence intensity was analysed using Living Image Software.

In vivo antitumor efficacy

To evaluate the in vivo antitumor efficacy of DTX/HA–QU PMs, the xenograft Heps tumor-bearing mice were randomly divided into four groups (n = 6): (1) saline; (2) Taxotere® (10 mg kg−1 DTX); (3) DTX/HA–QU PMs (10 mg kg−1 DTX); (4) HA–QU plus Taxotere® (10 mg kg−1 DTX and 34 mg kg−1 HA–QU conjugate). The different formulations were administrated via tail vein at 2 day intervals, 5 times. The tumor size was measured every other day and calculated as length × width2/2; the body weight was monitored each day to assess the possible toxic effects of the therapy. At day 10, the mice were sacrificed by cervical dislocation; the tumor tissues were excised and lightly rinsed with saline to remove residual blood, weighed and stored. The inhibition ratio (IR), used as another index of antitumor efficacy, was calculated using the following equation:
IR (%) = (WsWf)/Ws × 100%
Ws and Wf stand for the average tumor weight for the saline group and formulation group, respectively.

To further evaluate the in vivo antitumor efficacy and the apoptotic response in tumor tissues, hematoxylin and eosin staining (H&E) and terminal deoxynucleotidyl transferase TdT-mediated dUTP Nick-End Labeling (TUNEL) were applied to paraffin-embedded tumor samples.

Western blot analysis

Frozen Heps tumor tissues, excised from the tumor-bearing mice after the in vivo antitumor efficacy assay and then stored at −80 °C, were thawed before use and gently washed twice with saline. After being cut into pieces and triturated on ice, the samples were lysed at 4 °C for 1 h in cell lysis buffer (Beyotime Institute of Biotechnology, Shanghai, China). The lysates were centrifuged at 12[thin space (1/6-em)]000 rpm at 4 °C for 5 min, and then the total protein concentration of each sample was quantified by BCA assay according to the manufacturer’s instructions (Beyotime Institute of Biotechnology, Shanghai, China), then further used for western-blot analysis.

The p-gp content of each sample was determined based on Lowry’s method33 with a slight modification. Briefly, 50 μg of lysate samples were denatured at 98 °C for 5 min in loading buffer, followed by loading on a 10% SDS-polyacrylamide gel for electrophoresis, and then transfer onto a PVDF membrane for 2 h. The membrane was blocked with blocking buffer at room temperature for 1 h. Next, the membrane was incubated with MDR1/ABCB1 rabbit monoclonal antibody (Cell Signaling Technology, USA) at 1[thin space (1/6-em)]:[thin space (1/6-em)]1000 in blocking buffer with gentle shaking, overnight at 4 °C. After three washes with TBST for 10 min, the membrane was incubated for 1 h at room temperature with a horseradish peroxidase-conjugated anti-rabbit secondary antibody (ComWin Biotech Co., Ltd., Beijing, China) at 1[thin space (1/6-em)]:[thin space (1/6-em)]500 in blocking solution. Immunoreactive protein was detected using an ECL chemiluminescence system (Santa Cruz Biotechnology, USA) according to the supplier’s protocols. In parallel, β-actin was used as an internal control to ascertain equal protein loading. The specific anti-actin rabbit polyclonal antibody (Abcam, USA) and horseradish peroxidase-conjugated anti-rabbit secondary antibody were diluted at 1[thin space (1/6-em)]:[thin space (1/6-em)]1000 and 1[thin space (1/6-em)]:[thin space (1/6-em)]500 in blocking solution, respectively. The protein bands were then analysed with the Quantity One software (Bio-Rad, USA), and normalised to β-actin expression.

Statistical analysis

All the data were presented as mean ± SD. Statistical significance was tested using a two-tailed Student’s t-test or one-way ANOVA using SPSS19 statistical software. Statistical difference was considered to be of significance at *P < 0.05 and of extreme significance at **P < 0.01.

Results and discussion

Synthesis and characterisation of HA–QU conjugate

The HA–QU conjugate was characterised by 1HNMR and FT-IR. In the 1HNMR spectrum of QU (Fig. 2a), the characteristic peaks appearing at 6.18–7.63 ppm were attributed to the aromatic ring of QU. The signals at 3.2–3.8 ppm and 1.92 ppm corresponded to glucosidic protons and the acetamido moiety of the HA skeleton, respectively (Fig. 2b). In the 1HNMR spectrum of HA–QU, the characteristic peaks at 6.0–8.0 ppm were assigned to the –CH of QU, while the peaks for the N-acetyl group at 1.96 ppm and the glucosidic protons at 3.0–3.6 ppm of HA were simultaneously confirmed (Fig. 2c), indicating that QU was successfully grafted onto HA. The structure of the HA–QU conjugate was further verified by FT-IR (Fig. 2d). In the FT-IR spectrum of QU, several weak peaks appearing in the fingerprint region were attributed to the aromatic ring, while the strong and broadened peaks were assigned to the stretching vibration of –OH. The strong peaks observed at 1615.7 cm−1 and 3386.5 cm−1 corresponded to the stretching vibrations of –COO and –OH in the HA skeleton, respectively. Meanwhile, a new peak at 1656.9 cm−1 in the HA–QU FT-IR spectrum was attributed to the carbonyl vibration, further supporting that QU was successfully grafted onto HA by forming ester bonds. The DS, i.e. the molar ratio of QU to HA, was around 14.0%.
image file: c6ra00460a-f2.tif
Fig. 2 Characterisation of HA–QU conjugate. (a) 1HNMR spectrum of QU in D2O[thin space (1/6-em)]:[thin space (1/6-em)]DMSO-d6 (1[thin space (1/6-em)]:[thin space (1/6-em)]1). (b) 1HNMR spectrum of HA in D2O. (c) 1HNMR spectrum of HA–QU in D2O[thin space (1/6-em)]:[thin space (1/6-em)]DMSO-d6 (1[thin space (1/6-em)]:[thin space (1/6-em)]1). (d) FT-IR spectra of QU, HA and HA–QU.

Obviously, QU is a typical polyhydroxy flavonol-type compound with five hydroxyl groups, of which three hydroxyls (3,5,7-OH) are attached to the chromanone ring and two to the benzene ring (3′,4′-OH) (Fig. 2a). Its polyhydroxy structure provides the main determinants for numerous biological activities, of which the p-gp inhibition effect has significant correlation with the hydroxyls bound to the chromanone ring. For example, quercetin-3-O-glucoside and rutin did not display any p-gp inhibition effect up to 200 μM concentration, compared with QU.34 Therefore, it is essential to assess the substitution site of HA with QU. In this study, the substitution site was identified from the UV-vis spectra, which can characteristically reflect the chemical structure of flavonoids. In addition, the difference in the UV spectra of flavonoids in MeOH compared with MeOH plus chemical diagnostic reagents can provide more important information about the structure of flavonoids.35,36 Fig. 3 depicts the UV spectra of HA–QU in MeOH and in MeOH plus different chemical diagnostic reagents, including sodium methylate (NaOMe), aluminum chloride (AlCl3), AlCl3/hydrochloric acid (HCl), NaOAc and NaOAc/boric acid (H3BO3). The UV spectrum of HA–QU in MeOH had two main absorption bands, named as band 1 and band 2, and the maximum absorption wavelengths were 360 nm and 266 nm, respectively (Fig. 3a). In the UV spectrum of HA–QU in MeOH/NaOMe, band 1 was red-shifted by 44 nm to 404 nm, with increased absorption intensity (Fig. 3a), indicating that the 4′-OH still existed in the HA–QU skeleton. In addition, an additional band appeared at 320–330 nm (Fig. 3a), illustrating that the 7-OH still existed. As shown in Fig. 3b, the UV spectrum of HA–QU in MeOH/AlCl3 was approximately similar to that in MeOH/AlCl3/HCl; therefore, the 3′-OH and 4′-OH did not simultaneously exist. Moreover, band 1 was red-shifted by 55 nm to 415 nm, which indicated that the 3-OH and 5-OH might simultaneously exist. As shown in Fig. 3c, band 2 of HA–QU in MeOH/NaOAc was red-shifted by 8 nm to 274 nm, which further verified the existence of the 7-OH, and band 1 of HA–QU in MeOH/NaOAc/H3BO3 was red-shifted by 10 nm to 370 nm, which also illustrated that the 3′-OH and 4′-OH did not co-exist. Meanwhile, the chromogenic reaction of flavonoids with different metal reagents, such as zirconium oxychloride, zirconium oxychloride plus citric acid, magnesium acetate and strontium dichloride,37,38 were used to provide corroborative evidence for the UV-vis method and reached the same conclusion. In conclusion, the HA–QU conjugate was synthesised by forming ester bonds based on the –COOH in the HA skeleton and the 3′-OH in QU, indicating no effect on the p-gp inhibition ability of QU.


image file: c6ra00460a-f3.tif
Fig. 3 UV-vis spectra of HA–QU in MeOH with or without diagnostic reagents. UV-vis spectra of HA–QU in MeOH and in MeOH/NaOMe (a); in MeOH/AlCl3 and in MeOH/AlCl3/HCl (b); in MeOH/NaOAc and in MeOH/NaOAc/H3BO3 (c).

The CMC, an important parameter characterising the micelle-forming ability and stability of amphiphilic polymers, was determined using a fluorescence probe technique with pyrene as a probe and was found to be 50.5 μg mL−1 (log[thin space (1/6-em)]C = 1.699, Fig. S1). This value was significantly lower than that of other low-molecular-weight surfactants,39 indicating that the HA–QU conjugate would display good dilution stability in the bloodstream following intravenous injection.

It is well known that amphiphilic polymers can self-assemble to form PMs, which can be prepared by various kinds of methods, such as dialysis, emulsification and ultrasound, via hydrophobic interactions in aqueous medium. In this study, the HA–QU PMs were prepared by a probe-type ultrasound method, a simple method with no stabilizer, emulsifier or other agents. The HA–QU conjugate was sonicated to form self-assembled HA–QU PMs in aqueous solution, attributed to the amphiphilic characteristic of HA–QU. The zeta potential was −19.5 ± 1.2 mV, owing to the unconjugated carboxyl groups in the HA skeleton, resulting in good stability and dispersion in the bloodstream.40

Haemolysis tests

Amphiphilic surfactants can induce haemolysis at a given concentration, due to the increase in permeability of the membrane and the subsequent colloid osmotic lysis of the cell.41 The structure of amphiphilic polymers is similar to that of amphiphilic surfactants, so it is necessary to evaluate the haemolysis of amphiphilic polymers. In this study, the haemolysis by the HA–QU conjugate was investigated with Tween80 as a control, which is a typical surfactant and is also used as a solubilizer in Taxotere®. The haemolysis induced by Tween80 remarkably increased with increasing concentration, and reached 34.9% at a concentration of 0.5 mg mL−1 (Fig. S2). However, the haemolysis by HA–QU remained lower than 4% as the concentration increased from 0.02 to 4 mg mL−1, indicating that the HA–QU conjugate might be a potent drug carrier with the advantage of biocompatibility and non-toxicity towards erythrocytes.

Preparation and characterisation of DTX/HA–QU PMs

Self-assembled PMs can entrap a drug through three approaches to form drug-loaded PMs, including physical incorporation, chemical linking and electrostatic interaction. In the present study, DTX was physically encapsulated into the HA–QU PMs using a probe-type ultrasonic and dialysis method to fabricate DTX/HA–QU PMs, which were then characterised with respect to DL, EE, zeta potential, particle size, PDI, morphology and form of DTX in the DTX/HA–QU PMs.

DL and EE capacities are two important parameters to evaluate the quality of drug-loaded PMs. The DL and EE of the DTX/HA–QU PMs were 23.6 ± 1.3% and 86.8 ± 1.8%, respectively. The zeta potential was −19.4 ± 1.1 mV, which was approximately the same as that of the blank HA–QU, indicating that the micellar surface was covered with negatively charged hydrophilic HA polymers. Moreover, the mean particle size of the DTX/HA–QU PMs was 176.8 ± 3.4 nm with a relatively low PDI (<0.2) (Fig. 4A), which was smaller than that of the blank HA–QU PMs (219.8 ± 5.2 nm), demonstrating that the DTX/HA–QU PMs were more compact due to the hydrophobic interaction between DTX and the hydrophobic segment of HA–QU.42 Unequivocally, both particle size and hydrophilic surface are significant factors to overcome the renal excretion and capture by the reticuloendothelial system (RES), which is an immune system consisting of phagocytic cells, mainly located in the liver and spleen. The threshold of renal clearance and RES capture was reported to be smaller than 5 nm and larger than 500 nm in hydrodynamic diameter, respectively.43,44 In addition, pores within the tumor vasculature are reported to be several hundreds of nanometers.45 Hence, owing to the suitable particle size and hydrophilic HA surface, DTX/HA–QU PMs might get more chance to effectively accumulate at the tumor site through the EPR effect and prolong the circulation time in blood vessels by evading renal clearance and RES capture.


image file: c6ra00460a-f4.tif
Fig. 4 Characterisation of DTX/HA–QU PMs. (A) Particle size distribution and TEM image of DTX/HA–QU PMs. (B) DSC profiles of DTX (a); HA–QU conjugate (b); HA–QU conjugate plus DTX (c); DTX/HA–QU PMs (d). (C) AFM image of DTX/HA–QU PMs.

Moreover, the micrograph of the DTX/HA–QU PMs was observed using TEM and AFM, showing almost spherical micelles with uniform size (Fig. 4A and C). Finally, DSC analysis was carried out to confirm the physical state of DTX in the DTX/HA–QU PMs. Fig. 4B displays the calorimetric curves of DTX, blank HA–QU conjugate, physical mixture of DTX plus HA–QU conjugate and blank DTX/HA–QU PMs. DTX showed an endothermic peak at 175 °C and an exothermic peak at 224 °C; these peaks were considered to be the melting endothermic peak and the degradation peak of DTX, respectively. The blank HA–QU conjugate exhibited an exothermic peak around 228 °C. The physical mixture displayed all the characteristic peaks of DTX and the HA–QU conjugate, with a slight shift. As expected, the DTX/HA–QU showed no melting peak of DTX, and the calorimetric curve was similar to the blank HA–QU conjugate, indicating that DTX was transformed from the crystalline state to amorphous state and was successfully loaded into the HA–QU PMs.46

In vitro drug release

DTX release is usually studied in PBS buffer solution in order to simulate the in vivo biological environment. The desired anticancer drug-loaded PMs were expected to maintain stability in blood vessels and give sustained release drug at tumor sites. Thus, in this study, the in vitro release profiles of DTX from the DTX/HA–QU PMs were determined at pH 7.4 and pH 5.5 to simulate the pH evolution of the blood vessels and tumor site, respectively. The extraction efficiencies were 90.9 ± 0.8% and 85.7 ± 0.5% in release media of pH 7.4 and pH 5.5, respectively.

The in vitro release profiles of the DTX/HA–QU PMs within 96 h are shown in Fig. 5. DTX was fairly slowly released in PBS buffer solution at pH 7.4 and remained at around 30% from 24 h to 96 h with no significant change, indicating that the DTX/HA–QU PMs were relatively stability in the neutral blood environment. In contrast, the DTX/HA–QU PMs exhibited a steady continued-release pattern without a dramatic initial burst at pH 5.5 within 96 h. Meanwhile, the cumulative release of DTX at pH 5.5 remained higher than that at pH 7.4 at all time points, especially from 24 h to 96 h. These results showed that DTX might be preferentially released from the DTX/HA–QU PMs at the mildly acidic pH of the tumor site as well as in the endosomal and lysosomal compartments of cells,47 which is perhaps due to the accelerated hydrolysis of the pH-sensitive ester linkages between HA and QU under weakly acidic conditions, relative to under neutral conditions.31 In addition, esterase, a ubiquitous intracellular protease overexpressed in a variety of malignant tumors, such as HC, lung cancer and gastric cancer, is reportedly capable of triggering DTX and QU release from DTX/HA–QU PMs in tumor cells by catalysing the hydrolysis of the ester linkage.32 Xin et al.31 developed a QU-based prodrug via an ester linkage, and in vitro studies showed that the release profile of QU was pH-dependent and dramatically accelerated by esterase.


image file: c6ra00460a-f5.tif
Fig. 5 In vitro release profiles of DTX/HA–QU PMs. PBS (0.1 M) with 0.1% w/v Tween80 at pH 7.4 and pH 5.5 was the release medium. Data is presented as mean ± SD (n = 3).

In vitro cellular uptake

To assess the intracellular uptake efficiency of the HA–QU PMs, coumarin-6, a lipid-soluble compound with advantages of high fluorescence efficiency and stability under various pH conditions,48,49 was employed as a fluorescence marker and incorporated into HA–QU PMs by a probe-type ultrasonic and dialysis method. The C6 content in the C6/HA–QU PMs was 0.25%, and the mean particle size and PDI were 175.7 ± 6.1 nm and 0.151 ± 0.038, respectively.

The cellular uptake efficiency of the HA–QU PMs was evaluated by CLSM using HepG2 cells (high CD44 expression50,51) incubated with free C6 or C6/HA–QU PMs for 2 h and 6 h. As shown in Fig. 6, the green fluorescence signal of C6 in the cytoplasm obviously became stronger as the incubation time increased, both in the free C6 group and C6/HA–QU PMs group, demonstrating that the cellular uptakes of free C6 and C6/HA–QU PMs were both time-dependent. However, the green fluorescence intensity in the nuclei showed no significant change in the two groups. These results indicated that the C6/HA–QU PMs mainly accumulate in cytoplasm, which might be beneficial to enhance the anti-proliferation efficacy of DTX as an inhibitor of microtubule depolymerization.52 In addition, as we expected, the green fluorescence intensity in the C6/HA–QU PMs group was significantly brighter than in the C6 group at the same incubation time, indicating that the HA–QU PMs could really facilitate internalization of water-insoluble drugs into HepG2 cells. It appeared that a different mechanism existed for the in vitro cellular uptake of C6/HA–QU PMs compared to conventional formulations. The HA-CD44 mediated endocytosis might play an essential role in the efficient internalisation of nanoparticles into cells, resulting in an enhanced intracellular fluorescence signal. Cho et al.53 developed a self-assembled nanoparticle based on HA–ceramide and Pluronic® for tumor-targeted delivery of DTX. The cellular uptake of DTX after 2 h in MCF-7 cells (high CD44 expression) was significantly higher than in U87-MG cells (low CD44 expression). The competitive inhibition experiment where CD44 was blocked by HA also indicated that HA-CD44 mediated endocytosis did promote the internalisation of nanoparticles. In our present study, the HA–QU conjugate might simultaneously inhibit p-gp efflux depending on the special function of QU, thereby resulting in higher C6 concentration in tumor cells.


image file: c6ra00460a-f6.tif
Fig. 6 Confocal laser scanning microscopy (CLSM) images of HepG2 cells after incubation with free C6 or C6/HA–QU PMs for 2 h and 6 h.

In vitro cytotoxicity

The cytotoxicity of Taxotere®, HA–QU plus Taxotere® and DTX/HA–QU PMs was investigated using the MTT assay in HepG2 cells at DTX concentrations of 20, 2, 0.2, 0.02, 0.002 μg mL−1 for 48 h. As shown in Fig. 7, dose-dependent cytotoxicity of DTX was observed in the three groups. Importantly, the cell viability with the DTX/HA–QU PMs was significantly decreased compared with Taxotere® (P < 0.05) and HA–QU plus Taxotere® (P < 0.05). That is to say, the DTX/HA–QU PMs showed the highest cytotoxicity in vitro in the three groups. In addition, the IC50 was calculated for quantitative evaluation of the in vitro antitumor efficacy. The IC50 values of Taxotere® and the DTX/HA–QU PMs were 0.087 μg mL−1 and 0.00639 μg mL−1, respectively. These results further suggested that the DTX/HA–QU PMs exhibited enhanced cytotoxicity in vitro against HepG2 cells. In many studies, the cytotoxicity of drug-loaded nanoparticles was lower than the free drug due to sustained release of the drug from the nanoparticles.54–57 In this study, the combination of HA-CD44 mediated endocytosis with the QU-mediated p-gp inhibitory property might contribute to enhanced cytotoxicity of the DTX/HA–QU PMs in vitro. In addition, it was found that the cell viability in the HA–QU plus Taxotere® group slightly decreased with no significant change compared to Taxotere® at the equivalent concentration of DTX, suggesting that the encapsulation of the drug in nanoparticles is critical for the efficient transmembrane transportation of the drug.
image file: c6ra00460a-f7.tif
Fig. 7 Cell viability of HepG2 cells after incubation for 48 h with Taxotere®, DTX/HA–QU PMs or HA–QU plus Taxotere® according to DTX concentration. Data is given as the mean ± SD (n = 6). *P < 0.05.

Pharmacokinetic study

The prolonged circulation of nanoparticles in the bloodstream is beneficial to increase their probability of accumulating at the tumor site after systemic administration in vivo.58 To investigate the pharmacokinetic behaviors of the DTX/HA–QU PMs, we have performed pharmacokinetic studies at the DTX dose of 10 mg kg−1 in SD rats, using Taxotere® as a reference. The plasma drug concentration–time curves of DTX are presented in Fig. 8. As can be seen, Taxotere® was quickly removed from the circulating system, and DTX could not be detected after more than 8 h. In contrast, the DTX/HA–QU PMs displayed a long blood circulation time in rat plasma, and after administration DTX was still detectable for 24 h. Moreover, the DTX concentration in plasma in the DTX/HA–QU PMs group remained higher than in the Taxotere® group at all time points. The main pharmacokinetic parameters of DTX were calculated by logarithmic trapezoidal methods using a non-compartmental model, and are listed in Table 1. The DTX/HA–QU PMs significantly increased the t1/2 and MRT of DTX by 5.51-fold and 4.0-fold, respectively, with a corresponding significantly decreased CL (P < 0.01). The results further indicated that the HA–QU PMs could delay the elimination of DTX and prolong its circulation time in the bloodstream, which might have a positive effect on in vivo therapy. Actually, compared to Taxotere®, the AUC0–t and AUC0–∞ of the DTX/HA–QU PMs were increased by 2.97-fold and 3.0-fold, respectively.
image file: c6ra00460a-f8.tif
Fig. 8 Concentration–time curves of DTX in SD rat plasma after intravenous administration of Taxotere® or DTX/HA–QU PMs at DTX dose of 10 mg kg−1. Data is presented as mean ± SD (n = 5).
Table 1 Main pharmacokinetic parameters of DTX after intravenous administration of Taxotere® or DTX/HA–QU PMs at DTX dose of 10 mg kg−1. Data was given as the mean ± SD (n = 5)
Parameters Units Formulations
Taxotere® DTX/HA–QU PMs
a Half time.b Area under the curve from zero to the last measured sampling time point.c Area under the curve from zero to infinity;d Mean residence time;e Clearance.f P < 0.01, vs. Taxotere®.
t1/2a h 2.64 ± 0.41 14.57 ± 3.22f
AUC0–tb μg h mL−1 5.92 ± 0.61 17.61 ± 2.89f
AUC0–∞c μg h mL−1 6.08 ± 0.68 18.30 ± 3.07f
MRTd h 0.68 ± 0.13 2.72 ± 1.52f
CLe L (kg−1 h−1) 1.64 ± 0.23 0.55 ± 0.14f


The intrinsic properties of DTX, such as lower molecular weight, smaller size and poor water solubility, would facilitate glomerular filtration and decrease renal tubular reabsorption through the kidneys, inducing faster clearance from body.5,59 However, the long-circulation behavior of DTX/HA–QU PMs in the blood circulation might be attributed to the suitable particle size and hydrophilic shell of HA as well as the relatively good stability, which would reduce the absorption by plasma proteins and uptake by the RES. The prolonged circulation time is the essential driving force for increased tumor targeting efficiency,59 thus the DTX/HA–QU PMs were proposed to display enhanced in vivo therapeutic efficacy.

In vivo imaging study

One of the limitations in clinical application of DTX in patients with advanced HC is its lack of selectivity for tumor cells. To evaluate the tumor targeting efficiency and distribution behavior of the HA–QU PMs, the in vivo fluorescent images of Heps tumor-bearing mice were observed by a non-invasive near-infrared optical imaging technique after intravenous administration of the DiR/HA–QU PMs, and free DiR as a control. As shown in Fig. 9A, a stronger fluorescence signal was clearly observed in the tumor region at 2 h post-injection in the DiR/HA–QU PMs group, and remained at a high level for up to 24 h. In contrast, the fluorescence signal in the whole bodies of the mice markedly decreased at the 24 h point. More importantly, the fluorescence intensity at the tumor site in the DiR/HA–QU PMs group was higher than with free DiR at all investigated time points. In addition, ex vivo imaging analysis of harvested tumors and normal tissues from the euthanised mice after 24 h post-injection was performed. The DiR/HA–QU PMs group showed a remarkably stronger fluorescence signal in tumor and liver tissue than with free DiR, especially in the tumor (Fig. 9B); the fluorescence intensity using quantitative region-of-interest analysis showed approximately 5-fold and 1.8-fold increases compared to free DiR (Fig. 9C), respectively. It was also found that the DiR/HA–QU PMs preferred to distribute in the tumor, but free DiR liked to accumulate in the liver. These observations indicated that the HA–QU PMs did exhibit a highly selective accumulation at the tumor site in vivo. Moreover, it has been described that liver sinusoidal endothelial cells over-express another HA receptor for endocytosis (HARE),60 which might result in an increased fluorescence signal in the liver in the DiR/HA–QU PMs group. Therefore, HA–QU PMs might be suitable for specific delivery of DTX to HC, and could be expected to achieve a synergistic effect on in vivo efficacy.
image file: c6ra00460a-f9.tif
Fig. 9 In vivo tumor-targeting of HA–QU PMs. (A) In vivo fluorescence imaging of Heps tumor-bearing mice at 1, 2, 4, 6, 8, 12 and 24 h after intravenous injection of DiR/HA–QU PMs (1) and free DiR (2). Arrows indicate the tumor sites. (B) Ex vivo fluorescence imaging of tumor and normal tissues harvested from the euthanised Heps tumor-bearing mice treated with DiR/HA–QU PMs (a) and free DiR (b), at 24 h post injection. The numeric label for each organ is as follows: (1) heart; (2) liver; (3) spleen; (4) lung; (5) kidney; (6) tumor. (C) Region-of-interest analysis of fluorescent signal from the tumors and normal tissues (n = 3). **P < 0.01.

In vivo antitumor efficacy

Owing to the p-gp efflux effect and lack of tumor specificity, DTX showed unsatisfactory clinical efficacy in patients with advanced HC, although exhibiting potent in vitro antitumor efficacy on several HC cells.7–11 In the present study, DTX was physically encapsulated into HA–QU PMs to improve its in vivo antitumor efficacy. Fig. 10a shows the tumor growth curves of the negative control (saline), Taxotere®, HA–QU plus Taxotere® and DTX/HA–QU PMs groups. Compared to the saline group, the tumor volumes showed no significant difference after intravenous administration of Taxotere®. However, the DTX/HA–QU PMs were found to significantly reduce the tumor volumes of tumor-bearing mice after multiple-dose therapy, compared to Taxotere® (P < 0.01) and HA–QU plus Taxotere® (P < 0.05), indicating the highest antitumor efficacy in vivo. Meanwhile, HA–QU plus Taxotere® also showed a remarkable effect on tumor suppression in comparison to Taxotere® (P < 0.05), indicating that HA–QU could enhance the antitumor efficacy of DTX by some specific mechanism which was independent of the encapsulation of nanoparticles. This mechanism might be attributed to the QU-based inhibition of p-gp mediated drug efflux.
image file: c6ra00460a-f10.tif
Fig. 10 In vivo anticancer activity assays. (a) Tumor growth curves of tumor-bearing mice treated with different formulations. (b) The body weight variation of tumor-bearing mice after various formulations were given. Data was given as the mean ± SD (n = 6). (c) Histological studies of tumor tissues after treatment by H&E and TUNEL assay staining. (d) The percentage of apoptotic cells calculated according to TUNEL (n = 6). *P < 0.05 and **P < 0.01.

The same phenomenon was observed in tumor weight after multiple-dose therapy (as shown in Table 2). The calculated tumor inhibition ratios of Taxotere®, HA–QU plus Taxotere® and DTX/HA–QU PMs were 18.26%, 35.65% and 73.91%, respectively (Table 2), further indicating that the DTX/HA–QU PMs exhibited much better antitumor efficacy than Taxotere® (P < 0.01) and HA–QU plus Taxotere® (P < 0.01).

Table 2 Tumor weight and tumor inhibition ratios observed in tumor-bearing mice treated with different formulations. Data is given as the mean ± SD (n = 6)
Groups Tumor weight (g) day 10 Inhibition ratio (%)
a P < 0.05 vs. Taxotere®.b P < 0.01 vs. Taxotere®.c P < 0.01 vs. HA–QU plus Taxotere®.
Saline 1.15 ± 0.22
Taxotere® 0.94 ± 0.11 18.26 ± 3.68
HA–QU plus Taxotere® 0.74 ± 0.10a 35.65 ± 4.51a
DTX/HA–QU PMs 0.30 ± 0.09b,c 73.91 ± 5.69b,c


The H&E staining histological images of the tumor sections excised from the tumor-bearing mice treated with the four formulations are displayed in Fig. 10c. The saline group showed the typical pathological features of tumor cells, such as large or closely arranged tumor cells, and its necrosis was minimal. However, it was demonstrated that tumor cells in the other three groups underwent necrosis in varying degrees. In particular, the DTX/HA–QU PMs group showed extensive tumor cell remission, such as nucleus fragmentation and coagulative necrosis. The TUNEL analysis also revealed that the DTX/HA–QU PMs group showed a dramatically increased percentage of apoptotic and necrotic tumor cells, and the apoptosis ratio was more than 70%, while those of Taxotere® and HA–QU plus Taxotere® were around 10.0% and 31.0%, respectively (Fig. 10c and d). These results also provided relevant evidence to verify the most efficient antitumor efficacy of the DTX/HA–QU PMs in vivo.

The powerful antitumor activity of the DTX/HA–QU PMs in vivo might be related to several factors. DTX/HA–QU PMs could improve the circulation time in the bloodstream and the biodistribution profile of DTX due to the suitable particle size and hydrophilic shell of HA, as well as the so-called EPR effect, thus resulting in a high accumulation at the tumor site.61 Secondly, compared to free DTX, DTX/HA–QU PMs could be efficiently internalised into tumor cells via HA-CD44 mediated endocytosis. Upon being internalised into tumor cells, the DTX/HA–QU PMs delivered and released two drugs. The released QU can further inhibit p-gp efflux by competitively combining with p-gp and down-regulating p-gp expression, thus increasing the DTX concentration accumulated in the tumor cells,27–29 which contributed to the good in vivo antitumor efficacy of DTX/HA–QU PMs. Likewise, QU can serve as a combination chemotherapy drug by changing the expression of apoptotic protein to induce apoptosis.62,63 It was reported that QU has antitumor activity and simultaneously protects normal cells.64 Thus, the p-gp inhibition and antitumor efficacy of QU might further enhance the antitumor effect of DTX.

The daily body weight and behavior of mice after treatment were monitored to investigate the potential toxicity of the DTX/HA–QU PMs. As shown in Fig. 10b, no notable body weight loss was found in the DTX/HA–QU PMs group in comparison with the saline group during the treatment, while the average body weight of the mice treated with Taxotere® or HA–QU plus Taxotere® was markedly decreased, which might be attributed to the DTX toxicity and side effects of Tween80. Meanwhile, the mice treated with Taxotere® or HA–QU plus Taxotere® showed symptoms of hair loss, food intake reduction, narrowed eyes and lethargy. In conclusion, the DTX/HA–QU PMs might be a promising system for HC treatment with the advantages of high therapeutic effect and low toxicity.

Western blot analysis

P-gp acts as a drug efflux pump to unilaterally transport intracellular drugs out of cells, thereby resulting in drug resistance of tumor cells and decreased therapeutic effect.65 In fact, in the intrinsic and acquired DTX resistance during HC therapy, p-gp is one of the most relevant and studied transporters. The over-expression of p-gp in HC cells reduces the intracellular drug concentration, which decreases the in vivo antitumor efficacy of chemotherapeutic agents. QU, as a p-gp blocker of natural origin, was reported to down-regulate the expression of p-gp or serve as a substrate, thereby causing competitive inhibition towards antitumor drugs in in vitro and in vivo models.66,67

To investigate whether DTX/HA–QU PMs can inhibit p-gp expression in tumor cells in vivo, a western-blot assay was performed to examine the level of p-gp expression. Fig. 11a displays the western blot profiles of saline, Taxotere®, HA–QU plus Taxotere® and DTX/HA–QU PMs. The saline and DTX groups showed no obvious inhibition of p-gp expression. Moreover, as expected, the expression of p-gp in both the HA–QU plus Taxotere® and DTX/HA–QU PMs groups was dramatically down-regulated, and the optical density ratios (p-gp/actin) were 2.3-fold and 5.2-fold decreased compared to Taxotere®, respectively (Fig. 11b). In particular, the DTX/HA–QU PMs achieved a 2.2-fold greater down-regulation effect on p-gp functional expression than HA–QU plus Taxotere®. Such results indicated that DTX/HA–QU PMs exhibited a much better p-gp inhibitory property than Taxotere® and HA–QU plus Taxotere®. As discussed above, the remarkable enhancement of in vivo antitumor efficacy in the HA–QU plus Taxotere® and DTX/HA–QU PMs groups might be partially ascribed to the inhibition of p-gp mediated efflux. Moreover, it has been also reported that the inhibition of p-gp expression by QU is dose-dependent.27,28 In this study, owing to the relative particle size and intact PM structure of the DTX/HA–QU PMs,68,69 which might be more efficiently internalized into tumor cells, resulting in a high concentration of QU in tumor cells, thereby caused a higher p-gp inhibition effect. Overall, the QU-mediated p-gp inhibitory property plays a key role in the DTX efflux suppression in tumor cells and enhanced antitumor efficacy of DTX/HA–QU PMs in vivo.


image file: c6ra00460a-f11.tif
Fig. 11 Expression of p-gp in tumor cells. (a) Western blot analysis of p-gp expression in tumor cells. (b) The optical density ratios (p-gp/actin) of different groups; actin was utilised to normalise the p-gp expression data. Data is presented as the mean ± SD (n = 3). **P < 0.01.

Conclusions

In this study, we developed a novel targeted drug delivery nanosystem based on HA and QU for improving the in vivo therapeutic efficacy of DTX towards HC. Not only did the nanosystem facilitate cellular uptake via HA-CD44 receptor-mediated endocytosis, but it also preferentially accumulated at the tumor site via the EPR effect, thereby causing high antitumor efficacy in vivo. Moreover, the DTX/HA–QU PMs showed prolonged circulation time and high stability in the bloodstream due to the suitable particle size and the hydrophilic shell of HA. Indeed, DTX/HA–QU PMs exhibited much higher cytotoxicity in vitro and antitumor efficacy in vivo, with less toxicity compared to Taxotere®. Meanwhile, the DTX/HA–QU PMs could downregulate the p-gp expression in tumor cells, caused by the hydrophobic core of QU. In conclusion, our results suggested that the HC-targeted DTX delivery system including a p-gp efflux inhibition effect is indeed a prominent strategy for HC treatment in the future.

Acknowledgements

This project was supported by the National Natural Science Foundation of China (No. 81173006), the 12th of Six Talent Peak Foundation of Jiangsu Province (YY-001), the Jiangsu Natural Science Foundation of China (BK20131312), and the Project Program of State Key Laboratory of Natural Medicines, China Pharmaceutical University (JKGQ201107). It was also sponsored by Qing Lan Project.

Notes and references

  1. J. M. Llovet, A. Burroughs and J. Bruix, Lancet, 2003, 362, 1907–1917 CrossRef.
  2. A. Hollebecque, D. Malka, C. Ferté, M. Ducreux and V. Boige, Eur. J. Cancer, 2015, 51, 327–339 CrossRef PubMed.
  3. L. X. Qin and Z. Y. Tang, World J. Gastroenterol., 2002, 8, 193–199 Search PubMed.
  4. M. C. Bissery, Eur. J. Cancer, 1995, 31(4), S1–S6 CrossRef.
  5. S. Jones, Eur. J. Cancer Suppl., 2006, 4(4), 4–8 CrossRef CAS.
  6. L. Zhao, Y. M. Wei, X. D. Zhong, Y. Liang, X. M. Zhang, W. Li, B. B. Li, Y. Wang and Y. Yu, J. Pharm. Biomed. Anal., 2009, 49, 989–996 CrossRef CAS PubMed.
  7. C. X. Geng, Z. C. Zeng and J. Y. Wang, World J. Gastroenterol., 2003, 9, 696–700 CrossRef CAS PubMed.
  8. H. L. Lin, T. Y. Liu, G. Y. Chau, W. Y. Lui and C. W. Chi, Cancer, 2000, 89, 983–994 CrossRef CAS PubMed.
  9. M. Hebbar, O. Ernst, S. Cattan, S. Dominguez, C. Oprea, P. Mathurin, J. P. Triboulet, J. C. Paris and F. R. Pruvo, Oncology, 2006, 70, 154–158 CrossRef CAS PubMed.
  10. Z. H. Xu, L. L. Chen, W. W. Gu, Y. Gao, L. P. Lin, Z. W. Zhang, Y. Xi and Y. P. Li, Biomaterials, 2009, 30, 226–232 CrossRef CAS PubMed.
  11. Z. H. Xu, Z. W. Zhang, Y. Chen, L. L. Chen, L. P. Lin and Y. P. Li, Biomaterials, 2010, 31, 916–922 CrossRef CAS PubMed.
  12. K. Klappe, I. Hummel, D. Hoekstra and J. W. Kok, Chem. Phys. Lipids, 2009, 161, 57–64 CrossRef CAS PubMed.
  13. B. Liu, E. Staren, T. Iwamura, H. Appert and J. Howard, J. Surg. Res., 2001, 99(1), 179–186 CrossRef CAS PubMed.
  14. M. H. Dufresne, D. L. Garrec, V. Sant, J. C. Leroux and M. Ranger, Int. J. Pharm., 2004, 277(1–2), 81–90 CrossRef CAS PubMed.
  15. Y. Yammoto, Y. Nagasaki, Y. Kato, Y. Sugiyama and K. Kataoka, J. Controlled Release, 2001, 77(1–2), 27–38 CrossRef.
  16. T. Kawaguchi, T. Honda, M. Nishihara, T. Yamamoto and M. J. Yokoyama, J. Controlled Release, 2009, 136, 240–246 CrossRef CAS PubMed.
  17. M. Talelli, M. Iman, A. K. Varkouhi, C. J. F. Rijcken, R. M. Schiffelers, T. Etrych, K. Ulbrich, C. F. van Nostrum, T. Lammers, G. Storm and W. E. Hennink, Biomaterials, 2010, 31, 7797–7804 CrossRef CAS PubMed.
  18. X. Y. Wang, Y. H. Chen, F. Z. Dahmani, J. P. Zhou and J. Yao, Biomaterials, 2014, 35, 7654–7665 CrossRef CAS PubMed.
  19. T. Woraphatphadung, W. Sajomsang, P. Gonil, S. Saesoo and P. Opanasopit, Carbohydr. Polym., 2015, 121, 99–106 CrossRef CAS PubMed.
  20. V. M. Platt and F. C. Szoka, Mol. Pharm., 2008, 5, 474–486 CrossRef CAS PubMed.
  21. D. Coradini, S. Zorzet, R. Rossin, I. Scarlata, C. Pellizzaro, C. Turrin, M. Bello, S. Cantoni, A. Speranza, G. Sava, U. Mazzi and A. Perbellini, Clin. Cancer Res., 2004, 10, 4822–4830 CrossRef CAS PubMed.
  22. P. C. Hollman and M. B. Katan, Free Radical Res., 1999, 31, 75–80 CrossRef.
  23. I. Erlund, Nutr. Res., 2004, 24, 851–874 CrossRef CAS.
  24. W. F. Tan, L. P. Lin, M. H. Li, Y. X. Zhang, Y. G. Tong and D. Xiao, Eur. J. Pharmacol., 2003, 459, 255–262 CrossRef CAS PubMed.
  25. T. Bu, Y. Mi, W. Zeng and C. Zhang, Anat. Rec., 2011, 294, 520–526 CrossRef CAS PubMed.
  26. A. B. Shapiro and V. Ling, Eur. J. Biochem., 1997, 250(1), 122–129 CAS.
  27. P. Limtrakul, O. Khantamat and K. Pintha, J. Chemother., 2005, 17(1), 86–95 CrossRef CAS PubMed.
  28. S. H. Kim, A. S. Yeo, Y. S. Lim, C. D. Kang, C. M. Kim and B. S. Chung, Exp. Mol. Med., 1998, 30(2), 87–92 CrossRef CAS PubMed.
  29. J. C. Lim, K. D. Kania, H. Wijesuriya, S. Chawla, J. K. Sethi, L. Pulaski, I. A. Romero, P. O. Couraud, B. B. Weksler, S. B. Hladky and M. A. Barrand, J. Neurochem., 2008, 106(4), 1855–1865 CAS.
  30. R. Duncan, Adv. Drug Delivery Rev., 2009, 61, 1131–1148 CrossRef CAS PubMed.
  31. P. Xin, L. Zhen, H. Du, X. Yang and G. Zhai, Colloids Surf., B, 2014, 123, 778–786 CrossRef PubMed.
  32. Y. Yang, J. X. Aw, K. Chen, F. Liu, P. Padmanabhan, Y. L. Hou, Z. Cheng and B. Xing, Chem.–Asian J., 2011, 6, 1381–1389 CrossRef CAS PubMed.
  33. O. H. Lowry, N. J. Rosebrough, A. L. Farr and R. J. Randall, J. Biol. Chem., 1951, 193, 265–275 CAS.
  34. S. Kitagawa, T. Nabekura, T. Takahashi, Y. Nakamura, H. Sakamoto, H. Tano, M. Hirai and G. Tsukahara, Biol. Pharm. Bull., 2005, 28(12), 2274–2278 CAS.
  35. T. J. Mabry, K. R. Markham and M. B. Thomas, J. Mol. Struct., 1971, 10(2), 320 CrossRef.
  36. K. R. Markham and T. J. Mabry, Ultraviolet-Visible and Proton Magnetic Resonance Spectroscopy of Flavonoids, Springer, US, 1975 Search PubMed.
  37. M. Katyal and K. C. Trikha, Talanta, 1968, 15(1), 95–106 CrossRef CAS PubMed.
  38. T. A. Geissman, Arch. Biochem. Biophys., 1965, 111(2), 483–484 CrossRef.
  39. J. N. Phillips, Trans. Faraday Soc., 1995, 51, 561–569 RSC.
  40. M. P. Vinardell and M. R. Infante, Comp. Biochem. Physiol., Part C: Pharmacol., Toxicol. Endocrinol., 1999, 124, 117–120 CrossRef CAS.
  41. L. Wang, R. Zeng, C. Li and R. Qiao, Colloids Surf., B, 2009, 74, 284–292 CrossRef CAS PubMed.
  42. L. Hou, Y. Fan, J. Yao, J. P. Zhou, C. C. Li, Z. J. Fang and Q. Zhang, Carbohydr. Polym., 2011, 86, 1157–1166 CrossRef CAS.
  43. H. Choi, W. Liu, P. Misra, E. Tanaka, J. P. Zimmer, B. I. Ipe, M. G. Bawendi and J. V. Frangioni, Nat. Biotechnol., 2007, 25, 1165–1170 CrossRef CAS PubMed.
  44. K. Miyata, R. J. Christie and K. Kataoka, React. Funct. Polym., 2011, 71, 227–234 CrossRef CAS.
  45. S. K. Hobbs, W. L. Monsky, F. Yuan, W. G. Roberts, L. Griffith and V. P. Torchilin, Proc. Natl. Acad. Sci. U. S. A., 1998, 95, 4607–4612 CrossRef CAS.
  46. Y. Liu, J. Sun, W. Cao, J. Yang, H. Lian, X. Li, Y. H. Sun, Y. J. Wang and Z. J. Hua, Int. J. Pharm., 2011, 421, 160–169 CrossRef CAS PubMed.
  47. C. J. Rijcken, O. Soga, W. E. Hennink and C. F. van Nostrum, J. Controlled Release, 2007, 120(3), 131–148 CrossRef CAS PubMed.
  48. S. Sakuma, T. Yano, Y. Masaoka, M. Kataoka, K. Hiwatrari, H. Tachikawa, Y. Shoji, R. Kimura, H. Ma, Z. J. Yang, L. Tang, R. M. Hoffman and S. J. Yamashita, J. Controlled Release, 2009, 134(1), 2–10 CrossRef CAS PubMed.
  49. J. Pan and S. S. Feng, Biomaterials, 2008, 29(17), 2663–2672 CrossRef CAS PubMed.
  50. K. Endo and K. T. Terada, J. Hepatol., 2000, 32, 78–84 CrossRef CAS PubMed.
  51. V. M. Platt and J. F. C. Szoka, Mol. Pharm., 2008, 5, 474–486 CrossRef CAS PubMed.
  52. F. Gueritte-Voegelein, D. Guenard, F. Lavelle, M. T. Le Goff, L. Mangatal and P. Potier, J. Med. Chem., 1991, 34, 992–998 CrossRef CAS PubMed.
  53. H. J. Cho, H. Y. Yoon, H. Koo, S. H. Ko, J. S. Shim, J. H. Lee, K. Kim, I. C. Kwon and D. D. Kim, Biomaterials, 2011, 32, 7181–7190 CrossRef CAS PubMed.
  54. K. H. Min, K. Park, Y. S. Kim, S. M. Bae, S. Lee, H. G. Jo, R. W. Park, I. S. Kim, S. Y. Jeong, K. Kim and I. C. Kwon, J. Controlled Release, 2008, 127, 208–218 CrossRef CAS PubMed.
  55. K. Park, G. Y. Lee, Y. S. Kim, M. Yu, R. W. Park, I. S. Kim, S. Y. Kim and Y. Byun, J. Controlled Release, 2006, 114, 300–306 CrossRef CAS PubMed.
  56. J. Yao, L. Zhang, J. P. Zhou, H. Liu and Q. Zhang, Mol. Pharm., 2013, 10(3), 1080–1091 CrossRef CAS PubMed.
  57. T. Zhang, H. Xiong, F. Z. Dahmani, L. Sun, Y. Li, L. Yao, J. P. Zhou and J. Yao, Nanotechnology, 2015, 26, 145101–145117 CrossRef PubMed.
  58. C. K. Young, M. K. Hyun, Y. H. Yeol, K. Kim, J. H. Park, I. C. Kwon, K. Choi and S. Y. Jeong, Biomaterials, 2011, 32(7), 1880–1889 CrossRef PubMed.
  59. L. Seymour, Y. Miyamoto, H. Maeda, M. Brereton, J. Strohalm, K. Ulbrich and R. Duncan, Eur. J. Cancer, 1995, 31, 766–770 CrossRef.
  60. K. Y. Choi, G. Saravanakumar, J. H. Park and K. Park, Colloids Surf., B, 2012, 99, 82–94 CrossRef CAS PubMed.
  61. F. Mathot, L. van Beijsterveldt, V. Preat, M. Brewster and A. Arien, J. Controlled Release, 2006, 111, 47–55 CrossRef CAS PubMed.
  62. P. Wang, K. Zhang, Q. Zhang, J. Mei, C. J. Chen, Z. Z. Feng and D. H. Yu, Toxicol. In Vitro, 2012, 26, 221–228 CrossRef CAS PubMed.
  63. J. M. Gee, H. Hara and I. T. Johnson, Nutr. Cancer, 2002, 43, 193–201 CrossRef CAS PubMed.
  64. M. Russo, C. Spagnuolo, I. Tedesco, S. Bilotto and G. L. Russo, Biochem. Pharmacol., 2012, 83, 6–15 CrossRef CAS PubMed.
  65. A. Cambón, J. Brea, M. I. Loza, C. L. Alvarez, A. Concheiro, S. Barbosa, P. Taboada and V. Mosquera, Mol. Pharm., 2013, 10, 3232–3241 CrossRef PubMed.
  66. J. Jakubowicz-Gil, R. Paduch, T. Piersiak, K. Głowniak, A. Gawron and M. Kandefer-Szerszeń, Biochem. Pharmacol., 2005, 69(9), 1343–1350 CrossRef CAS PubMed.
  67. X. G. Li and J. S. Choi, Anticancer Res., 2009, 29(4), 1411–1415 CAS.
  68. K. Miyata, R. J. Christie and K. Kataoka, React. Funct. Polym., 2011, 71, 227–234 CrossRef CAS.
  69. C. He, Y. Hu, L. Yin, C. Tang and C. Yin, Biomaterials, 2010, 31, 3657–3666 CrossRef CAS PubMed.

Footnote

Electronic supplementary information (ESI) available. See DOI: 10.1039/c6ra00460a

This journal is © The Royal Society of Chemistry 2016
Click here to see how this site uses Cookies. View our privacy policy here.