DOI:
10.1039/C6RA00353B
(Paper)
RSC Adv., 2016,
6, 41294-41303
Synthesis of porphyrin sensitizers with a thiazole group as an efficient π-spacer: potential application in dye-sensitized solar cells†
Received
6th January 2016
, Accepted 18th April 2016
First published on 20th April 2016
Abstract
Herein, we report porphyrin sensitizers for DSSCs, coded CNU-OC8 and CNU-TBU, which were synthesized using a donor–π-bridge–acceptor approach. The porphyrin sensitizers were subjected to electrochemical experiments to study their electron distribution, intramolecular charge transfer and HOMO–LUMO levels. The optical and photovoltaic properties of these synthesized porphyrins were measured and compared with those of the YD2-OC8 benchmark dye. To further characterize, we simulated the electrochemical and optical properties of the dyes, which are perfectly in agreement with the experimental data. The new CNU-OC8 and CNU-TBU porphyrin sensitizers provided power conversion efficiencies of 6.49% and 3.19%, respectively, compared to a conversion efficiency of 6.10% for YD2-OC8 under similar conditions. These results indicate that CNU-OC8 exhibits better photovoltaic performance than the benchmark YD2-OC8 sensitizer in a liquid I−/I3− redox electrolyte.
Introduction
Dye-sensitized solar cells (DSSCs) are fascinating and of extensive interest for the conversion of sunlight into electricity because of their low cost, high conversion efficiency, colorful nature, ease of fabrication and potential usefulness in solving environmental problems.1–7 Dye-sensitized solar cells have garnered considerable attention since the first report of DSSCs by Grätzel and O'Regan in 1991.8 A highly efficient metal–organic dye based on a ruthenium (Ru) sensitizer has produced solar-energy-to-electricity conversion efficiencies (η) greater than 11% under illumination with standard AM 1.5 sunlight.9–11 Although Ru complexes are suitable as photosensitizers, because of their low molar extinction coefficient for incident light with wavelengths greater than 600 nm, the low natural abundance of Ru and related environmental issues limit their extensive application. On the other hand, porphyrin dyes shown high molar extinction coefficients and promising properties with easy synthetic conversion ability to be a good sensitizers for DSSCs.12–24
In general, the absorption spectra of porphyrin dyes show a Soret band (B-band) with strong absorption at 400–450 nm and low-intensity Q-bands at 500–650 nm; notably, the 500–800 nm region is the most intense, photon-rich wavelength region of sunlight. According to AM1.5G solar simulations, the expected current density between 400 and 900 nm is ∼7 mA cm−2 for every 100 nm, which represents a maximum cumulated Jsc value of ∼35 mA cm−2. Therefore, an ideal production of extreme photocurrent should be possible with dye that can absorb maximum sunlight in the range of 400–900 nm.
The first porphyrin used for the sensitization of nanocrystalline TiO2 was [tetrakis(4-carboxyphenyl)porphyrinato]zinc(II), with an overall conversion efficiency of 3.5%.25 Then, zinc porphyrin YD2-OC8 is co-sensitized with an Y123 using a cobalt-based electrolyte that reached a power conversion efficiency of 12.3%,14 SM315 has been demonstrated to exhibit a conversion efficiency of 13%.16 Recently, thiophene or furan,26,27 tropolone,28 and pyridine-based compounds29 have been used as acceptor anchoring groups with good conversion efficiency properties. Plater and coworkers synthesized the thiazole π-spacer porphyrin molecules,30 Jin Yong Lee and Karthikeyan given the theoretical calculations for thiazole spacer containing porphyrins.31 Thiazole is an electron deficiency unit with coplanarity and a significant electron-withdrawing ability. It has been widely applied in many fields, thiazole electron-deficiency is because it contains one electron-withdrawing nitrogen of the imine (–C
N) in place of the carbon atom at the 3-position of thiophene.32–35 Here in with the introduction of thiazole into the dyes as π-spacer, we planned the collaborative electron-withdrawing of thiazole and carboxylic acid may increase spectral response through lengthening π-conjugation and increasing the withdrawing nature, while maintaining good charge injection.36
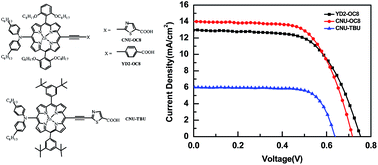
Finally based on the above consideration, we have designed and synthesized two new efficient porphyrin sensitizers (CNU-OC8 and CNU-TBU shown in Fig. 1, with diarylamine as the donor, thiazole as a π-spacer, and a carboxylic acid group acting as the anchoring group. Here, in the present manuscript, we further extend this strategy to describe the DSSC properties CNU-OC8 and CNU-TBU, which feature a thiazole carboxylic acid that acts as a good acceptor and anchoring group; additionally, we compare the performance of these compounds with that of the YD2-OC8 porphyrin dye (Fig. 1). We also performed theoretical calculations to verify the electrochemical and photophysical properties of the two dyes, CNU-OC8 and CNU-TBU.
 |
| Fig. 1 Molecular structures of the CNU-OC8, YD2-OC8, and CNU-TBU porphyrin dyes. | |
Experimental section
Materials and characterization
All solvents and reagents (analytical and spectroscopic grades) were commercially obtained and used as received unless otherwise noted. An AVANCE III 600 spectrometer was operated at 600 MHz for 1H NMR and 150 MHz for 13C NMR (Akishima, Japan); the Alice 4.0 software and CDCl3 and pyridine-d5 (Sigma-Aldrich) were used as solvents in both cases. The chemical shifts (δ values) are reported in ppm as downfield from an internal standard (Me4Si) (1H and 13C NMR). HRMS spectra were obtained using a micrOTOF-Q II mass spectrometer. UV-visible absorption spectra were recorded using an Agilent 8453 spectrophotometer. The electrochemical measurements, i.e., CV experiments, were conducted using a VersaSTAT 3 instrument. The electrolyte used was anhydrous methylene chloride along with 0.1 M TBAP as a supporting electrolyte. The electrodes used included a platinum disc as the working electrode, a Ag/Ag+ electrode as the reference electrode and platinum wire as the counter electrode.
Synthesis
Synthesis of CNU-OC8 (1). TIPS compound 4 (0.2 g, 0.128 mmol) was dissolved in 20 mL dry THF, and the resulting solution TBAF was added (0.16 mL, 1 M THF) at 0 °C. The reaction mixture was stirred for 15 min under inert atmosphere and subsequently quenched with 20 mL water and extracted with DCM (2 × 50 mL). The combined organic layers were dried over anhydrous Na2SO4. The solvent was removed under reduced pressure. To the obtained residual compound 2-bromothiazole-5-carboxylic acid (0.266 g, 1.28 mmol) was added and dissolved in dry THF (20 mL). NEt3 was then added to the reaction mixture (8 mL), which was subsequently degassed with Ar for 15 min. To the combined reaction mixture, Pd(dba)2 (0.044 g, 0.0768 mmol) and AsPh3 (0.137 g, 0.45 mmol) were added and refluxed for 12 h under an Ar atmosphere. After the reaction was completed, the solvent was removed under reduced pressure. The resulting residue was purified by silica-gel column chromatography using DCM
:
CH3OH (20
:
1) as the eluent to obtain a solid, which was further washed with CH3OH to give compound 1 (0.112 g, 57.81%) as a green solid. 1H NMR (600 MHz, CDCl3 + 1 drop pyridine-d5, ppm) δ 9.47 (d, J = 4.5 Hz, 2H), 8.94 (d, J = 4.7 Hz, 2H), 8.73 (d, J = 4.5 Hz, 2H), 8.51–8.48 (m, 2H), 6.98–6.83 (m, 10H), 6.78–6.66 (m, 5H), 3.73 (t, J = 4.8 Hz, 8H), 2.34 (t, J = 7.5 Hz, 4H), 1.51 (s, 4H), 1.46–0.29 (m, 78H). 13C NMR (125 MHz, CDCl3 + 1 drop pyridine-d5, ppm) δ 159.7, 152.1, 151.2, 150.2, 150.2, 134.7, 134.1, 132.1, 131.4, 130.2, 129.7, 129.5, 128.3, 123.3, 121.5, 114.3, 105.1, 100.1, 68.4, 45.2, 35.1, 32.0, 31.6, 31.3, 29.5, 29.2, 29.0, 28.5, 28.4, 25.0, 22.5, 22.4, 22.2, 13.9, 13.7. UV-vis [0.01 mM, λmax (nm) & ε (mol−1 cm−1)] 453 (2
05
842), 575 (14
495) and 650 (31.891). FT-IR (KBr) 3344, 3093, 2952, 2184, 1724, 1584, 1296, 1094, 933, 791, 713. HR-MS (ESI-MS) m/z calcd for C94H119N6O6SZn[M + H]+: 1524.8133, found 1524.8135.
Synthesis of CNU-TBU (2). TIPS compound 5 (0.2 g, 0.158 mmol) was taken in 20 mL THF and was added TBAF (0.16 mL, 1 M THF) at 0 °C. The reaction mixture was stirred for 15 min under inert atmosphere and subsequently quenched with 20 mL of water and extracted with DCM (2 × 50 mL). The combined organic layers were dried over anhydrous Na2SO4. The solvent was removed under reduced pressure. To the obtained residual compound, 2-bromothiazole-5-carboxylic acid (0.332 g, 1.6 mmol) was added and dissolved in dry THF (20 mL). NEt3 was then added to the reaction mixture (8 mL), which was subsequently degassed with Ar for 15 min. To the combined reaction mixture Pd(dba)2 (0.055 g, 0.095 mmol) and AsPh3 (0.169 g, 0.553 mmol) were added and refluxed for 12 h under an Ar atmosphere. The solvent was removed under reduced pressure after completion of the reaction. The resulting residue was purified by silica-gel column chromatography using DCM
:
CH3OH (20
:
1) as an eluent to obtain a solid, which was further recrystallized from CH3OH to give compound 2 (0.124 g, 63.29%) as a green solid. 1H NMR (600 MHz, CDCl3 + 1 drop pyridine-d5, ppm) δ 9.71 (d, J = 4.6 Hz, 2H), 9.23 (d, J = 4.6 Hz, 2H), 8.92 (d, J = 4.5 Hz, 2H), 8.74 (d, J = 4.5 Hz, 2H), 7.97 (s, 4H), 7.76 (s, 2H), 7.22–7.16 (m, 5H), 6.94 (d, J = 8.4 Hz, 4H), 2.46 (t, J = 7.5 Hz, 4H), 1.50 (s, 36H), 1.33–1.18 (m, 16H), 0.83 (t, J = 7.1 Hz, 6H). 13C NMR (125 MHz, CDCl3 + 1 drop pyridine-d5, ppm) δ 152.0, 151.8, 150.2, 149.9, 149.7, 148.1, 134.3, 133.0, 132.5, 130.4, 129.3, 128.4, 121.6, 120.4, 114.3, 105.1, 58.4, 45.2, 34.7, 34.5, 31.2, 31.0, 29.3, 28.6, 23.6, 22.1, 19.3, 13.6, 13.2. UV-vis [0.01 mM, λmax (nm) & ε (mol−1 cm−1)] 448 (2
11
388), 578 (12
711) and 655 (34
775). FT-IR (KBr) 3359, 3026, 2954, 2185, 1736, 1696, 1590, 1433, 1285, 1207, 1066, 946, 790, 727. HR-MS (ESI-MS) m/z calcd for C78H86N6O2SZn [M + H]+: 1235.5897, found 1235.5819.
Computational details
Density functional theory (DFT) and time dependent DFT (TDDFT) calculations were performed on both the Zn-porphyrin dyes CNU-OC8 and CNU-TBU. All the calculations reported in this paper were carried out with the Gaussian 09 ab initio quantum chemical program.37 The geometry optimization of the two dyes has been carried out using M06 (ref. 38) hybrid meta exchange correlation density functional at 6-31G(d,p) level of theory. We used, quasi-relativistic pseudo-potentials proposed by Hay and Wadt and a double zeta (ξ) quality basis set, LanL2DZ.5 (ref. 39–41) for Zn throughout. During the geometry optimization, we did not impose any symmetry constraints. The frequency analysis was carried out on optimized geometries to ensure that each configuration is indeed a minimum on the potential energy surface. To model the CNU-OC8 dye, we have replaced the –OC8H17 groups present on the two phenyl rings with simple –OCH3 for computational simplicity. The other dye CNU-TBU has been modeled as such without any modifications. We obtained the electron density distribution isosurfaces of the two dyes, by performing population analysis in dichloromethane solvent medium. To characterize the photophysical properties of the two Zn-porphyrin dyes, we performed TDDFT simulations on the ground state optimized structures. The vertical excitation energies of the two dyes for the first 25 vertical singlet excitations were calculated in tetrahydrofuran solvent medium. The solvent effects of dichloromethane and tetrahydrofuran were modeled using the polarizable continuum model42,43 within the self-consistent reaction field (SCRF) theory.
Procedure for the preparation of the porphyrin-modified TiO2 electrode and for photovoltaic measurements
Transparent conducting glass substrates were cleaned sequentially with ethanol, isopropanol and acetone with ultrasonication. A TiO2 paste was prepared using ethyl cellulose (Aldrich), lauric acid (Fluka) and terpineol (Aldrich). The TiO2 particles used were ca. 20–30 nm in diameter. A prepared TiO2 paste was doctor-bladed onto the pre-cleaned glass substrates, followed by drying at 70 °C for 30 min and 30 min calcination at 500 °C. The calculated thickness is 8 μm. A scattering layer consisting of rutile TiO2 particles (250 nm in a size) was deposited on the mesoporous TiO2 films and thickness is was 14 μm. The sensitizers were dissolved in ethanol (4)
:
THF (1) (0.3 mM) with 0.4 mM chenodeoxycholic acid at room temperature and stirred for 24 h. The TiO2 layers were immersed in the solutions for 24 h.
Pt counter electrodes were prepared by thermal reduction of the films dip-coated in H2PtCl6 (7 × 10⁻³ M) in 2-propanol at 400 °C for 20 min. The dye-adsorbed TiO2 and Pt counter electrodes were sandwiched between a 60 μm-thick Surlyn (Solaronix) layer, which was used as a bonding agent and spacer. A liquid electrolyte (I−/I3− redox couple) which was composed of 0.6 M BMII, 0.03 M I2, 0.5 M TBP, 0.05 M LiI, 0.05 M GuSCN in acetonitrile was then introduced through a pre-punched hole on the Pt counter electrode that was finally sealed. The active area of the dye-adsorbed TiO2 films (0.24 cm2) was estimated using a digital microscope camera with image-analysis-software (Moticam 1000). Electrical impedance spectra were obtained using an impedance analyzer (Solartron 1287) at frequencies ranging from 0.01 Hz to 1 MHz, the magnitude of the signal was 10 mV. The photocurrent–voltage measurement was performed using a Keithley model 2400 Source Meter and a YAMASHITA solar simulator system (equipped with a 1 kW xenon arc lamp, Oriel). A Si solar cell calibrated by the National Renewable Energy Laboratory (NREL) was used to adjust light intensity to the AM 1.5G 1 sun condition (100 mW cm−2) with KG-3 filter. A black aperture mask was attached on the cells during the measurements. Incident photon-to-current conversion efficiency (IPCE) was measured as a function of wavelength ranging from 300 to 900 nm using a K3100 EQX Spectral IPCE measurement system for DSSCs (PV measurements, Inc.). A 75 W xenon lamp was used as a light source for generating monochromatic beam. An ellipsoidal reflector collects light from the lamp and focuses on the monochromatic entrance slit via a mechanical chopper to create a small modulated signal. While the modulated, monochromatic light was applied to the test devices, a continuous bias light (ca. 1 sun) was also applied.
Results and discussion
Synthesis of dyes 1 and 2
We synthesized new porphyrin sensitizers based on the donor–π–acceptor concept. The synthetic protocol for the preparation of the target dyes CNU-TBU and CNU-OC8 is shown in Fig. 2. Both compounds 4 and 5 were synthesized by adopting the literature-reported procedure.14 Compounds 4 and 5 were first silyl deprotected with TBAF in THF to obtain a common intermediate compound that was Sonogashira coupled with Pd(dba)2, AsPh3, Et3N and THF. For the synthesis of compound 1 and 2 we initially tried the reaction with 0.3 equiv. of Pd2(dba)3 and 2 equiv. of AsPh3 according to previous methods,14,26 but reaction yield was very low. We subsequently obtained a good yield upon changing the reaction conditions to 0.6 equiv. of Pd(dba)2 and 3.5 equiv. of AsPh3. The YD2-OC8 was obtained using a previously reported synthesis procedure.14 Finally synthesized porphyrin sensitizers were fully characterized by 1H NMR, 13C NMR, IR, emission, and UV-visible absorption spectroscopies as well as by high resolution mass spectrometry and electrochemical methods.
 |
| Fig. 2 Synthesis strategies for the preparation of the new porphyrin dyes 1 and 2. | |
Absorption and emission studies
The UV-visible absorption spectra of porphyrin dyes CNU-OC8, CNU-TBU and YD2-OC8 in THF solution are displayed in Fig. 3. The corresponding wavelengths of maximum absorption and the molar extinction coefficients of all of the compounds are given in Table 1. The spectra of the dyes exhibit a characteristic intense Soret band in the range of 400–500 nm; this band is assigned to the second excited state. They also exhibit less intense Q-bands in the range from 550 to 700 nm; these bands are assigned to the first excited states that belong to π–π* electron transitions. The Soret bands of the CNU-OC8 and CNU-TBU are red-shifted by 5–10 nm from that of the YD2-OC8 dye. The dyes containing thiazole group as π-spacers exhibited red-shifts of their absorption bands; this result confirms that the thiazole group attached to the porphyrin cycles improve the UV-visible absorption characteristics of the porphyrin dyes. This enhancement is likely due to the greater electron-withdrawing nature of the thiazole group compared to that of a benzene group.
 |
| Fig. 3 UV-vis absorption spectra of CNU-OC8, YD2-OC8 and CNU-TBU in THF (0.01 mM). | |
Table 1 Absorption, fluorescence, and electrochemical data for porphyrin sensitizers
Dye |
Absorption (neutral form)a λmax (cm−1), (log ε) |
Emissionb λmax nm (ϕ) |
Potential V vs. SCEc |
HOMO (eV) |
LUMO (eV) |
EEcg (eV) |
Oxidation |
Reduction |
Absorption data were measured in THF at 25 °C (0.01 mM); error limits: λmax, ±1 nm, ε ± 10%. Emission data were measured in THF at 25 °C (0.01 mM); error limits: λmax, ±1 nm, ε ± 10%. Solvent: CH2Cl2, 0.1 M TBAP, scan rate: 50 mV s−1, Pt working electrode, Ag/Ag+ as reference electrode and Pt wire as counter electrode. |
CNU-OC8 |
453(205), 575(14), 649(32) |
675 |
+0.571, +1.169 |
−1.280 |
−5.514 |
−3.511 |
2.003 |
CNU-TBU |
448(211), 578(13), 650(34) |
700 |
+0.591, +1.158 |
−1.231 |
−5.474 |
−3.602 |
1.872 |
YD2-OC8 |
446(212), 580(12), 643(31) |
663 |
+0.620, +1.189 |
−1.351 |
−5.483 |
−3.592 |
1.891 |
The emission spectra of porphyrin sensitizers were measured at room temperature in THF solvent; representative spectra of the compounds are given in Fig. 4, and the corresponding emission maxima are reported in Table 1. The fluorescence emission wavelengths of CNU-OC8, CNU-TBU, and YD2-OC8 are 675, 700, and 663 nm, respectively. The red shift of the emission values of the present dyes compared to the emission of YD2-OC8 can be explained by the fact that the phenyl group of YD2-OC8 was replaced with a thiazole group in CNU-OC8 and CNU-TBU.
 |
| Fig. 4 Emission spectra of CNU-OC8 (λex = 570), YD2-OC8 (λex = 590) and CNU-TBU (λex = 580) in THF. | |
Electrochemical characteristics
Cyclic voltammetry studies. The electrochemical properties of the CNU-OC8, YD2-OC8 and CNU-TBU dyes were investigated by cyclic voltammetry experiments in dichloromethane in the presence of 0.1 M tetrabutylammonium perchlorate as a supporting electrolyte at 18 °C. All three dyes have quasi-reversible or reversible redox voltammograms (Fig. 5). The corresponding oxidation and reduction potentials are given in Table 1. All the oxidation peaks correspond to the abstraction of electrons from the amino functional groups and porphyrin ring.44,45 Similarly, all the reduction peaks correspond to the reduction of acceptors and/or the formation of di-anions and zinc porphyrin anions.44 The HOMO and LUMO energy levels were calculated by using the following equations: HOMO = −[4.8 + Eonsetox] eV and LUMO = −[4.8 + Eonsetred] eV, respectively (vs. Fc+/Fc).46 The corresponding HOMO, LUMO and electrochemical energy gaps (EECg) of the three dyes are given in Table 1. The sensitizers energy gap values have an important role in DSSCs.47 Here the electrochemical energy gap values of CNU-TBU, CNU-OC8 and YD2-OC8 are 1.872, 2.003, and 1.891 eV respectively.
 |
| Fig. 5 Cyclic voltammograms of YD2-OC8, CNU-OC8 and CNU-TBU dyes. CV measurements were carried out in DCM containing 0.1 M tetrabutylammonium perchlorate. Scan rate: 50 mV s−1 at 18 °C. | |
Electrochemical impedance spectroscopy. Electrochemical impedance spectroscopy (EIS) was performed using an electronic-chemical analyzer (Solartron 1287), in order to investigate and elucidate electrochemical characteristics and to get more information about interfacial charge transfer at the interfaces of DSSC with the CNU-OC8, YD2-OC8 and CNU-TBU dyes absorbed on TiO2. The Nyquist plots of the above dyes were shown in Fig. 6 and fitting values was shown in Table 2. The first semicircle in the above figure obtained is assigned to resistance (RPt) and capacitance (CPt) mainly obtained for charge transport at the electrolyte/Pt counter electrode interface. In the middle frequency range, the large semicircle is assigned to the charge transfer resistance (Rct) and chemical capacitance (Cct) related to charge recombination at the working electrode/electrolyte interface.48,49 This semicircle result from interface of electrolyte/dye absorbed TiO2 is in the order of YD2-OC8 > CNU-OC8 = CNU-TBU. These results clearly indicate that the electron recombination resistance of these three dyes that affects open circuit voltage determined by the potential difference between the quasi-Fermi level of TiO2 affected by the specific internal donors present and the redox potential of the electrolyte. This results also suggests shift of TiO2 conduction band edge in the order of YD2-OC8 > CNU-OC8 > CNU-TBU that affects electron injection related to current density from driving force between TiO2 conduction band edge and LUMO of each dye. So CNU-OC8 has higher current density and higher efficiency than YD2-OC8 due to lower conduction band edge than YD2-OC8 although CNU-OC8 has lower open circuit voltage than YD2-OC8. CNU-TBU has lowest conduction band edge that has an effect on lowest voltage.50–55
 |
| Fig. 6 Electrochemical impedance spectroscopy results (Nyquist plots) for DSSCs with CNU-OC8, YD2-OC8 and CNU-TBU dyes as sensitizers. | |
Table 2 Resistance extracted from the fitted results of the EIS spectra
|
Rs (Ω) |
RPt (Ω) |
Rct (Ω) |
CPt (μF cm−2) |
Cct (μF cm−2) |
YD2-OC8 |
1.428 |
3.23 |
446.2 |
136.83 |
1013.8 |
CNU-OC8 |
1.363 |
2.117 |
13.45 |
87.41 |
1520.1 |
CNU-TBU |
1.316 |
1.949 |
13.62 |
88.93 |
1734.6 |
Computational studies. To gain further insights into the geometry, electronic structure, and optical properties of the two Zn-porphyrin dyes, we have carried out thorough DFT and TDDFT calculations. The ground sate optimized geometries of the dyes are shown in Fig. 7. The two phenyl rings directly attached to the porphyrin ring are perpendicular to the porphyrin ring, whereas the other two phenyl rings present in the donor part, are with a dihedral angle of ca. 30°. The non-planar geometry of the dyes helps in preventing the dye aggregation on TiO2.
 |
| Fig. 7 Optimized ground state (S0) geometries of CNU-OC8 and CNU-TBU obtained at M06/6-31G(d,p)/LanL2DZ level of theory. Hydrogen atoms are omitted here for clarity. | |
The isodensity surface plots (isodensity contour: 0.02 e Å−3) of selected molecular orbitals are shown in Fig. 8. From the figure, it can be seen that, the electron density distribution pattern of both the dyes is almost similar. In the HOMO−1, the electron density is mainly delocalized over porphyrin ring but in the HOMO, the majority of the electron density is delocalized over donor and porphyrin and also partly extended to the thiazole. In the case of LUMO, the electron density is regeneration depends on the energy levels of the frontier molecular orbitals, they are of great interest in the context of DSSC. The calculated molecular orbital energy levels are given in Table 3. The simulated HOMO energies of CNU-OC8 and CNU-TBU are −5.25 and −5.29 eV, respectively. The TDDFT first transition energy (S0 → S1) is considered as the optical bandgap of the dyes, which are found to be 1.87 and 1.84 eV, respectively for CNU-OC8 and CNU-TBU. In the present study, we calculated the LUMO energy by taking the sum of HOMO energy and the TDDFT transition energy, rather than from the unreliable Kohn–Sham LUMO eigenvalue.56 The obtained LUMO energies of CNU-OC8 and CNU-TBU are −3.38 and −3.45 eV, respectively. The calculated energy levels of the frontier molecular orbitals and band gaps are in excellent agreement with the experimental CV data reported in Table 1. The simulated HOMO energies of the dyes are well below the redox potential (−5.20 eV) of the redox couple I−/I3−, which facilitates the effective dye regeneration. The LUMO energies of the two dyes are well above the conduction band of the TiO2 (−4.20 eV), which fulfils the requirement for effective electron injection from the dye excited state. The UV-visible spectra of CNU-OC8 and CNU-TBU were simulated in tetrahydrofuran solvent and are depicted in Fig. 9. From the figure, it can be seen that the TDDFT simulations reproduced the main bands observed in the experimental UV-visible spectrum. Calculated first five singlet vertical excitation energies along with their oscillator strengths are given in Table 4. The calculated absorption maxima (λmax) in the low energy region of the dyes CNU-OC8 and CNU-TBU are located at 662 and 673 nm, respectively, are in well agreement with the experimental results. These low energy absorptions mainly occur from the transition of HOMO to LUMO for both the dyes. The other intense band around 450 nm is due to the transition from HOMO−1 to LUMO+1 with oscillator strength of more than 1.4. The excitation energies and oscillator strengths were interpolated by a Gaussian convolution with an FWHM of 2500 cm−1.
 |
| Fig. 8 Electron density distribution in HOMO−1, HOMO, LUMO, and LUMO+1 for CNU-OC8 and CNU-TBU obtained at M06/6-31G(d,p)/LanL2DZ level of theory. Hydrogen atoms are omitted for clarity. | |
Table 3 Energies of the frontier molecular orbitals calculated at M06/6-31G(d,p)/LanL2DZ level of theory, along with the optical band gap (E0–0)
Dye |
EHOMO (eV) |
E0–0a (eV) |
ELUMO (eV) |
E0–0 is the TDDFT transition energy (S0 → S1), and the LUMO = HOMO + E0–0. |
CNU-OC8 |
−5.25 |
1.87 |
−3.38 |
CNU-TBU |
−5.29 |
1.84 |
−3.45 |
 |
| Fig. 9 Simulated UV-visible absorption spectra of CNU-OC8 and CNU-TBU in tetrahydrofuran obtained at TD-M06/6-31G(d,p)/LanL2DZ level of theory. | |
Table 4 Simulated absorption wavelengths (λcal), oscillator strengths (f), and coefficient of configuration interaction (CI) with dominant contribution to each transition of the two dyes
Dye |
Transition |
λcal (nm) |
λexpa (nm) |
f |
CI coefficient |
Dominant contributionb (%) |
Experimental absorption wavelengths. H and L denote HOMO and LUMO, respectively. |
CNU-OC8 |
S0 → S1 |
662 |
649 |
0.5482 |
0.67036 |
H → L (90) |
S0 → S2 |
597 |
|
0.0062 |
0.51926 |
H−1 → L (54) |
S0 → S3 |
542 |
|
0.0291 |
0.63328 |
H−2 → L (80) |
S0 → S4 |
489 |
|
0.2313 |
0.50185 |
H → L+1 (50) |
S0 → S5 |
450 |
453 |
1.4180 |
0.45611 |
H−1 → L+1 (42) |
CNU-TBU |
S0 → S1 |
673 |
650 |
0.5111 |
0.67392 |
H → L (91) |
S0 → S2 |
601 |
|
0.0023 |
0.49824 |
H−1 → L (50) |
S0 → S3 |
549 |
|
0.0469 |
0.63571 |
H−2 → L (81) |
S0 → S4 |
496 |
|
0.2416 |
0.48306 |
H → L+1 (47) |
S0 → S5 |
448 |
448 |
1.4075 |
0.46621 |
H−1 → L+1 (43) |
Photovoltaic characteristics
The incident photo-to-current conversion efficiencies (IPCE) diagrams for the DSSCs of the three porphyrin dyes are shown in Fig. 10. The dyes all respond in the broad range of 300–750 nm and show maximum IPCE values at 450 nm and 650 nm. This is consistent with UV-visible absorption spectra of the three dyes. For CNU-OC8, higher dye-loading value obtained compared to CNU-TBU and YD2-OC8, it may be an important reason for the higher IPCE value, which implies that this sensitizer would result in a relatively large photocurrent in DSSCs, also shows strong –COOH anchoring on TiO2 surface improved by thiazole π-spacer.57 By contrast, CNU-TBU exhibits a lower IPCE because of its weaker light-conversion ability although it has higher dye-loading value than YD2-OC8 (Table 5).
 |
| Fig. 10 IPCE [%] spectrum of the devices made with CNU-OC8, YD2-OC8 and CNU-TBU dyes. | |
Table 5 Photovoltaic characteristics of the DSSC devices fabricated using dyes 1 and 2 compared to those of the device fabricated using the YD2-OC8 standard dye. The approximate electrode areas were 0.24 cm2, and measurements were conducted at approximately 100 mW cm−2
Dye |
Jsc (mA cm−2) |
Voc (V) |
FF (%) |
η (%) |
DLa mmol cm−2 |
The amounts of dye loading, indicated as YD2-OC8, CNU-OC8 and CNU-TBU were determined from desorption of dye molecules on immersion of the transparent 8 μm TiO2 electrodes in a basic solution of 0.1 M sodium hydroxide in THF and the calibrated absorption. |
CNU-OC8 |
13.99 |
0.717 |
64.71 |
6.49 |
264.3 |
CNU-TBU |
6.73 |
0.644 |
73.61 |
3.19 |
173.2 |
YD2-OC8 |
12.92 |
0.753 |
62.63 |
6.10 |
138.3 |
The current density–voltage (I–V) characteristic of the DSSCs sensitized by CNU-OC8, CNU-TBU and YD2-OC8 is displayed in Fig. 11, and the corresponding detailed photovoltaic performance parameters recorded in Table 5. Under standard global air mass 1.5 solar conditions, the CNU-TBU sensitized cell provided a short circuit photocurrent density (Jsc) value of 6.73 mA cm−2, an open circuit voltage (Voc) of 0.644 V, and a fill factor (FF) of 73.61, corresponding to overall conversion efficiency (η) of 3.19%. Under the similar conditions, the DSSCs for CNU-OC8 and benchmark YD2-OC8 showed Jsc of 13.99 and 12.92 mA cm−2, Voc of 0.717 and 0.753 V, and FF of 64.71 and 62.63, corresponding to η of 6.49% and 6.10%, respectively. These results indicate that thiazole carboxylic acid is a good acceptor anchoring group for 2,6-dioctyloxyphenyl porphyrin sensitizer. The high Jsc of CNU-OC8 might be attributed the lengthy and judiciously wrapped alkoxy chains of CNU-OC8, impede efficiently the π–π aggregation, which increases the charge injection of the dye and additionally protect the porphyrin core against the electrolyte, which on the other hand delays the charge recombination process with the oxidized species of the redox shuttle.20 The obtained lower Jsc and efficiency values in the case of CNU-TBU is attributable to low light harvesting ability (Fig. 10). Finally here, we achieved good conversion efficiency in the case of CNU-OC8, compare to benchmark YD2-OC8 under similar conditions. It shows that thiazole π-spacer play a key role to replace the phenyl group.
 |
| Fig. 11 Current–voltage characteristics of the devices made with CNU-OC8, YD2-OC8 and CNU-TBU porphyrin dyes with an I−/I3−-based redox electrolyte. | |
Conclusion
We designed and synthesized the D–π–A porphyrin sensitizers CNU-OC8 and CNU-TBU with a thiazole carboxylic acid acceptor and compared their photovoltaic performance and electrochemical properties with those of YD2-OC8. Upon photosensitization of nanocrystalline TiO2, the sensitizer CNU-OC8 exhibited a good conversion efficiency of 6.49%, which is better than that of the standard YD2-OC8 sensitizer (6.09%) under the same photovoltaic conditions.
Acknowledgements
This study was supported by the National Research Foundation of Korea (NRF) funded by the Ministry of Science, ICT and Future Planning (Grant no. 2015063131).
Notes and references
- V. K. Singh, R. K. Kanaparthi and L. Giribabu, RSC Adv., 2014, 4, 6970–6984 RSC.
- M.-E. Ragoussi, M. Ince and T. Torres, Eur. J. Org. Chem., 2013, 6475–6489 CrossRef CAS.
- A. Hagfeld, G. Boschlo, L. Sun, L. Kloo and H. Pettersson, Chem. Rev., 2010, 110, 6595–6663 CrossRef.
- N. Robertson, Angew. Chem., Int. Ed., 2006, 45, 2338–2345 CrossRef CAS PubMed.
- L. Giribabu and R. K. Kanaparthi, Curr. Sci., 2013, 104, 847–855 CAS.
- A. Mishra, M. K. R. Fischer and P. Bauerle, Angew. Chem., Int. Ed., 2009, 48, 2474–2499 CrossRef CAS PubMed.
- M. Grätzel, Nature, 2001, 414, 338–344 CrossRef PubMed.
- B. O'Regan and M. Grätzel, Nature, 1991, 353, 737–740 CrossRef.
- C.-Y. Chen, M. Wang, J.-Y. Li, N. P. Chote, L. Alibabaei and C.-H. Ngoc-le, ACS Nano, 2009, 3, 3103–3109 CrossRef CAS PubMed.
- L. Han, A. Islam, H. Chen, M. Chandrasekharam, B. Chiranjeevi, S. Zhand, X. Yang and M. Yanagida, Energy Environ. Sci., 2012, 5, 6057–6060 CAS.
- M. K. Nazeeruddin, S. M. Zakeeruddin, R. H. Baker, M. Jirousek, P. Liska, N. Vlachopoulos, V. Shklover, C. H. Fischer and M. Grätzel, Inorg. Chem., 1999, 38, 6298–6305 CrossRef CAS PubMed.
- S. H. Kang, I. T. Choi, M. S. Kang, Y. K. Eom, M. J. Ju and J. Y. Hong, J. Mater. Chem. A, 2013, 1, 3977–3982 CAS.
- H. Imahori, T. Umeyama and S. Ito, Acc. Chem. Res., 2009, 42, 1809–1818 CrossRef CAS PubMed.
- A. Yella, H.-W. Lee, H. N. Tsao, C. Yi, A. K. Chandiran and M. K. Nazeeruddin, Science, 2011, 334, 629–633 CrossRef CAS PubMed.
- J. Rochford, D. Chu, A. Hagfeldt and E. Galoppini, J. Am. Chem. Soc., 2007, 129, 4655–4665 CrossRef CAS PubMed.
- S. Mathe, A. Yella, P. Gao, R. H. Baker, B. F. E. Curchod, N. A. Astani, I. Tavernelli, U. Rothlisberger, M. K. Nazeeruddin and M. Grätzel, Nat. Chem., 2014, 6, 242–247 CrossRef PubMed.
- C. Kc, K. Stranius, P. D'Souza, N. K. Subbaiyan, H. Lemmetyinen and N. V. Tkachenko, J. Phys. Chem. C, 2013, 117, 763–773 Search PubMed.
- S. Rangan, S. Katallinic, R. Thorpe, R. A. Bartynski, J. Rochford and E. Galoppini, J. Phys. Chem. C, 2010, 114, 1139–1147 CAS.
- J. Rochford and E. Galoppini, Langmuir, 2008, 24, 5366–5374 CrossRef CAS PubMed.
- M. Urbani, M. Grätzel, M. K. Nazeeruddin and T. Torres, Chem. Rev., 2014, 114, 12330–12396 CrossRef CAS PubMed.
- Z. Yao, M. Zhang, H. Wu, L. Yang, R. Li and P. Wang, J. Am. Chem. Soc., 2015, 137, 3799–3802 CrossRef CAS PubMed.
- Y. Xie, Y. Tang, W. Wu, Y. Wang, J. Liu, X. Li, H. Tian and W. Zhu, J. Am. Chem. Soc., 2015, 137, 14055–14058 CrossRef CAS PubMed.
- Y. Wang, B. Chen, W. Wu, X. Li, W. Zhu, H. Tian and Y. Xie, Angew. Chem., Int. Ed., 2014, 53, 10779–10783 CrossRef CAS PubMed.
- X. Sun, Y. Wang, X. Li, H. Ågren, W. Zhu, H. Tian and Y. Xie, Chem. Commun., 2014, 50, 15609–15612 RSC.
- S. Cherian and C. C. Wamser, J. Phys. Chem. B, 2000, 104, 3624–3629 CrossRef CAS.
- M. Sreenivasu, A. Suzuki, M. Adachi, V. C. Kumar, B. Srikanth, S. Rajendar, D. Rambabu, R. S. Kumar, P. Mallesham, N. V. B. Rao, M. S. Kumar and P. Y. Reddy, Chem.–Eur. J., 2014, 20, 14074–14083 CrossRef CAS PubMed.
- W. Li, Z. Liu, H. Wu, Y.-B. Cheng, Z. Zhao and H. He, J. Phys. Chem. C, 2015, 119, 5265–5273 CAS.
- T. Higashino, Y. Fujimori, K. Sugiura, Y. Tsuji, S. Ito and H. Imahori, Angew. Chem., Int. Ed., 2015, 127, 9180–9184 CrossRef.
- C.-L. Mai, T. Moehl, C.-H. Hsieh, J.-D. Décoppet, S. M. Zakeeruddin, M. Grätzel and C.-Y. Yeh, ACS Appl. Mater. Interfaces, 2015, 7, 14975–14982 CAS.
- J. Plater, S. Aiken and G. Bourhill, Tetrahedron, 2002, 58, 2405–2413 CrossRef.
- S. Karthikeyan and J. Y. Lee, J. Phys. Chem. A, 2013, 117, 10973–10979 CrossRef CAS PubMed.
- T. Yamamoto, H. Suganuma, T. Maruyama, T. Inoue, Y. Muramatsu, M. Arai, D. Komarudin, N. Ooba, S. Tomaru, S. Sasaki and K. Kubota, Chem. Mater., 1997, 9, 1217–1225 CrossRef CAS.
- M. Mamada, J.-I. Nishida, D. Kumaki, S. Tokito and Y. Yamashita, Chem. Mater., 2007, 19, 5404–5409 CrossRef CAS.
- T. Yamamoto, S. Otsuka, K. Namekawa, H. Fukumoto, I. Yamaguchi, T. Fukuda, N. Asakawa, T. Yamanobe, T. Shiono and Z. G. Cai, Polymer, 2006, 47, 6038–6041 CrossRef CAS.
- J. He, W. Wu, J. Hua, Y. Jiang, S. Qu, J. Li, Y. Long and H. J. Tian, J. Mater. Chem., 2011, 21, 6054–6062 RSC.
- C. Chen, X. Yang, M. Cheng, F. Zhang, J. Zhao and L. Sun, ACS Appl. Mater. Interfaces, 2013, 5, 10960–10965 CAS.
- M. J. Frisch, G. W. Trucks, H. B. Schlegel, G. E. Scuseria, M. A. Robb, J. R. Cheeseman, G. Scalmani, V. Barone, B. Mennucci and G. A. Petersson, et al., Gaussian 09, Revision B.01, Gaussian Inc., Wallingford, CT, 2010 Search PubMed.
- Y. Zhao and D. Truhlar, Theor. Chem. Acc., 2008, 120, 215–241 CrossRef CAS.
- P. J. Hay and W. R. Wadt, J. Chem. Phys., 1985, 82, 270–283 CrossRef CAS.
- W. R. Wadt and P. J. Hay, J. Chem. Phys., 1985, 82, 284–298 CrossRef CAS.
- P. J. Hay and W. R. Wadt, J. Chem. Phys., 1985, 82, 299–310 CrossRef CAS.
- S. Miertuš, E. Scrocco and J. Tomasi, J. Chem. Phys., 1981, 55, 117–129 Search PubMed.
- M. Cossi, V. Barone, R. Cammi and J. Tomasi, Chem. Phys. Lett., 1996, 255, 327–335 CrossRef CAS.
- C.-F. Lo, S.-J. Hsu, C.-L. Wang, Y.-H. Cheng, H.-P. Lu, E. W.-G. Diau and C.-Y. Lin, J. Phys. Chem. C, 2010, 114, 12018–12023 CAS.
- K. M. Kadish, K. M. Smith and G. Guilard, The porphyrin hand book, 8 and 9, Academic Press, New York, 2000, pp. 1–97 Search PubMed.
- J. A. Page and G. Wilkinson, J. Am. Chem. Soc., 1952, 74, 6149–6150 CrossRef CAS.
- R. Ma, P. Guo, H. Cui, X. Zhang, M. K. Nazeeruddin and M. Grätzel, J. Phys. Chem. Lett., 2013, 4, 524–530 CrossRef PubMed.
- L. Han, N. Koide, Y. Chiba and T. Mitate, Appl. Phys. Lett., 2004, 84, 2433–2435 CrossRef CAS.
- M. Itagaki, K. Hoshino, Y. Nakano, I. Shitanda and K. Watanabe, J. Power Sources, 2010, 195, 6905–6923 CrossRef CAS.
- K. Cao, J. Lu, J. Cui, Y. Shen, W. Chen, A. Getachewalemu, Z. Wang, H. Yuan, J. Xu and M. Wang, J. Mater. Chem. A, 2014, 2, 4945–4953 CAS.
- J. Chen, S. Ko, L. Liu, Y. Sheng, H. Han and X. Li, New J. Chem., 2015, 39, 2889–2900 RSC.
- Y. Tang, Y. Wang, X. Li, H. Ågren, W.-H. Zhu and Y. Xie, ACS Appl. Mater. Interfaces, 2015, 7, 27976–27985 CAS.
- T. Wei, X. Sun, X. Li, H. Ågren and Y. Xie, ACS Appl. Mater. Interfaces, 2015, 7, 21956–21965 CAS.
- F. F. Santiago, J. Bisquert, G. G. Belmonte, G. Boschloo and A. Hagfeldt, Sol. Energy Mater. Sol. Cells, 2005, 87, 117–131 CrossRef.
- Q. Wang, J. E. Mosar and M. Gratzel, J. Phys. Chem. B, 2005, 109, 14945–14953 CrossRef CAS PubMed.
- G. Zhang and C. B. Musgrave, J. Phys. Chem. A, 2007, 111, 1554–1561 CrossRef CAS PubMed.
- L. Zhang and J. M. Cole, ACS Appl. Mater. Interfaces, 2015, 7, 3427–3455 CAS.
Footnote |
† Electronic supplementary information (ESI) available: Detailed 1H-NMR, 13C-NMR, HRMS and IR data available. See DOI: 10.1039/c6ra00353b |
|
This journal is © The Royal Society of Chemistry 2016 |
Click here to see how this site uses Cookies. View our privacy policy here.