Fish embryo toxicity assessment of o-dianisidine in Clarias gariepinus and its electrochemical treatment in aquatic samples using super conductive carbon black†
Sundaram Sornambikaia,
Lim Qing Hinb,
Kasi Marimuthu*b and
Mohammed Rafiq Abdul Kadir*a
aMedical Devices & Technology Group, Faculty of Biosciences & Medical Engineering, Universiti Teknologi Malaysia, 81310 UTM, Johor Bahru, Johor, Malaysia. E-mail: rafiq@biomedical.utm.my; Fax: +60 7 5536222; Tel: +60 7 5535961
bDepartment of Biotechnology, Faculty of Applied Sciences, AIMST University, Bedong, Kedah Darul Aman, Malaysia. E-mail: aquamuthu2k@yahoo.com; Fax: +60 4 4298149; Tel: +60 4 4298109
First published on 13th May 2016
Abstract
The present study tested fish embryo toxicity (FET) of o-dianisidine (o-dian) on African catfish (Clarias gariepinus) and its electrochemical treatment through electro-oxidation of real aquatic samples for the first time. The o-dian exposed groups exhibited embryonic malformations, hatching retardation and mortality in a dose- and time-dependent manner compared to the control group even for 5 mg L−1 o-dian, in spite of being under the permissible limit. The LC50 values (with 95% confidence limits) of o-dian for larvae were estimated to be 42.614 (36.851–50.766), 35.327 (29.632–43.819) and 19.442 (15.448–24.539) mg L−1, respectively from 24 to 72 hours post-fertilization (hpf). Subsequently, the electrochemical uptake and treatment of o-dian was successfully demonstrated using a super conductive carbon black (CL-08) modified glassy carbon electrode in pH 2 phosphate buffer solution (PBS). The saturation surface coverage, Γs and adsorption constant, Ka values, evaluated using curve fitting for the Langmuir isotherm model, were 88.354 nmol cm−2 and 48.6 × 10³ M−1 respectively. The calculated % yields of o-dian uptake on the electrode surface were 33, 43, 40 and 34. UV-Vis spectra of the electro-oxidized real samples showed 56, 36, 39 and 86% reductions of the o-dian absorbance peak at 363 nm respectively. The electrochemically treated real samples showed an efficient increase in the survival rate of African catfish larvae (p < 0.05).
1. Introduction
ortho-Dianisidine (o-dian) is widely used as a chemical intermediate for the production of dye and pigments in leather, paper, plastics, rubber and textile industries.1,2 It is also used as a substrate for the oxidation of horseradish peroxidase/hydrogen peroxide,3 for aromatic amine oxidation in electrochemistry4 and to stain haemoglobin containing cells for hematopoiesis analysis during embryonic development.5 The International Agency for Research on Cancer (IARC), US Department of Health and Human Service and the Environmental Protection Agency (EPA) has classified o-dian as a human carcinogen and extremely harmful water pollutant.1,6,7 Based on the toxicity evaluation reports in rats, the release limit of o-dian to the environment is set at 30 mg kg−1 and 20 mg kg−1 in the European Union and China, respectively.8,9 In addition, a recent technical report on hazardous materials revealed that o-dian is being released at a rate of 9 mg kg−1 and 7 mg kg−1 from clothes to the aquatic environment.10 Although these levels are below the regulatory limits, the presence of this compound in the aquatic environment may cause developmental abnormalities and mortality in aquatic organisms like other pollutants11 and engineered materials used for drug delivery applications.12–15 To the best of our knowledge, fish embryo toxicity (FET) evaluation of the xenobiotic, o-dian, on aquatic organisms has not yet been investigated. FET evaluation is a reliable method for testing acute toxicity through the extent of mortality of chemicals and whole effluents to fish using the median lethal concentration (LC50) measurement.11,16–19 In addition, the FET assay is considered simple, efficient, reliable and informative to analyse the sublethal effects of the pollutants and their long term consequences in fish.12–15 Therefore, in this study, FET of o-dian has been examined on the survival of embryo and larvae of African catfish, Clarias gariepinus. In addition, the efficiency of the electrochemical uptake and treatment of o-dian containing real water samples via in situ oxidation has also been examined in this study for the first time.The electrochemical method is a promising technique for wastewater treatment of organic pollutants because of its environmental compatibility, cost-effectiveness, ease of control and lack of formation of secondary waste and/or toxic products.20–23 In particular, in situ electro-generation of oxidized organic pollutants is reported to be more efficient in treating wastewater than oxidation of the compound using biological, chemical and physical oxidation methodologies.23–25 In the electrochemical treatment of pollutants, the main reagent is the electron which plays a significant role in the destruction of toxic and non-biodegradable organics via direct or indirect oxidation.23 C. C. Jara et al. reported that the graphite anode with a three-dimensional set up is highly efficient compared to metallic anodes with lower oxidative kinetics, lower current densities, enhanced mass transfer co-efficient and effective treatment of low concentrations of antibiotics.26 In addition, A. M. Polcaro et al. tested both divided and undivided cell configurations for the combustion of organic pollutants using three-dimensional electrodes. This study revealed that, even though the presence of the membrane is highly efficient, the incorporation of a membrane involves a more complex and expensive configuration of the reactor.27 Recently, A. S. Kumar et al. also successfully demonstrated the uptake of the organic antibiotic pollutant, amoxicillin on a GCE/MWCNT from aqueous samples using a simple undivided cell configuration in a three electrode system.28 Thus, in this study, the three electrode system with undivided cell configuration was adopted for its simplicity and cost-effectiveness in degrading the pollutant via electro-oxidation.26,27
Recently, our group showed that o-dian generates an in situ electro-oxidized dimer on the multiwalled carbon nanotube (MWCNT) modified electrode surface at neutral pH during continuous potential cycling with a three electrode system.29 Therefore, herein, low cost super conductive carbon black (CL-08) modified GCE (GCE/CL-08) has been utilised for the electrochemical treatment (oxidation) of o-dian through in situ electro-generated species and its uptake from water samples at pH 2. In addition, electrochemically treated real samples were also examined for their efficiency in reducing the mortality of the African catfish larvae. The proposed GCE/CL-08 was highly sensitive and effective compared to the GCE/MWCNT for electrochemical treatment and uptake of o-dian from aquatic samples and for the survival of larvae.
2. Experimental
2.1 Materials and instrumentation
Super conductive carbon black (CL-08, particle size <15 nm, moisture <2%, ash content <0.60% and STSA 950–1050 m2 g−1) was provided by Continental Carbon India Pvt Ltd., MWCNT, O.D: <7 nm; I.D: 2–5 nm; length 10–30 μm; >95% purity, the glassy carbon electrode (GCE) and o-dianisidine were purchased from US Research nanomaterials, CH Instruments, USA, and Sigma Aldrich, Malaysia, respectively. Other chemicals and solvents used in this study were all of analytical grade. The dissolved oxygen containing supporting electrolyte (0.1 M pH 2 PBS) was prepared using double distilled (DD) water for the enhanced electro-oxidation process. Voltammetry was conducted with a VersaSTAT electrochemical workstation, AMETEK (USA). A GCE (0.0707 cm2 geometric areas) and its chemically modified form were used as the working electrode, Ag/AgCl as the reference and a graphite rod as the auxiliary electrode. The following spectroscopy analyses of o-dian adsorbed CL-08 (o-dian@CL-08) were conducted: ATR-FTIR using a Perkin Elmer spectrophotometer, (USA) and UV-Visible using a UV-Vis spectrophotometer DR6000/HACH (USA).2.2 Fish collection, hormonal injection and breeding
Adult male and female African catfish, C. gariepinus, weighing 2 to 3 kg, with a length of 40–50 cm were obtained from a local fish supplier, Sungai Petani, Kedah Darul Aman, Malaysia. The fish collection and breeding procedures were reported elsewhere.30 In brief, tap water was stored in a circular storage tank for at least 48 h for dechlorination. The brood fish were stocked in 500 L circular cement tanks at 25 ± 1 °C under natural conditions. Both the female and male fish were induced artificially by intramuscular injection of ovaprim (0.4 mL per kg bw). Artificially induced fish were maintained separately in the circular cement tank (500 L) for 12 h. Then, the eggs were stripped into circular plastic trays and the testicles were removed, followed by sperm collection in a dry sterile Petri dish. The eggs were fertilized with the diluted sperm suspension for 2 min with gentle stirring. Then, the fertilized eggs were washed several times with tap water to remove excess milt and subjected to the embryo toxicity assay. A portion of fertilized eggs were released into the glass aquarium to obtain hatching for the larval bio-assay studies. The FET protocol was approved by the AIMST University Human and Animal Ethics committee (AUHAEC 1/UTM/2014), Malaysia.2.3 Exposure of C. gariepinus embryos to o-dianisidine
The fertilized eggs were randomly allocated into experimental groups and a control group. The experimental groups were exposed to six different concentrations (0.0, 5.0, 10.0, 20.0, 40.0 and 60.0 mg L−1) of o-dian dissolved in water for the embryonic and larval bioassay. The experiments were conducted using 1 L capacity plastic containers with five replicates. The water quality parameters were determined according to APHA.30,31 The mean values for experimental water qualities were as follows: temperature 25.0 ± 1.0 °C, pH 7.5 ± 0.2, dissolved oxygen 7.1 ± 0.1 mg L−1, total alkalinity (as CaCO3) 29.0 ± 1.0 mg L−1, hardness 35.0 ± 5.2 mg L−1, nitrite 0.01 mg L−1, nitrate 2.7 ± 0.1 mg L−1, chloride 6 ± 1 mg L−1 and ammonia 0.01 ± 0.001 mg L−1. The hatching time and number of dead embryos were recorded in both control and experimental groups. To study the larval toxicity, 100 hatchings were placed into each aquarium and each test concentration and control group were executed with five replicates. Malformations of the embryos and larvae were described and recorded for both groups. After 24 and 48 hpf, the exposure periods to different concentrations of o-dian, each container was examined and the number of dead larvae was counted. The survival rate of hatching was calculated at 24, 48 and 72 hpf of exposure in both groups.2.4 Statistical analysis
The data on hatching and survival rate for 24, 48 and 72 hpf are presented as the mean of five replicates ± standard deviation (SD). The LC50 and 95% confidence intervals (95% CI) were analyzed by probit analysis using SPSS (Version 20). A one-way analysis of variance (ANOVA) was used to analyze the different concentrations of o-dian toxicity in embryo and larvae and mean comparisons were performed by Duncan’s multiple comparison tests at a 5% significance level.2.5 Electrode modification and sample preparations for electro-oxidation
The CL-08 and MWCNT modified GCE (GCE/CL-08 and GCE/MWCNT) were prepared by drop casting 2 and 3 μL of CL-08 and MWCNT, respectively dispersed ethanol (2 mg/500 μL) on the pretreated GCE followed by air drying for 15 min at room temperature and potential cycling in the optimal potential window from 0 to 1.2 V vs. Ag/AgCl for n = 20 at a scan rate of 50 mV s−1. For the uptake and electrochemical treatment of o-dian on GCE/CL-08 and GCE/MWCNT, the electrodes were potential cycled in 240 mg L−1 o-dian containing pH 2 PBS for 50 cycles. The CV experiments were carried out at 200 rpm using a magnetic stirrer for the electrolyte solution. For ATR-FTIR analysis, the o-dian@CL-08powder extract hybrid powder was prepared by extracting the electrochemically prepared GCE/o-dian@CL-08 in 5 mL of ethanol followed by drying the ethanol under vacuum prior to analysis. The preparation of the electrode was repeated 30 times in the optimal potential window to obtain a sufficient amount of hybrid powder for ATR-FTIR analysis. For the UV-Vis analysis, the as prepared pH 2 PBS and o-dian dissolved buffers, before and after potential cycling, were used.2.6 Preparation and electrochemical treatment of real aquatic samples
Water samples collected from the lake (R#1) river (R#2) and ponds (R#3 and R#4) from Johor, Malaysia were used in this study. The samples were filtered and suitably diluted with pH 2 PBS (dilution factor = 3). 10 mL of diluted real samples with the addition of 5 mg L−1 of o-dian were sonicated for 2 min and then subjected to potential cycling on the modified electrodes. To determine the uptake efficiency of GCE/CL-08, the blank pH 2 PBS, o-dian dissolved real samples prepared in the buffer before and after potential cycling were analysed using the UV-Vis spectrophotometer.3. Results and discussion
3.1 Toxicity assay
Acute fish toxicity (AFT) of o-dian for the survival of C. gariepinus embryo is presented in Table 1. The results clearly show that the mortality rate of embryos was significantly increased with increasing o-dian concentrations from 5 to 60 mg L−1 at p < 0.05. The incubation periods of fertilized eggs were recorded at 34 h in the control group and 28–40 h in the experimental groups. The increased incubation period was noticed at 40 and 60 mg L−1 concentration of o-dian compared to control groups. The 24 hpf LC50 value (95% confidence limits) of o-dian for embryos was found to be 1.754 (0.898–2.698) for 5 mg L−1. Furthermore, the results confirmed that the hatching rate was as follows: 84.1% > 30.2% > 24.5% > 22.3% > 11.2% > 3.1% for 0, 5, 10, 20, 40 and 60 mg L−1 of o-dian, respectively. These results indicated that embryo mortality was significantly increased in a dose- and time-dependent manner.| Concentrations (mg L−1) | Incubation period (h) | Hatching rate (%) | Survival rate of hatching at 24 h (%) | Survival rate of hatching at 48 h (%) | Survival rate of hatching at 72 h (%) |
|---|---|---|---|---|---|
| Control | 34.6 ± 2.5a | 84.1 ± 8.3a | 96.6 ± 4.5a | 96.6 ± 4.5a | 96.6 ± 4.5a |
| 5 | 28.6 ± 2.0a | 30.2 ± 0.6b | 96.9 ± 4.2a | 86.5 ± 3.2b | 79.3 ± 3.6b |
| 10 | 29.7 ± 3.0a | 24.5 ± 2.3c | 83.9 ± 5.8b | 81.1 ± 6.4b | 59.5 ± 7.4c |
| 20 | 32.7 ± 4.0a | 22.3 ± 3.1c | 73.8 ± 7.8c | 70.5 ± 9.1c | 57.1 ± 8.2c |
| 40 | 37.5 ± 5.0a | 11.2 ± 1.6d | 56.61 ± 5.4d | 52.3 ± 6.2d | 46.5 ± 6.2d |
| 60 | 40.2 ± 7.0a | 3.1 ± 1.4e | 35.95 ± 7.2e | 28.1 ± 9.2e | 10.6 ± 3.5e |
| p value | <0.05 | <0.05 | <0.05 | <0.05 | <0.05 |
| LC50 value with 95% confidence intervals | 1.754 (0.898–2.698) | 42.614 (36.851–50.766) | 35.327 (29.632–43.819) | 19.442 (15.448–24.539) |
In the larval toxicity assay, the rate of larval survival at different concentrations of o-dian was examined for 24, 48 and 72 hpf of exposure (Table 1). The survival rate was significantly decreased (p < 0.05) with increasing o-dian concentrations from 10 to 60 mg L−1. Meanwhile, these values did not significantly differ between the control and 5 mg L−1 o-dian exposed groups (p > 0.05). Significant differences in the mortality rate of larvae for 24, 48 and 72 hpf exposure at all the concentrations (p < 0.05) were noted except for 5 mg L−1 exposure at 24 hpf. The higher concentration of 60 mg L−1 showed the highest larval mortality (90%) at 72 hpf of exposure. The LC50 values (with 95% confidence limits) of o-dian for larvae were estimated to be 42.614 (36.851–50.766), 35.327 (29.632–43.819) and 19.442 (15.448–24.539) mg L−1 respectively from 24, 48 and 72 hpf.
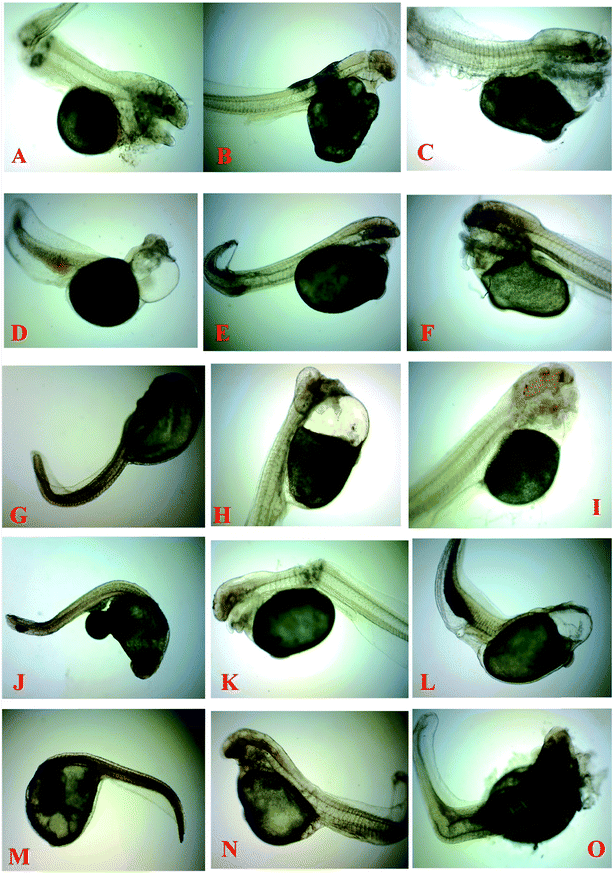
Fig. 1(A)–(O) shows malformation such as irregular head shape, lordosis, yolk sac edema, body arcuation, tissue ulceration, pericardial edema and pericardial hemorrhage induced by o-dian in the embryos and larvae in the experimental groups exposed to 5 mg L−1 compared to the control group. These observations confirmed that o-dian is highly toxic to embryos and larvae in the permissible limit of o-dian to the aquatic environment. The possible mechanism behind the malformations and mortality of the fish in this study may be due to DNA damage in the brain which led to brain apoptosis in the zebrafish in agreement with earlier literature on benzedine toxicity on zebrafish.32 The hatching retardation of fish embryos may be due to the disturbance of the hatching enzyme and induced hypoxia by o-dian like other pollutants.5 Therefore, an efficient, simple and low cost treatment methodology is required for the detoxification/oxidation and uptake of o-dian from wastewater before its release into aquatic systems even at low concentrations. For this purpose, the highly compatible and low cost electro-oxidation methodology for the oxidation and adsorption23–25 or uptake of o-dian from aquatic samples using a super conductive carbon black (CL-08) matrix was demonstrated in the present study for the first time.
3.2 Electro-oxidation of o-dian on GCE/CL-08
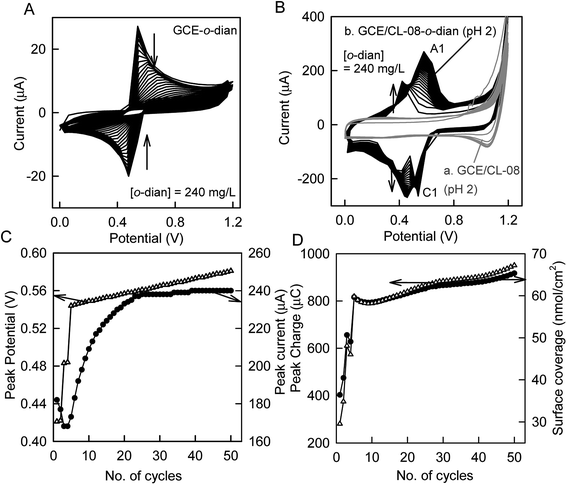
The electrochemical treatment in this study was carried out at the laboratory scale as a preliminary test to analyze the suitability of the newly proposed CL-08 modified electrode for the adsorption or uptake and electro-oxidation of o-dian in a three electrode containing cell. C. C. Jara et al.27 reported that the use of a carbon type electrode enables a complete oxidation pathway for the pollutant; however, there are more possibilities for corrosion of the electrode in highly acidic conditions and higher anodic potentials. Therefore, the new electrode substrate, CL-08, with a higher BET surface area of 1050 m2 g−1 was used in this study to modify the GCE rather than the conventional carbon black to oxidize o-dian at acidic pH with relatively low ionic concentration (0.1 M) and at low anodic potentials. Note: the BET surface area of conventional carbon blacks lies between 50 and 500 m2 g−1 and for MWCNT, the BET surface area lies between 500 m2 g−1 and 1000 m2 g−1. The higher the surface area, the higher the electrochemical conductivity of the modified electrode. Initially, the bare glassy carbon electrode (GCE) was subjected to potential cycling in 240 mg L−1 o-dian containing pH 2 PBS and the electrode was designated GCE-o-dian. As seen in Fig. 2A, the bare GCE exhibited a sharp redox peak at ∼0.4 V vs. Ag/AgCl in the first cycle. However, with continuous potential cycling, the redox peak gradually decreased and disappeared completely at the end of 50th cycle. Next, the electrochemical behaviour of the CL-08 modified GCE in 240 mg L−1 containing pH 2 PBS was studied for 50 continuous potential cycles in the window of 0 to 1.2 V vs. Ag/AgCl at a scan rate (ν) of 50 mV s−1. For the GCE/CL-08, no redox peak was observed in the absence of o-dian (Fig. 2B(a)). However, as shown in Fig. 2B(b), redox peak (A1/C1) formation was noticed at 0.4 V vs. Ag/AgCl for the GCE/CL-08 in the presence of o-dian in the first cycle. In addition, the peak current increased gradually with a potential shift from 0.4 V to 0.6 V upon increased potential cycles up to 40 cycles, and then tended to saturate from the 40th cycle onwards and saturated completely at the 50th cycle as seen in Fig. 2C. The shift in the peak potential towards more positive values at pH 2.0 may be due to a weaker influence of the polymerization phenomena and adsorption of o-dian on the CL-08 modified electrode surface in agreement with the adsorption of phenol in strongly acidic conditions.33,34 The higher peak current indicates the efficiency of CL-08 as a matrix for oxidation of o-dian in the three electrode system. The surface coverage (nmol cm−1) values of adsorbed o-dian, Γo-dian, were obtained by integrating the voltammogram for the anodic peak area (Qa) of the respective redox peak at ν = 50 mV s−1 taken from the last cycle and calculated using the Faraday’s law of electrolysis equation Γo-dian = (Qa)/nFA mol cm−2, where n is the number of electrons (n = 2) and A is the geometric surface area (0.0707 cm2). A plot for the peak charge and Γo-dian values vs. the no. of potential cycles is displayed in Fig. 2D, to observe the trend of o-dian uptake with increased potential cycles. Continuous potential cycling was done in this work to show that the modified electrode can continuously uptake the pollutant during multiple cycles and the efficiency of uptake has been identified based on the increased surface coverage value from the first cycle until 50 cycles later similar to the literature for the uptake of amoxicillin using a carbon nanotube modified electrode.28 For comparison purpose, the GCE/MWCNT was subjected to 50 continuous potential cycles under optimal experimental conditions. However, the GCE/MWCNT exhibited lower peak current values in spite of showing redox behaviors similar to the GCE/CL-08 (data not shown).In order to examine the suitable pH for the effective oxidation of o-dian on the GCE/CL-08, the electrode was subjected to 50 continuous potential cycles in three different electrolyte pH (2, 5.56 and 9) PBS solutions under optimal conditions. The pH was adjusted using 1 M HCl and 1 M NaOH prepared in DD water. The prominent and saturated redox peak was noticed at 0.6 V vs. Ag/AgCl as shown in Fig. 2B(b) for pH 2 as discussed earlier. However, at pH 5.56 and 9, suspensions of o-dian were noticed as it did not get dissolved completely in the buffer. In addition, a feeble oxidation and reduction response of o-dian at pH 5.56 and nil redox response at pH 9 along with a decrease in the peak current during continuous cycling were noticed in the potential window between 0 to 1.2 V vs. Ag/AgCl as seen in Fig. S1A and B.† Therefore, pH 2 was considered to be the optimal pH for further experiments. Similar to our earlier study,29 in situ dimer formation was expected on the electrode surface as well as in the solution. To confirm the electro-oxidized o-dian species involved in this work, the following physico-chemical and electrochemical characterizations were performed using ATR-FTIR and voltammetry experiments.
3.3 Analysis of the in situ electro-generated species
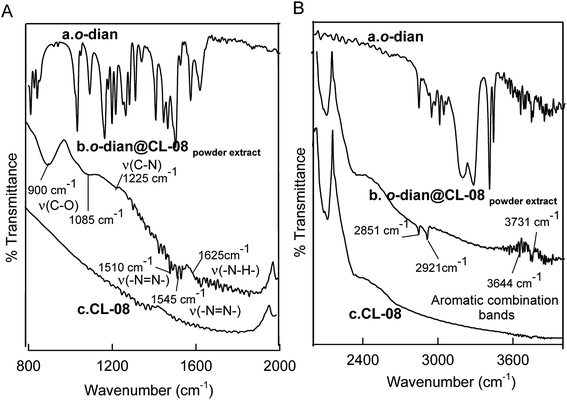
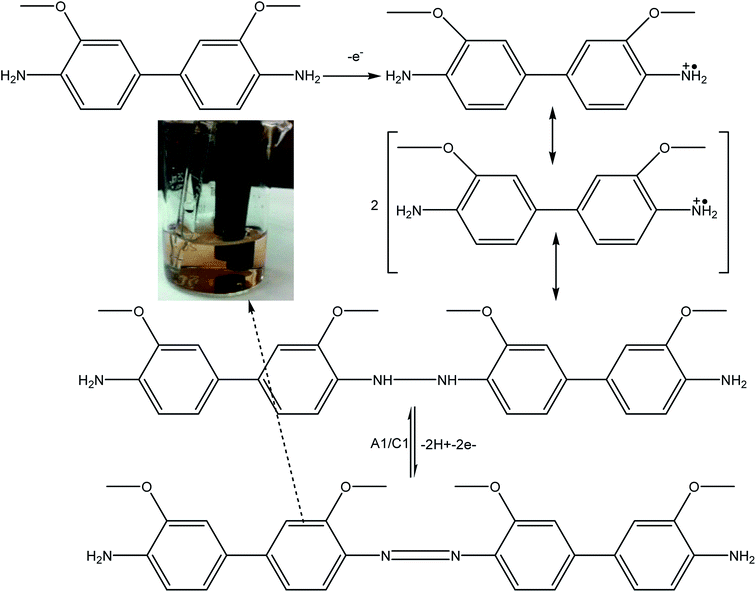
The possible functional group interactions of the in situ electro-generated intermediate species during the electro-oxidation process were investigated by subjecting (a) o-dian, (b) o-dian@CL-08powder extract hybrid powder and (c) CL-08 to ATR-FTIR analysis in the 600 to 4000 nm range. The o-dian@CL-08powder extract exhibited a combination of o-dian and CL-08 FTIR patterns, as shown in Fig. 3A and B. The stretching vibrations seen in Fig. 3A at 1225 (C–N), 900 and 1085 (C–O), 1625 cm−1 (N–H) for the aromatic amine group of o-dain were observed similarly to a previous report.29 Azo –N![[double bond, length as m-dash]](https://www.rsc.org/images/entities/char_e001.gif) N– at 1510, 1545 and aromatic O–H stretching vibrations were observed above 3600 cm−1, respectively.29 A band seen at >2800 cm−1 in the hybrid powder corresponds to the aromatic combination peak (Fig. 3B). These results clearly revealed that the interaction between o-dian and the CL-08 matrix is in the azo dimer form on the electrode surface as observed in our earlier study.29 o-dian from the electrolyte solution got adsorbed on the GCE/CL-08 and formed an o-dian dimer during electrochemical cycling. This indicated that adsorption from the solution phase occurred through electro-oxidation of o-dian in the solution. Therefore, the mechanism of the electro-oxidation of o-dian in the present study involved amine group oxidation to form amine radical cations (Scheme 1), which lead to the formation of dimeric o-dian with –NH–NH– groups and an azo group linkage in agreement with our previous study.29 In addition, azo group formation in the present study was confirmed further with the reddish orange coloured electro-generated oxidized redox product on the electrode surface as well as within the electrolyte solution during potential cycling (inset photograph in Scheme 1). This colour change was observed only after 10 cycles and intensified with increased cycles which indicate the significance of continuous potential cycles for enhanced oxidation compared to single potential cycling.
N– at 1510, 1545 and aromatic O–H stretching vibrations were observed above 3600 cm−1, respectively.29 A band seen at >2800 cm−1 in the hybrid powder corresponds to the aromatic combination peak (Fig. 3B). These results clearly revealed that the interaction between o-dian and the CL-08 matrix is in the azo dimer form on the electrode surface as observed in our earlier study.29 o-dian from the electrolyte solution got adsorbed on the GCE/CL-08 and formed an o-dian dimer during electrochemical cycling. This indicated that adsorption from the solution phase occurred through electro-oxidation of o-dian in the solution. Therefore, the mechanism of the electro-oxidation of o-dian in the present study involved amine group oxidation to form amine radical cations (Scheme 1), which lead to the formation of dimeric o-dian with –NH–NH– groups and an azo group linkage in agreement with our previous study.29 In addition, azo group formation in the present study was confirmed further with the reddish orange coloured electro-generated oxidized redox product on the electrode surface as well as within the electrolyte solution during potential cycling (inset photograph in Scheme 1). This colour change was observed only after 10 cycles and intensified with increased cycles which indicate the significance of continuous potential cycles for enhanced oxidation compared to single potential cycling.
To determine the electron transfer mechanism and the adsorption kinetics of the proposed electrode for the uptake and electro-oxidation of o-dian, electrochemical characterizations such as effects of the scan rate and o-dian concentrations on the peak currents and peak potentials on the GCE/CL-08 were investigated.
3.4 Electrochemical characterization and adsorption kinetics of GCE/o-dian@CL-08
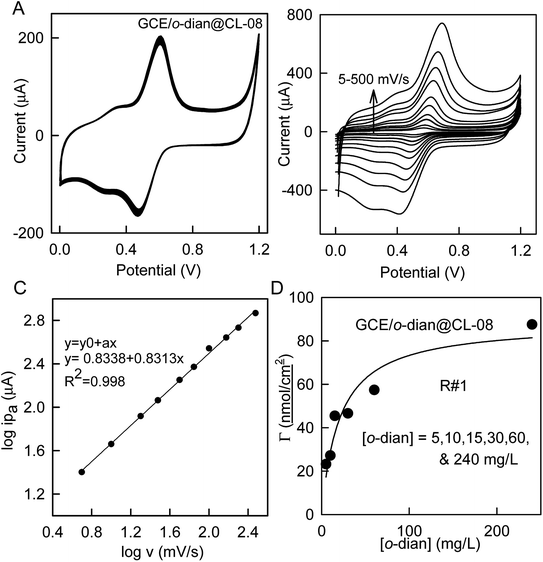
After 50 continuous potential cycles, the GCE/CL-08 was taken out from o-dian containing pH 2 PBS and transferred to the blank pH 2 PBS and subjected to 20 continuous potential cycles to observe the redox peak. Interestingly, the A1/C1 peak was found to be surface confined on the electrode surface and o-dian adsorbed GCE/CL-08 is designated as GCE/o-dian@CL-08 as shown in Fig. 4A. In addition, the mechanism of in situ electrochemical oxidation and reduction involves electron transfer reactions occurring on the electrode surface through the electrolyte medium during the application of potential which influences the chemical reaction between the electrodes and the electrolyte. Therefore, the oxidation and uptake/adsorption of o-dian that occurs at the electrode and its dependence on the scan rate were studied. To understand the mechanism of electron transfer involved in this work, the GCE/CL-08 was subjected to potential cycling in 240 mg L−1 o-dian at different scan rates from 5 to 500 mV s−1 under the optimal experimental conditions. The voltammogram shows increased peak potentials with increased scan rate which is usually related to the quasi-reversible state where the rate of electron transfer is comparable to the mass transport rate.35,36 In addition, an increase in the peak current with a pre-peak noticed at ∼0.3 V, a cathodic peak potential less than the anodic peak potential along with a shift in the peak potential to higher values with increasing scan rates were noticed. The calibration plot obtained for logarithmic anodic peak current (log![[thin space (1/6-em)]](https://www.rsc.org/images/entities/char_2009.gif) ipa) vs. scan rate (log
ipa) vs. scan rate (log![[thin space (1/6-em)]](https://www.rsc.org/images/entities/char_2009.gif) ν) resulted in a slope value of 0.83 (Fig. 4B and C). This slope value is close to the ideal theoretical value of 1 for a strongly adsorbed product on a nanocarbon modified electrode. All the above observations from the scan rate effect indicated that the electron transfer follows an adsorption mechanism in the present study.35,36
ν) resulted in a slope value of 0.83 (Fig. 4B and C). This slope value is close to the ideal theoretical value of 1 for a strongly adsorbed product on a nanocarbon modified electrode. All the above observations from the scan rate effect indicated that the electron transfer follows an adsorption mechanism in the present study.35,36
To determine the lowest concentration of o-dian that can be adsorbed and electro-oxidized through dimer formation, the GCE/CL-08 was subjected to 50 potential cycles under optimal experimental conditions with [o-dian] = 5, 10, 15, 30 and 240 mg L−1. The concentrations were chosen in this study on the basis of the lowest test dose of o-dian taken for the FET studies. Interestingly, all the concentrations showed prominent redox peaks on the GCE/CL-08 and were noted to have higher peak currents and charge values. The calculated surface coverage Γo-dian values were 23.21, 27.16, 45.48, 46.57, 57.38 and 87.53 nmol cm−2, respectively for the above-mentioned concentrations. The subsequent calculated anodic peak current (ipa) values were 78.50, 80.50, 99.50, 128.00, 134.00 and 270.00 μA. The lowest chosen concentration itself is found to be toxic to the aquatic system as discussed in Section 3.1 and, therefore, the proposed electrode was suitable to adsorb and treat such a low concentration of o-dian at pH 2 PBS. A comparative study of the efficiency of o-dian uptake and water treatment using a well known and highly sensitive MWCNT modified electrode was also carried out. The typical cyclic voltammograms of numerous o-dian concentrations for the adsorption process on the GCE/MWCNT is shown in Fig. S2.† The results indicated that the MWCNT was not able to uptake o-dian at concentrations <15 mg L−1. The possible reason may be due to the lower surface area of the MWCNT compared to the CL-08 proposed in this study. These results indicated that super conductive carbon black is a highly sensitive and effective matrix for the electrochemical treatment via in situ electro-oxidation.
The curve fitting of the Langmuir isotherm model for the GCE/CL-08 surface covered with a monolayer of o-dian molecules was done with Origin 8 Advanced fitting tools for the above tested o-dian concentrations as illustrated in Fig. 4D. The saturation surface coverage (Γs) and adsorption constant (Ka) has been calculated using eqn (1)37 given below:
| Γ = (ΓsKaCe)/(1 + KaCe) | (1) |
3.5 Uptake and electrochemical treatment of o-dian from the real aquatic samples
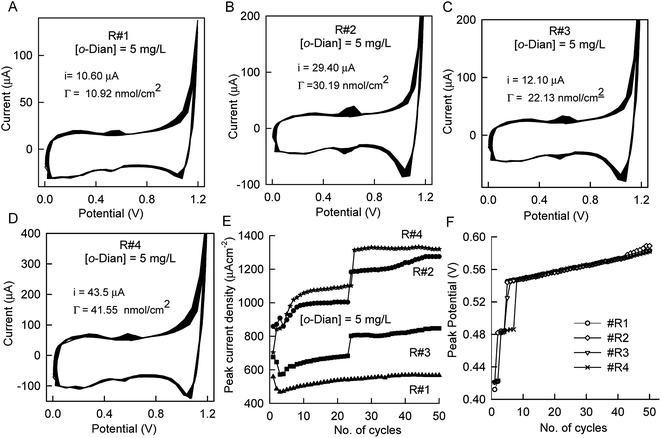
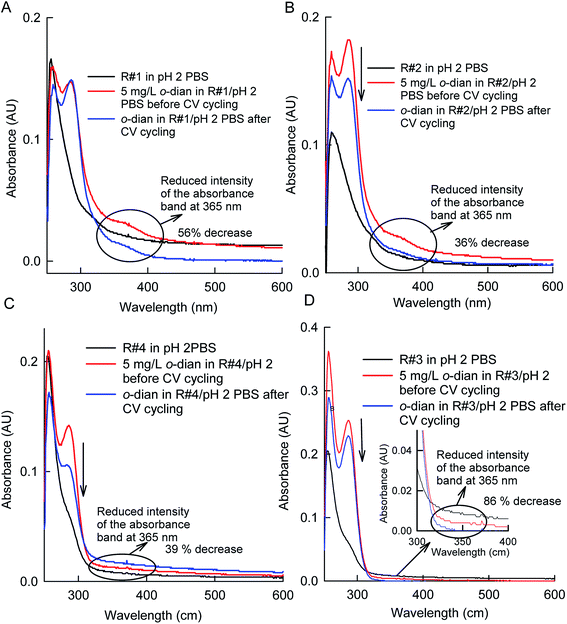
The GCE/CL-08 was subjected to 50 continuous potential cycles in real aquatic samples collected from a lake (R#1), river, (R#2) and ponds (R#3 and R#4). Fig. 5A–D shows the typical voltammograms of the real aquatic samples in the presence of 5 mg L−1 o-dian diluted pH 2 PBS under optimized conditions. The obtained i values after subtraction from the charging current were 10.60, 29.40, 12.10 and 43.50 μA and the calculated Γo-dian values were 10.92, 30.19, 22.13 and 41.55 nmol cm−2, respectively for samples R#1 to R#4. The current density (anodic peak current/surface area of the electrode, μA cm−2) values were calculated and the plot of current density from the 1st to the 50th potential cycle for 5 mg L−1 o-dian uptake and treatment using the GCE/CL-08 is shown in Fig. 5E. The results indicated that the current density increased with an increase in the number of potential cycles and tended to saturate at the 50th cycle. The variation in the current densities between the samples may be due to the tropical effect of the samples collected.In addition, the quantitative analysis of the o-dian treated real samples on the GCE/CL-08 has been analyzed using the UV-Vis spectrum before and after the potential cycling. Fig. 6A–D shows the UV-Vis spectra of the real samples (R#1 to R#4) diluted in the pH 2 PBS buffer before and after CV cycling for o-dian = 5 mg L−1. The characteristic o-dian peaks were observed at 287 nm and 363 nm, respectively. The reduction in the absorbance intensity at 363 nm after 50 potential cycles indicated that o-dian was electrochemically adsorbed in this work. As can be seen, the samples R#2, R#3 and R#4 show a reduction in intensity for absorbance at both 287 and 363 nm wavelengths. However, reduction in the peak at 287 nm for R#1 was minor for which the reason is unknown to us now. However, the electro-oxidized species peak at 363 nm has been reduced for all the real samples after the electrochemical treatment. The % decrease is calculated based on the peak intensity before and after treatment for the peak at 363 nm. The reduction of the absorbance peak was calculated to be 56, 36, 39 and 86% respectively for R#1, R#2, R#4 and R#3 for the electrochemically treated real samples.
Furthermore, it is been noticed that when there is an increase in o-dian concentration the whole peak is found raising from the background which can be noticed for the real samples R#1, 2 and 4. However, there was a slight decrease in the baseline for the real sample R#3 from the blank peak as seen in Fig. 6. All these reductions in absorbance intensity indicated that, during the electrochemical treatment, fractions of o-dian have been degraded during the electro-oxidation process from the solution. In addition, the dimer absorbance peak which was expected to be noticed at ∼430 nm29 was not seen in this work. This may be due to the low concentration of the dimer present in the electro-oxidized solution. Electro-oxidized o-dian (electrochemically treated o-dian) from four real samples were further studied on the survival of African catfish larvae in order to analyse the treatment efficiency.
3.6 The larvae toxicity assay after electrochemical treatment of o-dian
Electrochemically treated four real samples R#1 to R#4 (5 mg L−1 concentration of o-dian each) were subjected to a larvae toxicity assay under the same experimental conditions mentioned in Section 2.2 and 2.3. The lowest test dose was chosen as a model to examine the efficiency of the proposed CL-08 modified GCE in this work. The results on the survival of larvae are presented in Table 2, which indicate an increased survival rate of larvae for 24, 48 and 72 hpf of exposure. The survival rate was statistically significant (p < 0.05) in all four real samples after treatment. Statistically, no significant difference was observed in the hatching and survival rates of larvae in the pre- and post-control groups (p > 0.05). Thus, a new super conductive carbon black matrix was successfully demonstrated for the uptake of the o-dian pollutant from real aquatic samples via an in situ electro-oxidation process at the laboratory scale and was tested for treatment efficiency in vivo in this study.| Concentration (mg L−1) | Incubation period (h) | Hatching rate (%) | Survival rate of hatching at 24 h (%) | Survival rate of hatching at 48 h (%) | Survival rate of hatching at 72 h (%) |
|---|---|---|---|---|---|
| Control | 33.4 ± 1.2a | 89.2 ± 4.5a | 97.6 ± 3.9a | 97.6 ± 3.9a | 97.6 ± 3.9a |
| R#1 | 32.9 ± 2.3a | 62.2 ± 2.3b | 97.5 ± 4.2a | 92.9 ± 4.2a | 87.2 ± 4.2a |
| R#2 | 32.1 ± 3.2a | 64.2 ± 2.5b | 92.5 ± 4.8a | 91.1 ± 6.4a | 81.1 ± 6.4a |
| R#3 | 33.7 ± 3.2a | 66.2 ± 1.9b | 96.2 ± 4.9a | 89.5 ± 6.7a | 86.2 ± 4.7a |
| R#4 | 33.2 ± 3.0a | 63.2 ± 1.0b | 89.1 ± 4.4a | 89.3 ± 5.6a | 88.3 ± 6.6a |
| p value | >0.05 | <0.05 | >0.05 | >0.05 | >0.05 |
4. Conclusions
This study is unique in the following aspects: (i) the fish embryo toxicity assay revealed that a very low concentration of o-dianisidine (5 mg L−1) causes developmental abnormalities and mortality in C. gariepinus; (ii) a new matrix, super conductive carbon black, was successfully demonstrated at the laboratory scale for uptake and treatment of o-dian through an in situ electro-oxidation process and the detailed experimental analyses on the usage of CL-08 as an electrode for the practical application are also under progress; (iii) the proposed electrode system was highly efficient in oxidizing o-dian at a low concentration of 5 mg L−1 compared to the MWCNT from real aquatic samples and (iv) the electrochemical treatment of o-dian using GCE/CL-08 was efficient in increasing the survival rate of African catfish larvae. The applicability of CL-08 for the bulk treatment of o-dian in real samples will be optimized.Acknowledgements
SS thanks UTM, for providing a post-doctoral research fellowship, the Central Analysis Unit, Water Research Management Laboratory and Biodegradation Research Laboratory facilities. KM thanks AIMST University for providing facilities for conducting the toxicity study.References
- J. Jasnowska, M. Ligaj, B. Stupnicka and M. Filipiak, Bioelectrochemistry, 2004, 64, 85–90 CrossRef CAS PubMed.
- T. M. Lizier and M. V. B. Zanoni, Molecules, 2012, 17, 7961–7979 CrossRef CAS PubMed.
- W. Sun, H. Jiang and K. Jiao, J. Chem. Sci., 2005, 117, 317–322 CrossRef CAS.
- M. C. Icardo, J. V. G. Mateo and J. M. Calatayud, Analyst, 2001, 126, 2087–2092 RSC.
- A. Cvejic, J. Serbanovic-Canic, D. L. Stemple and W. H. Ouwehand, Haematologica, 2011, 96, 190–198 CrossRef PubMed.
- World Health Organization International Agency for Research on Cancer (IARC), Monographs on the evaluation of the carcinogenic risk of chemicals to humans: Some Aromatic Amines, Organic Dyes, and Related Exposures, France, Lyon, 2008, vol. 99 Search PubMed.
- NTP (National Toxicology Program), 3,3′-Dimethoxybenzidine and dyes metabolized to 3,3′-dimethoxybenzidine, Report on Carcinogens, Department of Health and Human Services, Public Health Service, Research Triangle Park, NC, U.S, 13th edn, 2014 Search PubMed.
- Directive 2002/61/EC of the European Parliament and of the Council of 19 July 2002 amending for the 19th time Council Directive 76/769/EEC relating to restrictions on the marketing and use of certain dangerous substances and preparations (azocolourants).
- GB18401-2010, National general safety technical code for textile products 2012, General Administration of Quality Supervision, Inspection and Quarantine of the People’s Republic of China, Standardization Administration of the People’s Republic of China (SAPRC).
- K. Brigden, I. Labunska, E. House, D. Santillo and P. Johnston, Hazardous chemicals in branded textile products on sale in 27 places during 2012, Greenpeace Research Laboratories Technical Report 06/2012, pp. 1–28 Search PubMed.
- K. Marimuthu, N. Muthu, R. Xavier, J. Arockiaraj, M. A. Rahman and S. Subramaniam, PLoS One, 2013, 8, e75545 CAS.
- D.-F. Feng, W.-X. Wu, N.-N. He, D.-Y. Chen and X.-Z. Feng, RSC Adv., 2013, 3, 17880–17886 RSC.
- Y.-P. Wang, X. Li, J.-Y. Xue, Y.-S. Zhang and X.-Z. Feng, RSC Adv., 2014, 4, 18541–18548 RSC.
- L. Y. Rizzo, S. K. Golombek and M. E. Mertens, et al., J. Mater. Chem. B, 2013, 1, 3918–3925 RSC.
- L. Evensen, P. L. Johansen and G. Koster, et al., Nanoscale, 2016, 8, 862–877 RSC.
- M. Crane and L. Maltby, Environ. Toxicol. Chem., 1991, 10, 1331–1339 CAS.
- S. E. Belanger, J. M. Rawlings and G. J. Carr, Environ. Toxicol. Chem., 2013, 32, 1768–1783 CrossRef CAS PubMed.
- Y.-J. Dai, Y.-F. Jia, N. Chen, W.-P. Bian, Q.-K. Li, Y.-B. Ma, Y.-L. Chen and D.-S. Pei, Environ. Toxicol. Chem., 2014, 33, 11–17 CrossRef CAS PubMed.
- M. K. S. Jeffries, A. E. Stultz, A. W. Smith, D. A. Stephens, J. M. Rawlings, S. E. Belanger and J. T. Oris, Environ. Toxicol. Chem., 2015, 34, 1369–1381 CrossRef CAS PubMed.
- C. A. Martínez-Huitle and S. Ferro, Chem. Soc. Rev., 2006, 35, 1324–1340 RSC.
- C. Tan, B. Xiang, Y. Li, J. Fang and M. Huang, Chem. Eng. J., 2011, 166, 15–21 CrossRef CAS.
- J.-F. Zhi, H.-B. Wang, T. Nakashima, T. N. Rao and A. Fujishima, J. Phys. Chem. B, 2003, 107, 13389–13395 CrossRef CAS.
- M. Panizza, C. Bocca and G. Cerisola, Water Res., 2000, 34, 2601–2605 CrossRef CAS.
- D. Rajkumar and K. Palanivelu, J. Hazard. Mater., 2004, 113, 123–129 CrossRef CAS PubMed.
- G. Chen, Sep. Purif. Technol., 2004, 38, 11–41 CrossRef CAS.
- C. C. Jara, D. Fino, V. Specchia, G. Saracco and P. Spinelli, Appl. Catal., B, 2007, 70, 479–487 CrossRef.
- A. M. Polcaro, S. Palmas, F. Renoldi and M. Mascia, Electrochim. Acta, 2000, 46, 389–394 CrossRef CAS.
- A. S. Kumar, S. Sornambikai, T. L. Deepika and J. M. Zen, J. Mater. Chem., 2010, 20, 10152–10158 RSC.
- S. Sundaram, M. Jagannathan, M. R. A. Kadir, S. Palanivel, T. Hadibarata and A. R. M. Yusoff, RSC Adv., 2015, 5, 45996–46006 RSC.
- K. Marimuthu, S. Nirmell and R. Xavier, INFOFISH international, 2012, 4, 28–32 Search PubMed.
- American Public Health Association (APHA), Standard Methods for the Examination of Water and Wastewater, District of Columbia, Washington, 1985, 16th edn, p. 1268 Search PubMed.
- M. H.-C. Chen, L.-C. Hsu, J.-L. Wu, C.-W. Yeh, J.-N. Tsai, Y.-C. Hseu and L.-S. Hsu, Environ. Toxicol., 2014, 29, 1428–1436 CrossRef CAS PubMed.
- G. Arslan, B. Yazici and M. Erbil, J. Hazard. Mater., 2005, 124, 37–43 CrossRef CAS PubMed.
- J. L. N. Xavier, E. Ortega, J. Z. Ferreira, A. M. Bernardes and V. Pérez-Herranz, Int. J. Electrochem. Sci., 2011, 6, 622–636 CAS.
- R. G. Compton and C. E. Banks, Understanding Voltammetry, Imperial College Press, London, 2007, 2nd edn, pp. 141–143 Search PubMed.
- D. A. C. Brownson and C. E. Banks, The Handbook of Graphene Electrochemistry, Springer-Verlag, London, 2014, pp. 70–75 Search PubMed.
- O. Makhotkina and P. A. Kilmartin, Anal. Chim. Acta, 2010, 668, 155–165 CrossRef CAS PubMed.
Footnote |
| † Electronic supplementary information (ESI) available. See DOI: 10.1039/c6ra00158k |
| This journal is © The Royal Society of Chemistry 2016 |

