The effect of Cu loading on Ni/carbon nanotubes catalysts for hydrodeoxygenation of guaiacol†
A. B. Dongil*a,
B. Bachiller-Baezab,
I. Rodríguez-Ramosb,
J. L. G. Fierrob and
N. Escalona*cd
aUniversidad de Concepción, Facultad de Ciencias Químicas, Casilla 160C, Concepción, Chile. E-mail: adongil@udec.cl; Tel: +56-41-2207236
bInstituto de Catálisis y Petroquímica, CSIC, Cantoblanco, 28049 Madrid, Spain
cDepartamento de Ingeniería Química y Bioprocesos, Escuela de Ingeniería, Pontificia Universidad Católica de Chile, Avenida Vicuña Mackenna 4860, Macul, Santiago, Chile
dFacultad de Químicas, Pontificia Universidad Católica de Chile, Chile. E-mail: neescalona@ing.puc.cl; Tel: +56-2-23544927
First published on 7th March 2016
Abstract
Commercial carbon nanotubes (CNT), were used as supports to prepare Ni/CNT catalysts with a 15 wt% Ni loading and NiCux/CNT catalysts with Cu loadings of x: 1.5, 2.25, 3.0 and 3.75 wt% were prepared. The catalysts were characterized by N2 physisorption, H2-temperature programmed reduction (TPR), transmission electron microscopy (TEM), STEM-HAADF and X-ray photoelectron spectra (XPS), and they were evaluated in the conversion of guaiacol at 573 K and 5 MPa H2 pressure for 4 h in a batch reactor. The characterization showed that Ni–Cu alloys were formed which existed along with Ni, Cu and NiO entities. The Ni metallic particle size was lower upon increasing Cu content, however the increased proportion of NiO species and the coverage of Ni sites with Cu diminished the intrinsic activity. The addition of Cu also decreased the hydrogenolysis and deoxygenation ability for the catalysts up to 3 wt% of Cu, which can be related to the lower size of Ni ensembles. Beyond that percentage, the selectivity was modified and it was attributed to changes in the Ni dispersion.
1. Introduction
The depletion of fossil fuels and environmental concerns have prompted research to look for alternative sources of energy and chemicals. In this sense, non-edible biomass such as lignocellulosic residues have received considerable interest through the fast pyrolysis technology to produce bio-oil. However, the produced bio-oil holds a high O/C ratio, leading to a high viscosity, low heating value, corrosivity, incomplete volatility and thermal instability. The catalytic hydrotreatment of the bio-oil, i.e. hydrodeoxygenation (HDO), has been widely employed to either lower (to be used as a chemical feedstock) or completely eliminate the oxygen composition (to be used as a fuel component).1,2 HDO of model compounds is usually performed at high temperature (175–400 °C) and high hydrogen pressure (100–300 bar) employing a solid catalyst. The most studied catalysts are hydrodesulfurization (HDS) catalysts such as sulfided CoMo or NiMo oxides and group 10 type catalysts. The former are less expensive and are capable of removing the oxygen while minimizing hydrogen consumption, but require activation by a sulfidation treatment. This might lead to sulfur leaching, which deactivates the catalyst and results in sulfur contamination of the products.3 Noble metal catalysts demonstrated excellent activity however their selectivity to aromatics deoxygenated compounds at the higher temperatures required lead to relatively high amounts of methane and coke formation causing deactivation of the catalysts. Additional disadvantages of noble metals are their high cost and the excessive hydrogen consumption stemming from their high hydrogenation activity.4 For these reasons, several alternatives to these catalysts have been explored with special interest on catalysts that uses less expensive and earth-abundant elements. Nickel catalysts, have been studied by several groups for HDO reactions with promising results compared to other non-noble metals.5–8 The main drawback of Ni catalysts is their low selectivity towards dehydrogenation which can be improved by using bimetallic catalysts.9 In this sense, it has been reported that the addition of Cu to Ni catalysts may improve the catalyst performance for the hydrotreatment of bio-oil and its model compounds.10 Some authors studied the effect of adding a certain amount of Cu to Ni supported over Al2O3,11,12 SiO2,13 SiO2–ZrO2,14 CeO2 and ZrO2.7 In general the hydrogenation yield was higher when Cu was added, however the trend in the HDO yield varied depending on the support. Other authors studied the effect of Cu loading to Ni catalysts supported on SiO2,15 Al2O3 (ref. 16) and ZrO2.17 Overall, the activity was enhanced by adding small amounts of Cu but then, it decreased upon increasing Cu loading, however the HDO yield followed different trend: a volcano-type dependency for ZrO2,17 a continuous decrease for Al2O3 upon increasing Cu loading16 and it was independent for SiO2 except at low (5%) and high (85%) Cu loading where the HDO yield was higher.15 Besides influencing the selectivity and activity, copper can prevent the formation of carbon deposits and the sintering of the Ni nanoparticles as well as decreasing the reduction temperature of the NiO.15–17The support seems to play an important role on the catalytic performance as it influences the acidity of the catalysts. In order to eliminate the effect of the support and study the influence of Cu loading to Ni catalysts we propose to employ carbon nanotubes (CNT). Besides their high thermal conductivity, accessibility of the active phase, good chemical stability in aggressive media, and the absence of any microporosity, they possess a hydrophobic surface that promotes water desorption, which may favor the HDO reaction.18 However, carbon nanostructures have scarcely been employed in the HDO of bio-oil model compounds and few examples can be found.19 We have recently proved the better activity on the HDO of guaiacol of Ni/CNT catalyst compared to Ni/activated carbon.20
Thus, the purpose of the present study was to investigate the effect of Cu content on Ni/CNT catalysts on the activity and selectivity of the hydrotreatment of guaiacol.
2. Experimental
2.1 Catalysts
Carbon nanotubes Nanocyl 3100 (95% purity) CNT were used as parent support. The catalysts were prepared by wet impregnation in acetone using the corresponding amount of Ni(NO3)2 (99.9%, Sigma-Aldrich) to obtain 15 wt% Ni, with 10 ml of solution per gram of CNT. After stirring for 12 h, the solvent was removed under vacuum. Finally, the materials were treated at 623 K for 5 h under flowing He (50 ml min−1). The samples were previously reduced under H2 (50 ml min−1) at 733 K for 4 h and transferred carefully to the reactor limiting the exposition to air. Then, the corresponding amount of Cu(NO3)2·3H2O (99.9%, Sigma-Aldrich) to obtain 1.5; 2.25; 3.0 and 3.75 wt% of Cu corresponding to Cu/Ni atomic ratios of 0.009, 0.014, 0.018, 0.023 was added. According to this procedure six catalysts were prepared which are labeled as Ni/CNT, NiCu1.5/CNT, NiCu2.25/CNT, NiCu30/CNT, NiCu3.75/CNT and Cu/CNT.2.2 Characterization
The specific surface area (SBET) and pore volume (Vp) of the catalysts were determined from nitrogen isotherms at 77 K using a Micromeritics ASAP 2010 equipment. Prior to the measurements, the samples were degassed at 473 K for 2 h.The crystalline phases present in these samples were determined from the X-ray diffraction patterns (XRD). The diffractograms were recorded on a Polycrystal X'Pert Pro PANalytical apparatus using Ni-filtered Cu Kα radiation (λ = 0.15406 nm) and a graphite monochromator. For each sample, Bragg's angles between 4° and 70° were scanned at a rate of 0.04 deg s−1.
Transmission electron microscopy (TEM) and scanning transmission electron microscopy high-angle annular dark-field (STEM-HAADF) images were measured using a JEOL JEM 2100F field emission electron gun microscope operated at 200 kV and equipped with an energy-dispersive X-ray detector. The samples were ground and a small amount was suspended in ethanol solution using an ultrasonic bath. Some drops were added to the gold grid (Aname, Lacey carbon 200 mesh) and the ethanol was evaporated at room temperature before introduce in the microscope. The scanning transmission electron microscopy (STEM) was done using a spot size of 1 nm. X-ray energy dispersive spectroscopic (XEDS) mapping analysis was carried out with the help of an Oxford Instruments Inca software package. Around 200 particles were measure to estimate the metal particle size distribution.
Prior to the characterization by XRD and TEM the catalysts were stabilized in N2 atmosphere after their reduction at 723 K to prevent the oxidation of reduced metallic species.
X-ray photoelectron spectra (XPS) of the catalysts were obtained on a MicrotechMultilb 3000 spectrometer, equipped with a hemispherical electron analyzer and MgKα (hv = 1253.6 eV) photon source. Prior to the analysis, the catalyst samples were in situ reduced under the same conditions employed before the catalytic tests. The binding energies (BE) were referenced to the Al 2p level of the alumina support at 74.4 eV. An estimated error of ±0.1 eV can be assumed for all measurements. Intensities of the peaks were calculated from the respective peak areas after background subtraction and spectrum fitting by a combination of Gaussian/Lorentzian functions. The relative surface atomic ratios were determined from the corresponding peak intensities, corrected with tabulated sensitivity factors, with a precision of ±7%.
Temperature programmed reduction (TPR) studies were carried out in a quartz cell on a conventional system equipped with a thermal conductivity detector. In each experiment, 25 mg of the sample was heated under 5% H2/Ar with a flow of 50 cm3 min−1. The sample was heated at a rate of 10 °C min−1 from 298 to 1323 K.
2.3 Hydrodeoxygenation reaction
 | (1) |
 | (2) |
Reaction blank tests were performed with the bare support, CNT, and no activity was observed during the 4 h reaction time.
3. Results
3.1 Characterization
The nitrogen adsorption/desorption isotherms at 77 K of the catalysts were performed to study their textural properties and the results are shown in Table 1. The estimated values of BET surface areas, Vmicro and Vmeso show that the catalysts own mostly mesopores. For the NiCux/CNT series, it can be observed a continuous decrease of the BET surface area for the catalysts as the amount of copper increases, and the same trend is observed for both the microporous and the mesoporous volumes.| Sample | SBET (m2 g−1) | Vmicro (cm3 g−1) | Vmeso (cm3 g−1) | Vt (cm3 g−1) | Crystallite sizea (nm) | dTEMb (nm) |
|---|---|---|---|---|---|---|
| a Estimated by the (200) reflection using the Scherrer equation.b Estimated from TEM images. | ||||||
| CNT | 300 | 0.003 | 1.762 | 1.765 | — | — |
| Ni/CNT | 241 | 0.006 | 1.078 | 1.084 | 13.9 | 14.2 |
| NiCu1.5/CNT | 260 | 0.007 | 1.035 | 1.042 | 5.0 | 6.8 |
| NiCu2.25/CNT | 237 | 0.006 | 1.062 | 1.068 | 5.4 | — |
| NiCu3.0/CNT | 229 | 0.009 | 1.054 | 1.063 | 4.8 | 6.4 |
| NiCu3.75/CNT | 209 | 0.005 | 0.971 | 0.976 | 7.7 | 8.9 |
| Cu/CNT | 262 | 0.010 | 0.890 | 0.900 | — | — |
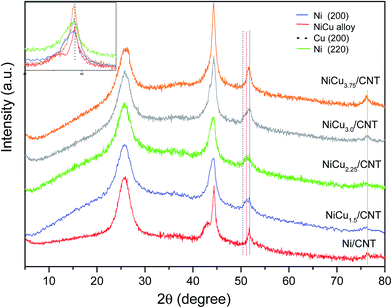
The XRD diffraction patterns of the catalysts are shown in Fig. 1. All the catalysts displayed the diffraction peak at 26.1° corresponding to the hkl diffraction (002) of graphite. The monometallic catalyst Ni/CNT also displayed the characteristic Ni0 peaks at 44.4°, which overlaps with that of the (100) diffraction of graphite at 43.3°; at 51.5° and 76.4° corresponding to the diffractions in the (111), (200) and (220) crystalline planes of the fcc phase, (JCPDS 04-0850). For the bimetallic catalysts some differences can be observed: the diffraction corresponding to NiO is slightly shifted to lower angles, i.e. 44.3°, and the diffraction peaks are wider compared to the monometallic catalyst. These differences have been explained by the formation of Ni–Cu alloys (JCPDS 47-1406)12,21 or, at least, as will be later confirmed by H2-TPR and XPS, an intimate contact between Ni and Cu.22 The presence of individuals Cu0 entities whose diffraction peaks corresponding to the (111) and (200) planes appear at 43.3° and 50.4° (JCPDS 04-0836) cannot be disregarded, though the small percentage of Cu compared to Ni and the absence of the diffraction peak of the (220) plane at 74.1° suggest that the contribution of Cu0 in the observed peaks is negligible. Moreover a small peak at 37.1° (JCPDS 04-0835) ascribed to NiO is insinuated in the bimetallic samples. In addition, the low intensity of the diffraction peak at 76.4° ascribed to Ni0 for the bimetallic catalysts with Cu loading of 1.5–2.25 wt% which clearly increases for NiCu3.75/CNT seem to indicate that the Ni particle size decreases by adding copper until a certain loading. The particle size of Ni/CNT and the bimetallic catalysts were estimated by the Scherrer equation using the FWHM values of the (200) diffraction to eliminate the contribution of graphite. The values are shown in Table 1 and confirmed that the particle size decreases by adding Cu, though the size is similar for the bimetallic catalysts, except for NiCu3.75/CNT which clearly displays a larger size in agreement with the qualitative observations.
To further identify the interaction between Ni and Cu and the distribution of the nanoparticles over the support, STEM-EDS of the catalyst NiCu3.0/CNT as illustrative example was also performed. The STEM-EDS mapping images, in Fig. 2a, showed the presence of Ni–Cu alloy with a homogenous distribution of Ni and Cu in the single alloy particle, along with pure Ni nanoparticles in agreement with the XRD patterns. The STEM-EDS line-scanning spectra, also showed individual Cu nanoparticles. Therefore the microscopy identified the presence of Ni, Cu and Ni–Cu alloys. The average particle sizes were estimated from the TEM images and the values, in Table 1, agree quite well with those obtained by XRD.
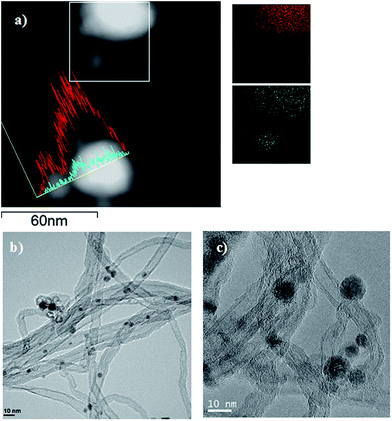 | ||
| Fig. 2 (a) STEM-EDS mapping images of the selected area (inside the square) and line Ni (blue), Cu (red); (b) and (c) TEM images of the reduced NiCu3.0/CNT catalyst. | ||
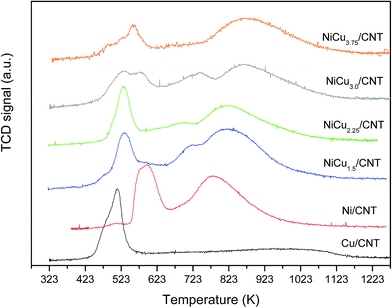
The H2-TPR profiles of the catalysts are shown in Fig. 3. It can be observed that the monometallic catalysts Ni/CNT and Cu/CNT displayed a low temperature peak at 595 and 510 K respectively. The profiles of the bimetallic catalysts also showed a reduction peak at low temperature at around 530 K which, for the samples NiCu3.0/CNT and NiCu3.75/CNT, comes along with an additional contribution at 560–574 K. In literature, the reduction of bulk NiO has been observed at 638 K (ref. 23 and 24) which is shifted to different temperatures depending on the support, particle size and/or location of the particles.25,26 For the Ni/CNT and bimetallic catalysts, the first reduction peak would correspond to the reduction of NiO and the temperature at which it appears is in the range of previous reported values.27,28 As expected, considering the lower reduction temperature of copper oxide compared to nickel oxide, the reduction of NiO takes places at lower temperature for the Cu-containing catalysts, this confirming the formation of the Ni–Cu alloy.15,29 Nonetheless, the appearance of a second contribution in this peak for the samples NiCu3.0/CNT and NiCu3.75/CNT suggest a different effect of Cu to the Ni catalysts by further increasing the Cu content. An additional reduction peak with different intensities is observed at medium temperatures, 710–740 K, for Cu-containing samples 1.5–3 wt%, which has been ascribed to the reduction of free NiO clusters with weak interaction with the support and formed during the thermal treatments.30,31 Moreover, the catalyst Ni/CNT displayed a high temperature reduction peak at 780 K which is shifted to higher temperatures for the bimetallic samples. Besides the reduction of NiO with different interaction with the support, this peak would include the H2 consumption corresponding to the methanation of the support by the nickel nanoparticles.23,32 The shift to higher temperature upon increasing the Cu content can be an indication of the lower ability of the Ni nanoparticles to catalyze the methanation when Ni–Cu alloys are formed.33 Therefore, the H2-TPR results confirmed the interaction between Ni and Cu in agreement with the XRD and TEM analyses.
Analyses of the XPS spectra of the catalysts were performed. In Fig. 4 the Ni 2p spectra of the catalysts are shown. All the catalysts displayed a doublet centered at 853.0 and 870.3 eV corresponding to the Ni 2p3/2 and Ni 2p1/2 transition respectively, with low-intensity satellites.14,16 The Ni 2p3/2 region could be deconvoluted in two components for all the samples with binding energies in the ranges 852.8–853.1 eV and 855.0–855.6 eV, and the proportion of each component is included in brackets. The component at the lower binding energy corresponds to Ni0 and the component at higher binding energy to Ni2+ and it is assigned to NiO.34,35 These results indicate that under the reduction conditions employed a certain proportion of NiO was still present. Interestingly, the bimetallic catalysts displayed a higher proportion of NiO compared to the monometallic Ni/CNT but its proportion is similar for the NiCux/CNT catalysts. It is known that NiO is reduced at lower temperature in Ni–Cu alloys16,22 as we have confirmed by H2-TPR. However, as also the performed H2-TPR showed, in the bimetallic catalysts took place the formation of NiO clusters with weak interaction with the support whose reduction temperature is similar to bulk NiO. The formation of these entities during the hydrogen thermal treatment was somehow favored when Cu was added, this leading to a lower reduction degree of the bimetallic catalysts compared to the monometallic Ni/CNT which is apparently independent of the Cu content. The discrepancies found between the XPS analyses and XRD profiles, which showed barely no diffractions ascribed to metal oxides, could be explained by a small particle size of the oxides which would be below the detection limit of the XRD, i.e. 4 nm. Furthermore the maximum of Ni 2p3/2 region was shifted to lower binding energies in the Cu-containing samples compared to Ni/CNT except for NiCu3.75/CNT. This slight change is significant as it can be related to the formation of Ni–Cu alloys.15,36 On the other hand, the Cu 2p3/2 region displayed only one contribution at 932.7–932.8 eV. This contribution is in the range of the values reported for Cu0 and Cu1+ whose binding energies are too close.37 To elucidate the chemical state of copper, the modified Auger parameter, α, can be used. Therefore, the Auger parameter of the NiCu1.5/CNT catalyst was evaluated as reference and the spectrum region is shown in the ESI.† The obtained value was 1852.3 eV, which corresponds to that of metallic Cu, in line with the reduction temperature observed for copper in the H2-TPR profile.13,15,38
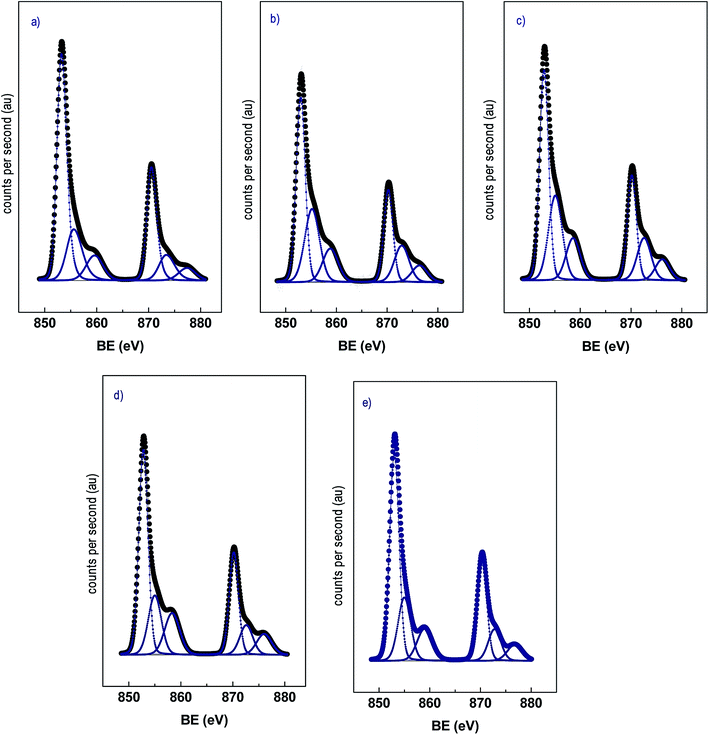 | ||
| Fig. 4 XPS spectra of the Ni 2p region for the reduced catalysts (a) Ni/CNT, (b) NiCu1.5/CNT (c) NiCu2.25/CNT (d) NiCu3.0/CNT (e) NiCu3.75/CNT. | ||
The relative amounts of the different species were calculated from the corresponding peak areas divided by the sensitivity factors, and the most relevant data are summarized in Table 2. It can be observed that, despite the same nominal loading of Ni, the Ni/C ratio increased upon increasing Cu content for all the catalysts except for NiCu3.75CNT and only slightly for NiCu3.0CNT. While this increment can be explained by the stabilization of smaller Ni/NiO nanoparticles by Cu, as previously reported for other Ni–Cu catalysts,16 the lower Ni/C ratio for NiCu3.75CNT can be attributed to the formation of aggregates as the XRD showed.
| C 1s | Cu 2p3/2 | Ni 2p3/2 | Cu/Ni | Ni/C | Cu/C | |
|---|---|---|---|---|---|---|
| Ni/CNT | 284.8 (77) | — | 853.1 (66) | — | — | — |
| 286.2 (21) | — | 855.6 (34) | — | 0.0140 | — | |
| 287.7 (2) | — | — | — | — | — | |
| Cu/CNT | 284.8 (76) | — | — | — | — | — |
| 286.2 (21) | 932.7 | — | — | — | 0.058 | |
| 287.8 (3) | — | — | — | — | — | |
| NiCu1.5/CNT | 284.8 (74) | — | — | — | — | — |
| 286.2 (22) | 932.7 | 852.9 (57) | 0.2381 | 0.0210 | 0.005 | |
| 287.8 (4) | — | 855.1 (43) | — | — | — | |
| NiCu2.25/CNT | 284.8 (75) | — | — | — | — | — |
| 286.2 (20) | 932.6 | 852.9 (54) | 0.3288 | 0.0365 | 0.012 | |
| 287.8 (5) | — | 855.2 (46) | — | — | — | |
| NiCu3.0/CNT | 284.8 (76) | — | — | — | — | — |
| 286.2 (21) | 932.7 | 852.8 (58) | 0.3596 | 0.0445 | 0.016 | |
| 287.8 (3) | — | 855.0 (42) | — | — | — | |
| NiCu3.75/CNT | 284.8 (78) | — | — | — | — | — |
| 286.2 (18) | 932.8 | 853.0 (59) | 1.3291 | 0.0158 | 0.021 | |
| 287.7 (4) | — | 855.0 (41) | — | — | — |
In summary, the characterization showed that by adding Cu to Ni/CNT catalyst, Ni–Cu alloys are formed. The particle size decreases upon increasing Cu content up to a 3 wt% Cu loading. Moreover, a higher proportion of NiO was observed in the bimetallic samples, although the reduction temperature was lower than for the monometallic Ni/CNT. These results suggest that, in the studied system, copper loadings above 3 wt% cannot be further dissolve in the nickel lattice, this limiting the formation of Ni–Cu alloys and increasing the particle size.
3.2 Reaction results
Fig. 5 shows the evolution of the conversion of guaiacol and products yield over Ni/CNT and NiCux/CNT catalysts. The monometallic catalyst Cu/CNT showed very low conversion and the figure has been omitted. The main reaction products obtained over all the catalysts were cyclohexanol, cyclohexane, methoxycyclohexanol and cyclohexene. As side products, the formation of cyclohexanone, BTX (benzene, toluene and xylene) and lights (mainly methanol) was observed. Moreover, the formation of cyclohexanone, methoxycyclohexanol and cyclohexanol increased and then decreased with time, this indicating that these compounds are intermediates products. These results are consistent with guaiacol conversion schemes proposed by Dongil et al.20 for Ni/Carbon catalysts, which was adapted from Laurent and Delmon,39 Bui et al.40,41 and Nimmanwudipong et al.42 and it is shown in Fig. 6. On the basis of this reaction scheme, the guaiacol can be transformed by direct deoxygenation route (DDO) to form anisole, by direct demethoxylation way (DMO) to form phenol and by hydrogenation way (HYD) to form methoxycyclohexanone and methoxycyclohexanol respectively. The cyclohexanone can be formed from methoxycyclohexanone DMO or by phenol HYD. The cyclohexanol can be formed from hydrogenation of cyclohexanone or methoxycyclohexanol DMO. On the other hand, benzene can be formed by DDO of phenol or by DMO of anisole. The cyclohexene can be formed by HYD of benzene or dehydration (DHY) of cyclohexanol. Furthermore, the formation of toluene takes place through the methylation route (ME) and then DDO of phenol, while xylene can be formed by ME of toluene.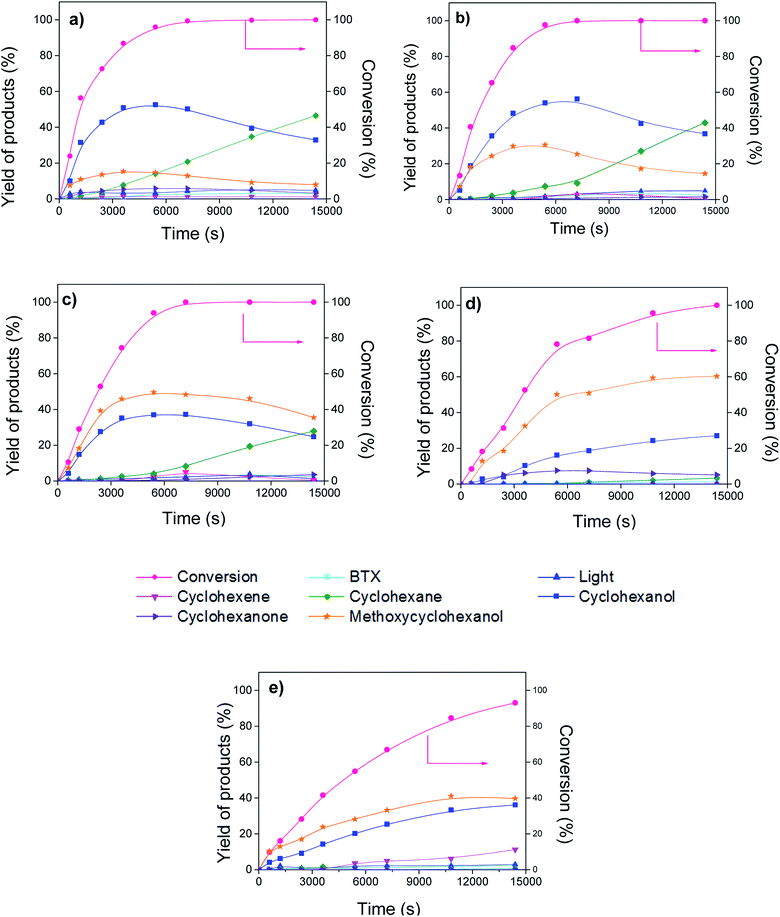 | ||
| Fig. 5 Conversion of guaiacol and yield of products vs. time, (a) Ni/CNT, (b) NiCu1.5/CNT (c) NiCu2.25/CNT (d) NiCu3.0/CNT (e) NiCu3.75/CNT. | ||
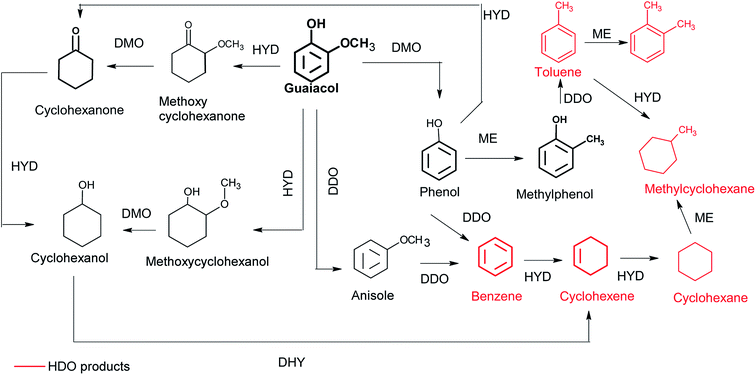 | ||
| Fig. 6 Reaction scheme for the conversion of guaiacol.39 | ||
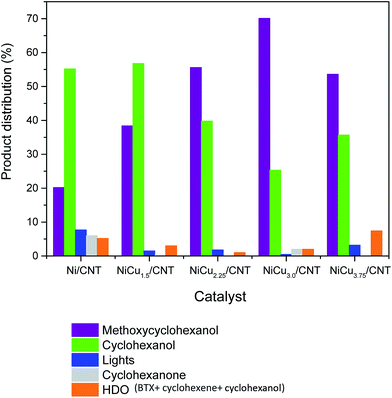
The products distribution calculated at 50% of guaiacol conversion over Ni/CNT and NiCux/CNT catalysts is shown in Fig. 7. It can be observed that the addition of Cu modifies the products distribution: cyclohexanol decreases and methoxycyclohexanol increases upon increasing the Cu content, this suggesting that Cu decreases the DMO pathway. As long as the selectivity to HDO products is concerned, the bimetallic catalysts showed less yield to HDO products than Ni/CNT up to 3 wt% of Cu loading. The HDO activity depends on the feasibility to activate C–O bonds whose scission takes place on electron donor sites, where the molecule adsorbs vertically.43 According to the characterization the size of the Ni–Cu alloys ensembles is smaller than that of pure Ni and, thus, the electron donating properties from Ni d-orbitals are reduced compared to monometallic Ni catalysts, this limiting the adsorption strength of the oxygenated compounds and therefore its activation.44 The product distribution also showed that the percentage of light products is lower upon increasing Cu content up to 3 wt%, and it increased again for the NiCu3.75CNT catalyst, which indicates that hydrogenolysis of the C–C bond is hampered by the addition of Cu, this reducing the formation of coke and therefore the catalyst deactivation. It has been reported that the scission of C–C bonds is favored over larger Ni nanoparticles due to the adsorption of the hydrocarbon intermediates on bigger particles.14 The characterization performed showed that, in the studied system, the addition of Cu increased the dispersion of Ni up to 3 wt% Cu loading, therefore our results are in quite good agreement with previous literature results.
The initial rates obtained for the guaiacol hydrotreatment are summarized in Table 3. The values show that the higher catalytic activity was obtained on the catalyst without Cu promotion, and that the activity decreases gradually upon increasing the Cu content. In literature it has been reported that bimetallic catalysts are more active than monometallic Ni at the lowest investigated Cu loading, but then the activity decreases with increasing Cu content.15–17 The better performance of Ni–Cu catalysts has been explained by the exposure of more surface Ni atoms15,16 or by an optimal adsorption strength of H2 over the Ni–Cu alloy at certain Cu loading.17 Our results showed that the Ni–Cu alloy was formed and, according to the XPS results, the proportion of Ni surface atoms was higher on the bimetallic catalysts. However, the presence of NiO free particles was promoted by the addition of Cu and these oxides particles are not active in the reaction, which would result in a lower activity. Moreover, the reaction proceeds via the hydrogenation of the aromatic ring which takes place in electron acceptor sites where the reactant adsorbs parallel to the surface. The presence of smaller particles would be unfavorable to follow this path which may in turn lower the activity.43 However, the activity is also lower for the catalyst with the highest Cu loading, which displayed a larger particle size than the other bimetallic catalysts. For this sample, it is plausible that the non-dissolved Cu particles are located on the most active sites of Ni, this decreasing the activity as it has been reported for other bimetallic systems.45,46
4. Conclusions
We have prepared a series of bimetallic Ni–Cu catalysts with different loadings of Cu supported on carbon nanotubes, and we have studied their catalytic performance in the hydrodeoxygenation of guaiacol, a lignin model compound. The characterization performed showed that by adding Cu, Ni–Cu alloys were formed which existed along with Ni and Cu individual entities. The presence of NiO was also observed by XRD and XPS in a higher proportion for the bimetallic catalysts compared to the monometallic catalyst. The addition of Cu favored the stabilization of smaller Ni nanoparticles and decreased the reduction temperature of Ni. However, NiO free clusters were formed and these entities were more difficulty reduced as the NiO/Ni ratio obtained by XPS confirmed.It was observed that the intrinsic activity of the catalysts decreased upon increasing the Cu content. This effect can be explained by the loss of metallic Ni sites due to the increasing proportion of NiO and the coverage by Cu; and by the unfavorable adsorption of the aromatic ring over smaller nanoparticles. Concerning the selectivity, the results showed a decrease in the formation of HDO and light products by adding Cu which could be also explained by the limited activation of the C–O and C–C bonds in the smaller Ni nanoparticles. The different selectivity has been observed for the bimetallic samples up to a 3 wt% Cu loading. Beyond that Cu percentage, the trend changes, and the percentage of lights and HDO products increased, which according to the characterization can be explained by the formation of Ni agglomerates.
Acknowledgements
The authors acknowledge the financial support by CONICYT-FONDECYT grant 1140528, Fondecyt Postdoctoral grants 3130483 and PFB-27 grants. Financial support of the Spanish Ministerio de Economía y Competitividad by project CTQ2014-52956-C3-3-R is also acknowledge.References
- A. V. Bridgwater, Chem. Eng. J., 2003, 91, 87–102 CrossRef CAS
.
- J. Zakzeski, P. C. A. Bruijnincx, A. L. Jongerius and B. M. Weckhuysen, Chem. Rev., 2010, 110, 3552–3599 CrossRef CAS PubMed
.
- M. Saidi, F. Samimi, D. Karimipourfard, T. Nimmanwudipong, B. C. Gates and M. Reza Rahimpour, Energy Environ. Sci., 2014, 7, 103–129 CAS
.
- X. Zhu, L. L. Lobban, R. G. Mallinson and D. E. Resasco, J. Catal., 2011, 281, 21–29 CrossRef CAS
.
- P. M. Mortensen, J.-D. Grunwaldt, P. A. Jensen and A. D. Jensen, ACS Catal., 2013, 3, 1774–1785 CrossRef CAS
.
- Y. Yang, C. Ochoa-Hernández, V. A. de la Peña O'Shea, P. Pizarro, J. M. Coronado and D. P. Serrano, Appl. Catal., B, 2014, 145, 91–100 CrossRef CAS
.
- S. Echeandia, P. L. Arias, V. L. Barrio, B. Pawelec and J. L. G. Fierro, Appl. Catal., B, 2010, 101, 1–12 CrossRef CAS
.
- Y. Li, X. Yang, L. Zhu, H. Zhang and B. Chen, RSC Adv., 2015, 5, 80388–80396 RSC
.
- X. Yu, J. Chen and T. Ren, RSC Adv., 2014, 4, 46427–46436 RSC
.
- D. M. Alonso, S. G. Wettstein and J. A. Dumesic, Chem. Soc. Rev., 2012, 41, 8075–8098 RSC
.
- H. P. Reddy Kannapu, C. A. Mullen, Y. Elkasabi and A. A. Boateng, Fuel Process. Technol., 2015, 137, 220–228 CrossRef CAS
.
- V. A. Yakovlev, S. A. Khromova, O. V. Sherstyuk, V. O. Dundich, D. Y. Ermakov, V. M. Novopashina, M. Y. Lebedev, O. Bulavchenko and V. N. Parmon, Catal. Today, 2009, 144, 362–366 CrossRef CAS
.
- M. V. Bykova, D. Y. Ermakov, V. V. Kaichev, O. A. Bulavchenko, A. A. Saraev, M. Y. Lebedev and V. A. Yakovlev, Appl. Catal., B, 2012, 113–114, 296–307 CrossRef CAS
.
- X. Zhang, T. Wang, L. Ma, Q. Zhang, Y. Yu and Q. Liu, Catal. Commun., 2013, 33, 15–19 CrossRef CAS
.
- S. A. Khromova, A. A. Smirnov, O. A. Bulavchenko, A. A. Saraev, V. V. Kaichev, S. I. Reshetnikov and V. A. Yakovlev, Appl. Catal., A, 2014, 470, 261–270 CrossRef CAS
.
- A. R. Ardiyanti, S. A. Khromova, R. H. Venderbosch, V. A. Yakovlev and H. J. Heeres, Appl. Catal., B, 2012, 117–118, 105–117 CrossRef CAS
.
- Q. Guo, M. Wu, K. Wang, L. Zhang and X. Xu, Ind. Eng. Chem. Res., 2015, 54, 890–899 CrossRef CAS
.
- P. Serp and E. Castillejos, ChemCatChem, 2010, 2, 41–47 CrossRef CAS
.
- H. Ohta, H. Kobayashi, K. Hara and A. Fukuoka, Chem. Commun., 2011, 47, 12209–12211 RSC
.
- A. B. Dongil, I. T. Ghampson, R. García, J. L. G. Fierro and N. Escalona, RSC Adv, 2016, 6, 2611–2623 RSC
.
- O. Arbeláez, T. R. Reina, S. Ivanova, F. Bustamante, A. L. Villa, M. A. Centeno and J. A. Odriozola, Appl. Catal., A, 2015, 497, 1–9 CrossRef
.
- S. P. Patil, J. V. Pande and R. B. Biniwale, Int. J. Hydrogen Energy, 2011, 38, 15233–15241 CrossRef
.
- Q. Ma, D. Wang, M. Wu, T. Zhao, Y. Yoneyama and N. Tsubaki, Fuel, 2013, 108, 430–438 CrossRef CAS
.
- R. Buitrago-Sierra, J. Ruiz-Martínez, J. C. Serrano-Ruiz, F. Rodríguez-Reinoso and A. Sepúlveda-Escribano, J. Colloid Interface Sci., 2012, 383, 148–154 CrossRef CAS PubMed
.
- S. Lu, C. Zhang and Y. Liu, Int. J. Hydrogen Energy, 2011, 36, 1939–1948 CrossRef CAS
.
- H. Yang, S. Song, R. Rao, X. Wang, Q. Yu and A. Zhang, J. Mol. Catal. A: Chem., 2010, 323, 33–39 CrossRef CAS
.
- H. Liu, H. Wang, J. Shen, Y. Sun and Z. Liu, Catal. Today, 2008, 131, 444–449 CrossRef CAS
.
- P. Burattin, M. Che and C. Louis, J. Phys. Chem. B, 2000, 104, 10482–10489 CrossRef CAS
.
- L. De Rogatis, T. Montini, B. Lorenzut and P. Fornasiero, Energy Environ. Sci., 2008, 1, 501–509 CAS
.
- L. F. Bobadilla, S. Palma, S. Ivanova, M. I. Domínguez, F. Romero-Sarria, M. A. Centeno and J. A. Odriozola, Int. J. Hydrogen Energy, 2013, 38, 6646–6656 CrossRef CAS
.
- A. Zhao, W. Ying, H. Zhang, H. Ma and D. Fang, Catal. Commun., 2012, 17, 34–38 CrossRef CAS
.
- A. Nieto-Márquez, S. Gil, A. Romero, J. L. Valverde, S. Gómez-Quero and M. A. Keane, Appl. Catal., A, 2009, 363, 188–198 CrossRef
.
- E. T. Saw, U. Oemar, X. R. Tan, Y. Du, A. Borgna, K. Hidajat and S. Kawi, J. Catal., 2014, 314, 32–46 CrossRef CAS
.
- V. M. Shinde and G. Madras, Appl. Catal., B, 2013, 132–133, 28–38 CrossRef CAS
.
- I. Czekaj, F. Loviat, F. Raimondi, J. Wambach, S. Biollaz and A. Wokaun, Appl. Catal., A, 2007, 329, 68–78 CrossRef CAS
.
- P. F. Barbieri, A. de Siervo, M. F. Carszzolle, R. Landers and G. G. Kleiman, J. Electron Spectrosc. Relat. Phenom., 2004, 135, 113–118 CrossRef CAS
.
- J. Morales, L. Sánchez, F. Martín, J. R. Ramos-Barrado and M. Sánchez, Thin Solid Films, 2005, 474, 133–140 CrossRef CAS
.
- M. C. Biesinger, L. W. M. Laua, A. R. Gerson and R. S. C. Smart, Appl. Surf. Sci., 2010, 257, 887–898 CrossRef CAS
.
- E. Laurent and B. Delmon, Appl. Catal., A, 1994, 109, 77–96 CrossRef CAS
.
- V. N. Bui, D. Laurenti, P. Afanasiev and C. Geantet, Appl. Catal., B, 2011, 101, 239–245 CrossRef CAS
.
- V. N. Bui, D. Laurenti, P. Delichère and C. Geantet, Appl. Catal., B, 2011, 101, 246–255 CrossRef CAS
.
- T. Nimmanwudipong, R. C. Runnebaum, D. E. Block and B. C. Gates, Energy Fuels, 2011, 25, 3417–3427 CrossRef CAS
.
- B. S. Gevert, J. E. Otterstedt and F. E. Massoth, Appl. Catal., 1987, 31, 119–131 CrossRef CAS
.
- S. Sitthisa, T. Pham, T. Prasomsri, T. Sooknoi, R. G. Mallinson and D. E. Resasco, J. Catal., 2011, 280, 17–27 CrossRef CAS
.
- N. Mahata, O. S. G. P. Soares, I. Rodríguez-Ramos, M. F. R. Pereira, J. J. M. Órfão and J. L. Figueiredo, Appl. Catal., A, 2013, 464–465, 28–34 CrossRef CAS
.
- O. S. G. P. Soares, J. J. M. Órfão, J. Ruiz-Martínez, J. Silvestre-Albero, A. Sepúlveda-Escribano and M. F. R. Pereira, Chem. Eng. J., 2010, 165, 78–88 CrossRef CAS
.
Footnote |
| † Electronic supplementary information (ESI) available. See DOI: 10.1039/c6ra00041j |
| This journal is © The Royal Society of Chemistry 2016 |

