
Thermoelectric high-entropy alloys with low lattice thermal conductivity†
Z. Fan,
H. Wang,
Y. Wu*,
X. J. Liu and
Z. P. Lu*
State Key Laboratory for Advanced Metals and Materials, University of Science and Technology Beijing, Beijing 100083, P. R. China. E-mail: wuyuan@ustb.edu.cn; luzp@ustb.edu.cn
First published on 18th May 2016
Abstract
Reducing lattice thermal conductivity is one of the most effective routes for improving the performance of thermoelectric materials. Herein, a novel alloy design concept, i.e., the high-entropy alloy concept, is introduced as a new strategy to reduce lattice thermal conductivity and the BiSbTe1.5Se1.5 high-entropy alloy was chosen as a paradigm to demonstrate the applicability of this new approach. It was found that the lattice thermal conductivity of this high-entropy alloy is quite low, i.e., ∼0.47 W m−1 K−1 at 400 K, which results from its severe lattice-distortion. In addition, the minor addition of Ag could improve the absolute value of its Seebeck coefficient and further reduce its lattice thermal conductivity. Consequently, a peak ZT value of 0.63 was observed at 450 K for this alloy with the addition of 0.9 at% Ag. Our current results suggest that the revolutionary alloy design concept is a promising strategy for developing novel thermoelectric materials with desirable properties.
Introduction
Thermoelectric materials, which allow for direct conversation between heat and electricity based on the transport of charge carriers and heat phonons,1 have been extensively studied for potentially broad applications in waste heat recovery and refrigeration, etc.2–12 It is well known that the performance of thermoelectric materials depends mainly on the dimensionless figure of merit, i.e., the ZT value, defined as ZT = (S2σ/κ)T, where S is the Seebeck coefficient, σ the electrical conductivity, κ the thermal conductivity and T the absolute temperature.1,13 The thermal conductivity has two main components, namely κe and κL, which are carrier and lattice thermal conductivity, respectively. According to the definition of ZT, it is obvious that performance of thermoelectric materials can be enhanced by either reducing thermal conductivity or increasing Seebeck coefficient and/or electrical conductivity. However, improving the ZT value of thermoelectric materials is challenging due to the well-known interdependence of physical parameters that define it. During the past years, there were two main strategies which have been adopted to further enhance ZT, i.e., phonon engineering4,6,8,14–17 and band engineering,3,5,18 which were used to reduce lattice thermal conductivity and increase power factor PF (PF = S2σ), respectively.Bi2Te3 based bulk materials have been the most widely applied commercial thermoelectric materials near room temperature for decades.1 In recent years, several effective approaches have been applied to significantly reduce their lattice thermal conductivity and thus further enhance ZT, such as nanostructuring,4,16,17 hierarchical structures,14 point defect engineering19 or dense dislocation arrays embedded in grain boundaries.8 However, all of these effective strategies have to be realized with relatively complex preparing processes, such as ball milling, melt-spinning or liquid-phase compaction.
Within the past several years, a revolutionary approach to alloy design with multiple principal elements in equimolar or near-equimolar ratios, termed as high-entropy alloys (HEAs), has been proposed.20–25 Due to effects of the high mixing entropy, these newly developed alloys often form random solid solutions with simple structures like body-centered cubic (BCC) or face-centered cubic (FCC) during solidification, rather than intermetallic compounds or complex phases.26–30 Due to the high mixing entropy and chemical complexity (e.g. large atomic size differences), this new class of materials usually showed severe lattice-distortion and high-temperature phase stability.22,24 It is well known that in solid solutions, lattice thermal conductivity could be effectively reduced due to the enhancement of scattering of phonons by lattice disorder.1,31 Thus, it is reasonable to speculate that HEAs probably possess intrinsically low lattice thermal conductivity in a wide temperature range resulted from their severe lattice-distortion and high temperature stability, and thus may be a class of promising thermoelectric materials. Recently, AlxCoCrFeNi HEAs has been investigated for their potential as high-temperature thermoelectric materials.32 However, these HEAs composed of only metallic elements still show typical behaviour of metal conductors and have a very small Seebeck coefficient due to their high charge carrier concentration, which leads to an ignorable ZT value.
In this study, we attempted to reduce lattice thermal conductivity of Bi2Te3 based bulk materials and optimize their thermoelectric performance through tuning chemical composition with the HEA concept, which could be realized by relatively simple preparing process, i.e., melting followed by sintering. We discovered that the high-entropy BiSbTe1.5Se1.5 alloy indeed possesses low lattice thermal conductivity due to its severe lattice-distortion. Although this HEA alloy showed a moderate ZT value due to its low carrier mobility, our findings still clearly indicated that this novel alloy design concept is promising for developing novel thermoelectric materials with desirable properties. In addition, it was found that thermoelectric performance of the current BiSbTe1.5Se1.5 HEA could be improved to some degree via minor additions, such as Ag, which is a common dopant in the Bi2Te3-like compounds and their solid solutions.33
Experimental
Sample preparation
Pure elements Bi, Sb, Te, Se and Ag with >99.99% purity were weighed and mixed based on the nominal compositions of (BiSbTe1.5Se1.5)1−xAgx, where x = 0, 0.3, 0.6, 0.9 and 1.2 at%, respectively. The mixtures were loaded into quartz ampoules, and the ampoules were then evacuated, sealed and heated up to 1213 K at a heating rate of 1 K min−1 and stabilized at this temperature for 10 h. During this period, the ampoules were rocked several times to ensure good homogeneity of melts. After that, the ampoules were water-quenched and subsequently annealed at 773 K for 48 h. The annealed ingots were ground to powders with an agate mortar and the resultant powders were eventually consolidated at 723 K for 5 min in a 20 mm-diameter graphite die under a uniaxial pressure of 50 Mpa by spark plasma system (SPS). Highly dense disk-shaped pellets with a dimension of Φ 20 mm × 12 mm were finally obtained.Microstructure characterization
X-ray diffraction spectra analysis was conducted on a D/max-RB diffractometer (Rigaku, Japan) using Cu Kα radiation. Scanning electron microscopy (SEM) characterization of the bulk materials were carried out using a SUPRA-55 scanning electron microscope. A Tecnai G2 F30 S-Twin transmission electron microscopy (TEM) equipped with energy dispersive X-ray spectroscopy was used for detailed microstructural analysis and chemical analysis. The TEM samples were prepared by a standard conventional method with polishing, dimpling, and Ar-ion milling. Differential thermal analysis was performed with a DSC 404 F1 Pegasus thermal analyzer (Netzsch, Germany) at a rate of 10 K min−1 using the α-Al2O3 as reference.Properties measurement
The Seebeck coefficient S and electrical resistivity ρ were measured simultaneously on a commercial Linseis LSR-3 system (Linseis, Germany) under helium atmosphere using the specimens with a dimension of 11 × 3 × 3 mm3. In the LSR-3, the resistivity was measured with a standard 4-point probe method by passing the current through the sample, whilst simultaneously measuring the voltage difference along the length of the sample. The Seebeck coefficient was simultaneously obtained by heating one end of the sample while measuring the generated voltage between the probes. The temperature difference between upper and lower electrodes is 30 K during the test. The electrical conductivity σ was obtained based on the relationship σ = 1/ρ. The uncertainties of S and ρ are less than 7% and 5%, respectively. The total thermal conductivity κ is calculated from κ = DCpd, where D is the thermal diffusivity obtained by the laser flash method (LFA-457, Netzsch, Germany) under Ar flow atmosphere for all disc samples with a diameter of 10 mm and a thickness of 1.2 mm, Cp is the specific heat measured by a differential scanning calorimeter (DSC Q2000, TA Instrument, USA) and confirmed by the Dulong–Petit law, and d is the density measured by the Archimedes method and confirmed by the measured weight and dimensions. The uncertainty of κ is around 5%, and the combined experimental uncertainty for the determination of ZT is considered to be about ∼20%. Hall coefficient RH was measured by the Van der Pauw technique, and both the Hall carrier density nH = 1/eRH and Hall mobility μH = RH/ρ were then calculated based on measured RH. All properties measurements were conducted along the direction parallel to the sintering pressure direction. Sound velocities and elastic moduli were measured by resonant ultrasound spectrometer (RUSpec, Teclab, USA).Results and discussion
Microstructure characterization
The samples of the (BiSbTe1.5Se1.5)1−xAgx alloy containing a different amount of Ag, i.e., x = 0, 0.3, 0.6, 0.9 and 1.2%, are designated as base, 0.3Ag, 0.6Ag, 0.9Ag and 1.2Ag, respectively, as shown in Table 1 which also includes density and the Hall carrier density of these samples. DTA curves for all the samples are shown in Fig. 1. As can be seen, there is only one endothermic peak for each curve. The onset melting temperature of the BiSbTe1.5Se1.5 HEA is around 900 K and reduces slightly with the increase of the Ag content. All these results indicate that microstructure of these HEAs with a different amount of Ag did not change dramatically. Fig. 2a shows the corresponding XRD patterns which are similar with that of antimony selenium telluride solid solutions with a rhombohedral crystal structure (R![[3 with combining macron]](https://www.rsc.org/images/entities/char_0033_0304.gif) m), e.g., Sb2SeTe2. In addition, there seems to be no appreciable difference among all the XRD patterns, suggesting that addition of Ag did not significantly induce formation of secondary phases, which is consistent with the observation of one single melting peak in the DTA curves, as shown in Fig. 1. The morphology of the free fracture surface and the back scattering electron (BSE) image of the polished surface of the base HEA are shown in Fig. 2b and c, respectively, which indicates a homogeneous and dense microstructure. Fig. 2e shows TEM characterization of the base HEA, and the corresponding selected area diffraction (SAD) pattern is included in the inset of Fig. 2e which confirms that the BiSbTe1.5Se1.5 alloy indeed possesses a rhombohedral crystal structure (Rm). The hexagonal lattice parameters of the base HEA were extrapolated from the high angle XRD diffraction peaks to be a = 4.225 Å and c = 30.098 Å. It is important to point out that there is a small amount of Ag-rich secondary phase in the 1.2Ag sample, as revealed by the BES image and the Ag elemental mapping shown in Fig. 2d. Note that both the XRD pattern and the DTA curve of the 1.2Ag sample do not show any sign of presence of the Ag-rich secondary phase, indicating that the amount of the Ag-rich secondary phase is limited.
m), e.g., Sb2SeTe2. In addition, there seems to be no appreciable difference among all the XRD patterns, suggesting that addition of Ag did not significantly induce formation of secondary phases, which is consistent with the observation of one single melting peak in the DTA curves, as shown in Fig. 1. The morphology of the free fracture surface and the back scattering electron (BSE) image of the polished surface of the base HEA are shown in Fig. 2b and c, respectively, which indicates a homogeneous and dense microstructure. Fig. 2e shows TEM characterization of the base HEA, and the corresponding selected area diffraction (SAD) pattern is included in the inset of Fig. 2e which confirms that the BiSbTe1.5Se1.5 alloy indeed possesses a rhombohedral crystal structure (Rm). The hexagonal lattice parameters of the base HEA were extrapolated from the high angle XRD diffraction peaks to be a = 4.225 Å and c = 30.098 Å. It is important to point out that there is a small amount of Ag-rich secondary phase in the 1.2Ag sample, as revealed by the BES image and the Ag elemental mapping shown in Fig. 2d. Note that both the XRD pattern and the DTA curve of the 1.2Ag sample do not show any sign of presence of the Ag-rich secondary phase, indicating that the amount of the Ag-rich secondary phase is limited.
| (BiSbTe1.5Se1.5)1−xAgx | ||||
|---|---|---|---|---|
| Label | x (%) | Ag (at%) | nH (1019 cm−3) | Density (g cm−3) |
| 0Ag | 0 | 0 | 0.955 | 6.95 |
| 0.3Ag | 0.3 | 0.3 | 2.78 | 6.98 |
| 0.6Ag | 0.6 | 0.6 | 2.94 | 7.01 |
| 0.9Ag | 0.9 | 0.9 | 5.56 | 7.02 |
| 1.2Ag | 1.2 | 1.2 | 1.90 | 7.04 |
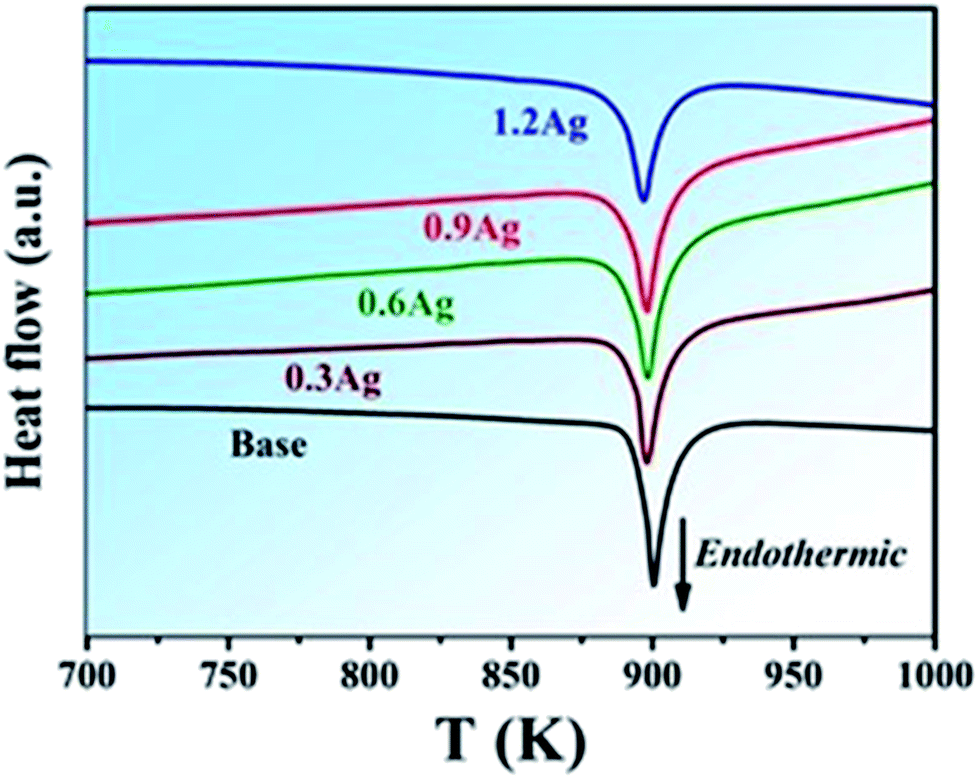 | ||
| Fig. 1 Differential thermal analysis (DTA) curve of all the alloys. | ||
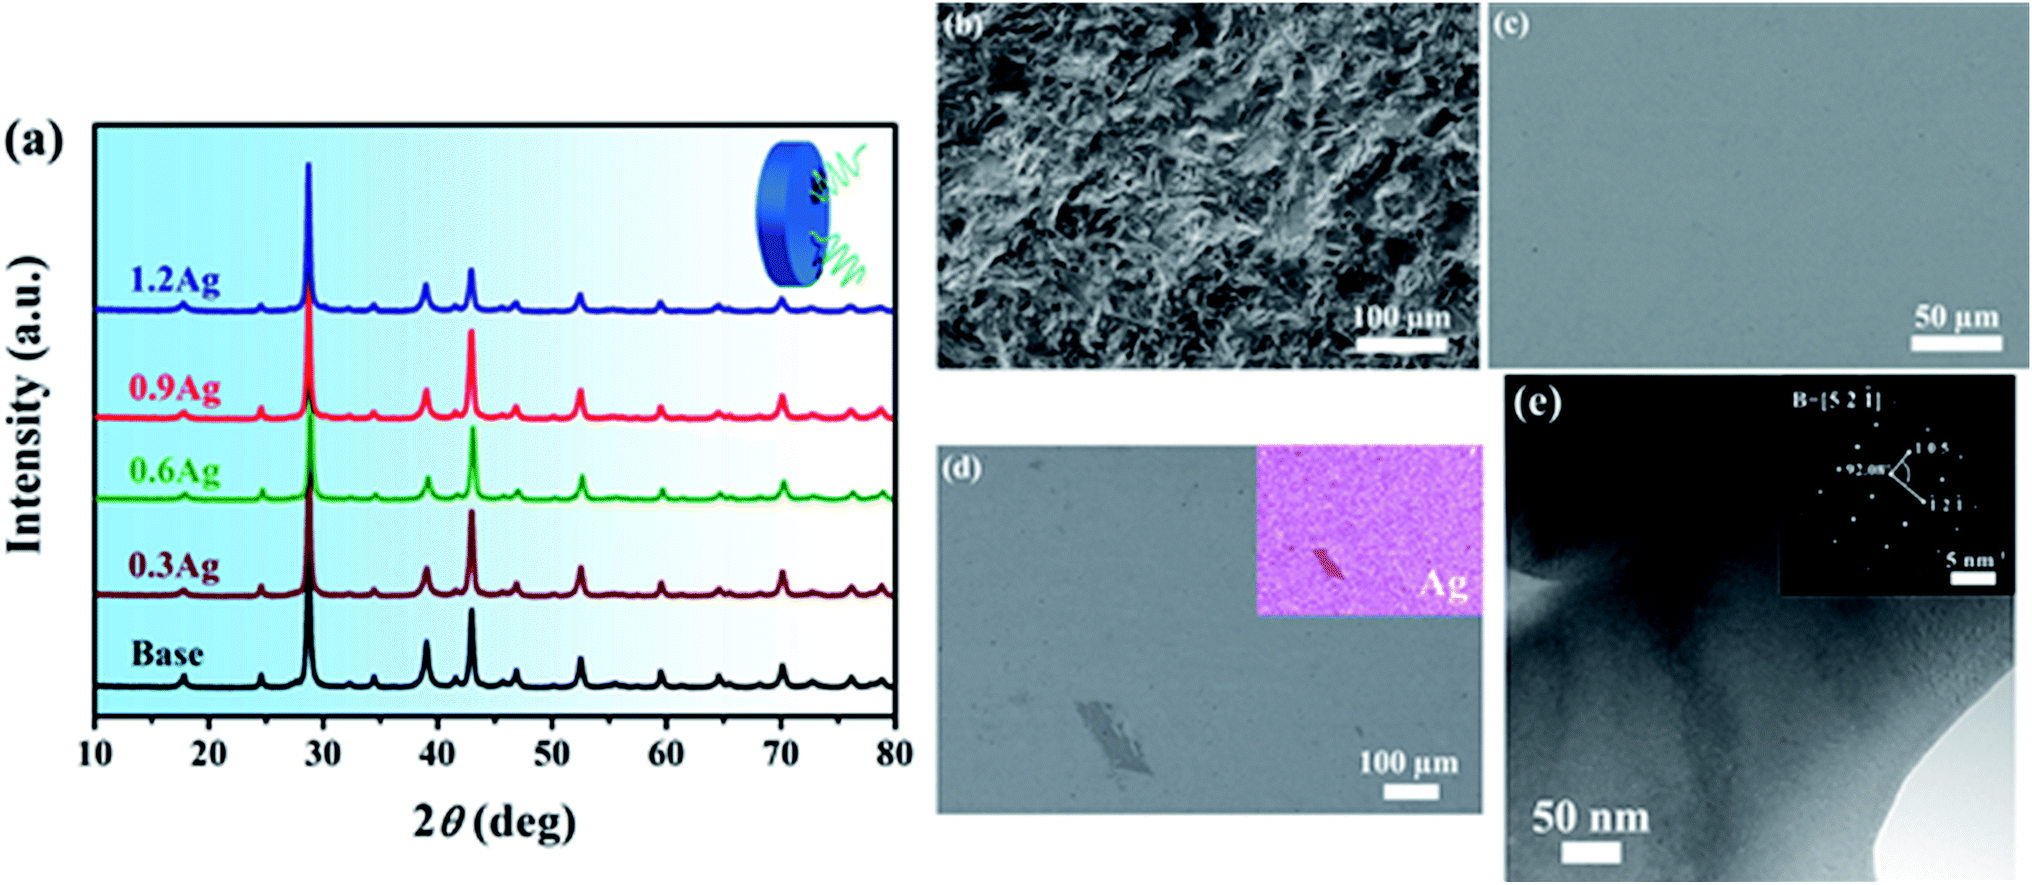 | ||
| Fig. 2 (a) XRD patterns, (b) SEM image of the free fracture surface of the base HEA, (c) BSE image of the polished surface of the base HEA, (d) BSE image of the polished surface of the 1.2Ag sample, and (e) TEM micrograph of the base HEA with the corresponding SAD pattern in the inset. The inset in (d) shows the corresponding Ag elemental mapping. | ||
Thermal transport properties
The specific heat capacity Cp of the base HEA at different temperatures is shown in Fig. 3a and the purple dash line represents the Cp value calculated from Dulong–Petit law. The measured Cp at room temperature is about 0.199 J g−1 K−1, which is consistent with the Dulong–Petit value (i.e., 0.195 J g−1 K−1). As the temperature is increased up to 500 K, the value of Cp just increases slightly. | ||
| Fig. 3 (a) Heat capacity as a function of temperature for the base HEA, and temperature dependence of the total thermal conductivity (b) and the lattice thermal conductivity (c) for all the alloys, respectively. | ||
The total thermal conductivity κ of all the samples as a function of temperature is presented in Fig. 3b. As can be seen, the total thermal conductivity κ of all the samples is weakly dependent on the temperature, and particularly, the base HEA shows a κ value less than 0.7 W m−1 K−1 within the entire temperature range of investigation, which is less than that of V–VI compounds and alloys measured also along the longitudinal direction, such as Bi2Te3-based alloys34,35 and Sb2Te3 compound.36 With addition of Ag, the total thermal conductivity further reduced and in the 0.9Ag sample, κ decreases to 0.43 W m−1 K−1 at 375 K.
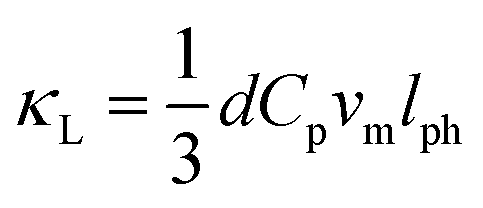
The lattice thermal conductivity κL was obtained by subtracting the carrier thermal conductivity κe from the measured κ. The value of κe was calculated via the Wiedemann–Franz relationship, κe = LσT, where σ is the electrical conductivity, T the absolute temperature, and L the Lorenz number which was calculated based on a simple model.37 In our case, the scattering parameter was determined as 1 according to the dependence of the Hall mobility μH on temperature T revealed in Fig. 5b. Fig. 3c shows the calculated value of κL as a function of temperature for all the specimens. The lattice thermal conductivity κL slightly decreases as the temperature increases from 300 to 400 K, but as the temperature exceeds 400 K, it somewhat increases due to the ambipolar contribution. Compared to that of the Bi0.5Sb1.5Te3 bulk alloy,4,8,14 nevertheless, the ambipolar contribution in the current HEAs is insignificant, suggesting that the high mixing entropy of the HEA seems to be capable of inhibiting the ambipolar contribution.
 | ||
| Fig. 4 Temperature dependence of the Seebeck coefficient (a), electrical conductivity (b) and power factor (c) of all the alloys. | ||
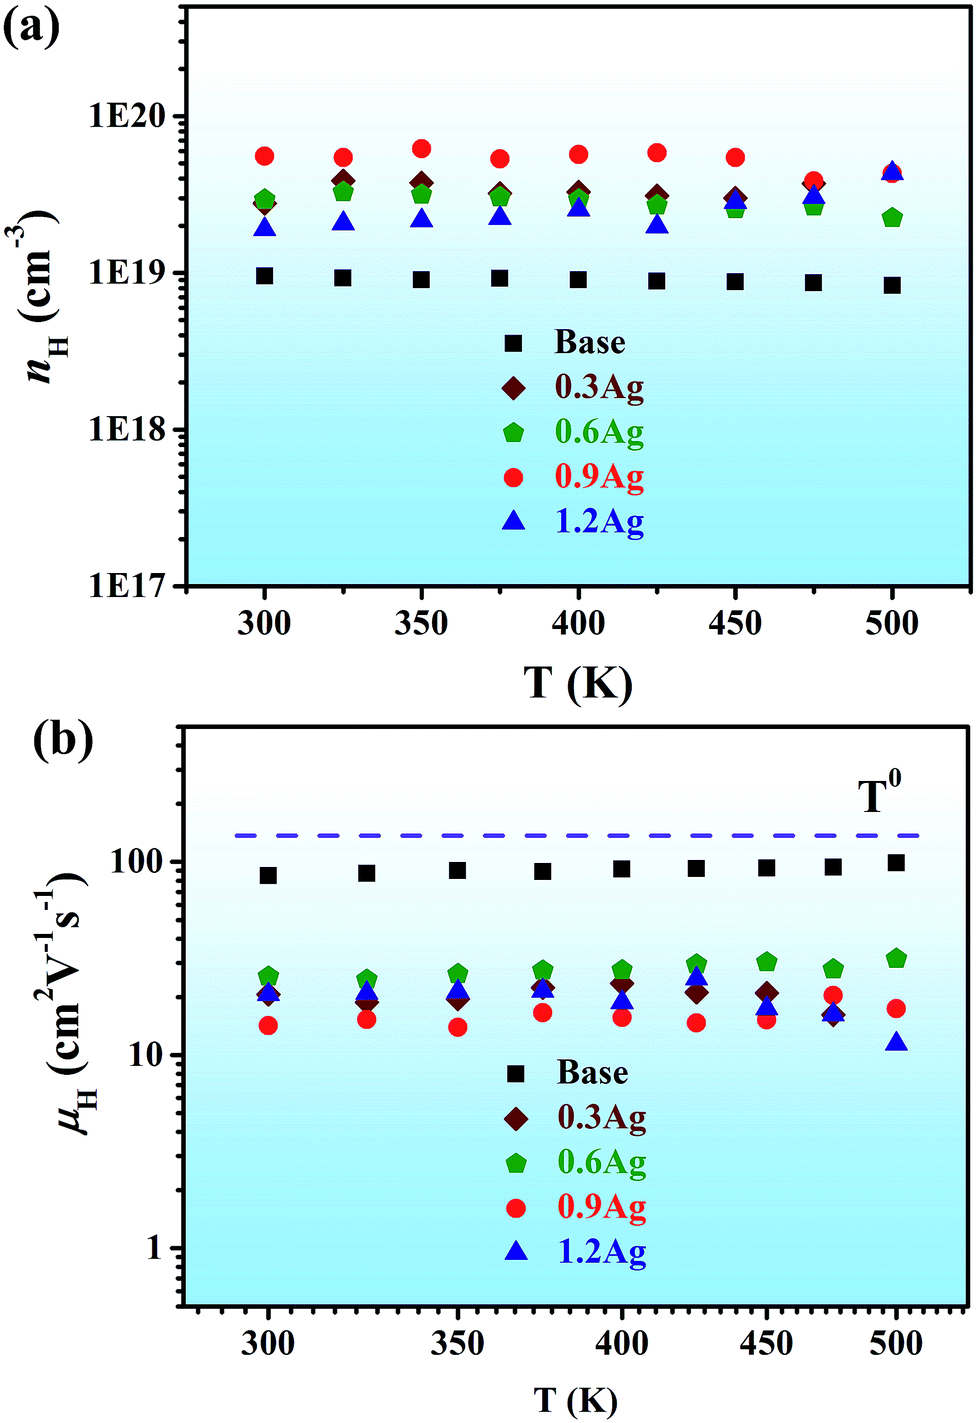 | ||
| Fig. 5 (a) Hall carrier density and (b) Hall mobility as a function of temperature for all the alloys. | ||
The theoretical minimum of the lattice thermal conductivity for the base BiSbTe1.5Se1.5 HEA, κL-min, was estimated to be ∼0.45 W m−1 K−1 using Cahill's formulation.38 The lowest value of κL of the base HEA experimentally measured at around 400 K is about 0.47 W m−1 K−1, which is close to the theoretical limit. This value is around 20% smaller than the minimum value of the Bi2Te2.7Se0.3 with nanostructured grains (i.e., 0.6 W m−1 K−1).34 It was also confirmed that the lattice thermal conductivity is insensitive to crystallographic orientation.34 Thus, we herein compare the lattice thermal conductivity of the current HEAs with some literature data measured without considering the measuring direction. It was found that the lattice thermal conductivity of the current base HEA is even lower than that of the Bi0.5Sb1.5Te3 bulk alloy with hierarchical structures (i.e., 0.55 W m−1 K−1).14 Addition of Ag in the base HEA further decreased its κL value, which is mainly due to the further enhancement of phonon scattering. Among all these samples, 0.9Ag alloy showed the lowest κL value over the temperature range of investigation, i.e., around 0.29 W m−1 K−1 at 425 K, which is also lower than that of the Bi0.5Sb1.5Te3 bulk alloy with dense dislocation arrays embedded in grain boundaries (i.e., 0.33 W m−1 K−1).19
In order to understand the extremely low κL value of the present HEAs, the phonon mean free path lph at room temperature for all the samples were calculated via the following equation39
 | (1) |
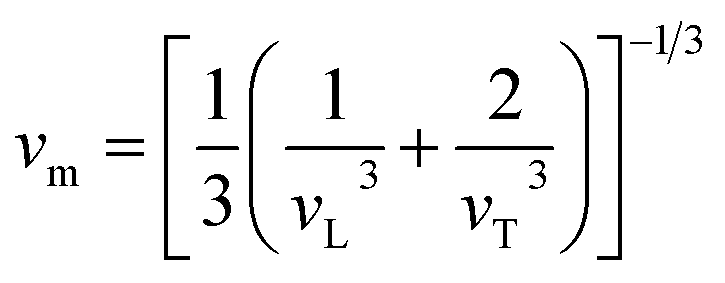 | (2) |
| Label | vL (m s−1) | vT (m s−1) | vm (m s−1) | lph (Å) | B (Gpa) | G (Gpa) | E (Gpa) |
|---|---|---|---|---|---|---|---|
| 0Ag | 3339 | 2542 | 2723 | 4.4 | 17 | 44 | 72 |
| 0.3Ag | 3140 | 1854 | 2054 | 5.3 | 36 | 24 | 58 |
| 0.6Ag | 2682 | 1489 | 1658 | 6.8 | 29 | 15 | 39 |
| 0.9Ag | 3160 | 2435 | 2602 | 3.4 | 14 | 39 | 60 |
| 1.2Ag | 2865 | 1928 | 2105 | 5.4 | 23 | 26 | 56 |
Charge transport properties
Electrical transport properties of all the samples are shown in Fig. 4a–c. Fig. 4a shows the Seebeck coefficient S for all the samples as a function of temperature. The room-temperature value of the Seebeck coefficient of the base HEA is ∼−130 μV K−1 and changes slightly as the temperature increases up to 500 K. Noticed that the S values over the entire temperature range are negative, indicating that the BiSbTe1.5Se1.5 HEA is an n-type conductor with the dominant charge carriers being electrons. Due to the addition of Ag, however, the Seebeck coefficient of all Ag-containing samples became positive, suggesting that the Ag element in the BiSbTe1.5Se1.5 HEA plays a role as an electron acceptor. For 0.3Ag, 0.6Ag and 0.9Ag alloys, their room-temperature Seebeck coefficient decreased with the increase of Ag, which should be resulted from the increase of hole concentration due to the Ag addition. The Seebeck coefficient of these three samples initially increased with temperature and then decreased. The peak value of the Seebeck coefficient of these specimens is ∼220–240 μV K−1, which is comparable to that of the Bi0.5Sb1.5Te3 bulk alloy4,8,14 and slightly higher than that of the BiSbTe-based nanocomposites.17 It is to note that the critical temperature at which the Seebeck coefficient reach its maximum increases with the increase of Ag. With excessive Ag addition (e.g. 1.2% Ag), formation of the secondary phase resulted in the decrease of the hole concentration and, therefore, the Seebeck coefficient increases slightly.According to the formula for calculating the energy gap developed by Goldsmid41
| EG = 2eSmaxT | (3) |
Fig. 4b shows the temperature dependence of the electrical conductivity σ of all the samples. The electrical conductivity of the base HEA is about 13![[thin space (1/6-em)]](https://www.rsc.org/images/entities/char_2009.gif) 000 S m−1 and quite constant in the temperature range of 300–500 K, which is much lower, as compared with that of the Bi2Te3-based bulk alloy15,19,30,34 and nanocomposites.16,17 It seems that the Ag addition did not effectively improve the electrical conductivity due to the decrease in the Hall mobility, as shown in Fig. 5b. The electrical conductivity of alloys 0.3Ag, 0.6Ag and 0.9Ag at room temperature is around 12000 S m−1 and that of the 1.2Ag sample became worse due to the formation of the secondary phase. The corresponding power factor (σS2) as a function of temperature is shown in Fig. 4c. The power factor of the base HEA is weakly temperature-dependent and maintains a value between 2.3 × 10⁻⁴ and 2.8 × 10⁻⁴ W m−1 K−2 over the whole temperature range. For the samples with Ag additions, the power factor increased and showed a maximum value at a certain temperature. Specifically, the peak value of the power factor of 0.6Ag and 0.9Ag samples is near equivalent and approximately 6.5 × 10⁻⁴ W m−1 K−2, and the corresponding temperature is around 425 K.
000 S m−1 and quite constant in the temperature range of 300–500 K, which is much lower, as compared with that of the Bi2Te3-based bulk alloy15,19,30,34 and nanocomposites.16,17 It seems that the Ag addition did not effectively improve the electrical conductivity due to the decrease in the Hall mobility, as shown in Fig. 5b. The electrical conductivity of alloys 0.3Ag, 0.6Ag and 0.9Ag at room temperature is around 12000 S m−1 and that of the 1.2Ag sample became worse due to the formation of the secondary phase. The corresponding power factor (σS2) as a function of temperature is shown in Fig. 4c. The power factor of the base HEA is weakly temperature-dependent and maintains a value between 2.3 × 10⁻⁴ and 2.8 × 10⁻⁴ W m−1 K−2 over the whole temperature range. For the samples with Ag additions, the power factor increased and showed a maximum value at a certain temperature. Specifically, the peak value of the power factor of 0.6Ag and 0.9Ag samples is near equivalent and approximately 6.5 × 10⁻⁴ W m−1 K−2, and the corresponding temperature is around 425 K.
Fig. 5a shows the carrier concentration nH as a function of temperature for all the samples. For the base HEA, the carrier concentration is around 9.0 × 1018 cm−3 and kept almost unchanged with temperature. The carrier concentration of the Ag-containing samples is also weakly temperature-dependent and its value at room temperature increases with the increase of Ag in the 0.3Ag, 0.6Ag and 0.9Ag samples. The carrier concentration of the 1.2Ag sample decreased due to the presence of the secondary phase. The measured Hall mobility μH at different temperatures is shown in Fig. 5b. The Hall mobility of the base HEA is relatively low, which might be also originated from the severe lattice-distortion. In addition, the minor addition of Ag further reduces the Hall mobility, and thus the electrical conductivity of the Ag-containing samples was not improved effectively with the increase of carrier concentration, suggesting that the Ag element is not an ideal dopant in the high-entropy BiSbTe1.5Se1.5 alloy. Usually, the dependence of μH on temperature for thermoelectric materials can be well described by a power law of μH ∝ T−p when one scattering mechanism limits μH for the temperature range of interest.39 The exponent p often hovers around 1.5 for most thermoelectric materials, but surprisingly, become near 0 in the temperature range of 300–500 K for the current HEAs. In other words, the Hall mobility of the current HEAs lacks temperature dependence, which is very uncommon in semiconductor alloys and should be related to the severe lattice-distortion of the current HEAs. This observation implies that the severe lattice-distortion of the high-entropy BiSbTe1.5Se1.5 alloy seems to be different from regular lattice disorder induced reduction of Hall mobility.
Figure of merit
The figure of merit, ZT, calculated from the above data for all the alloys as a function of temperature is shown in Fig. 6. The peak value of the base BiSbTe1.5Se1.5 alloy is about 0.20 at 450 K. With the addition of Ag, the Seebeck coefficient is increased and the thermal conductivity is reduced, resulting in the increment in the maximum ZT. The maximum ZT value of 0.63 was obtained at 450 K in the 0.9Ag sample. When the Ag content further increases, the thermoelectric performance became worse due to the presence of the Ag-rich secondary phase. Based on the above results, it is clear that high mixing entropy is effective in reducing the lattice thermal conductivity due to the severe lattice-distortion. Nevertheless, the ZT value of the current HEA needs to be further improved, which could be achieved by searching for other dopants or proper tuning the molar ratios of principal elements in the current HEAs. Without doubt, future research efforts are apparently required in this regard and applying this brand-new alloy design strategy to develop novel thermoelectric materials with high-performance properties also merits further investigation.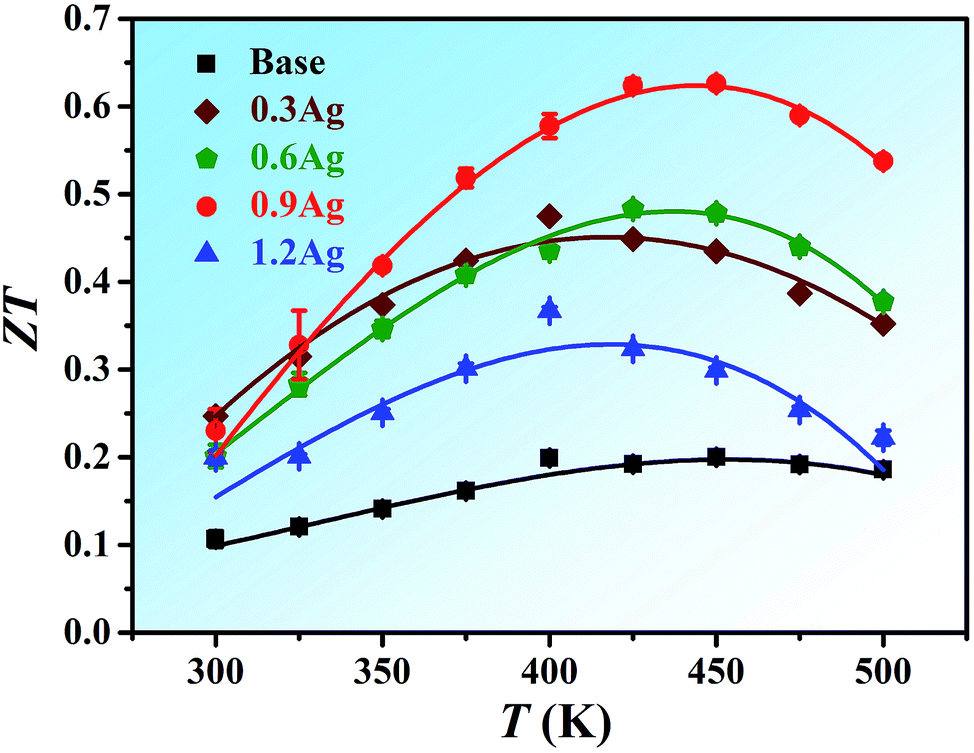 | ||
| Fig. 6 Temperature dependence of the thermoelectric figure of merit for all the alloys. | ||
Conclusions
In summary, polycrystalline high-entropy BiSbTe1.5Se1.5 alloy with different amounts of Ag were prepared by a simple and convenient method, i.e., melting followed by spark plasma sintering. Both their electrical conductivity and thermal conductivity are weakly temperature dependent, which may result from the high mixing entropy effect of the current HEAs. Intrinsically, the BiSbTe1.5Se1.5 HEA possesses low lattice thermal conductivities due to its severe lattice-distortion effect. The lowest value of κL for the base HEA is around 0.47 W m−1 K−1, which is close to the theoretical limit. Addition of Ag which acted as electron acceptor in the HEAs increased the absolute value of the Seebeck coefficient and further reduced lattice thermal conductivity. The peak ZT of the 0.9Ag sample is around 0.63 at 450 K. Our results imply that the high-entropy BiSbTe1.5Se1.5 alloy could be a promising thermoelectric material, provided that the reduction of Hall mobility from its severe lattice-distortion could be minimized, which merits further investigation.Acknowledgements
This research was supported by National Natural Science Foundation of China (No. 51010001, 51001009, and 51271212), 111 Project (B07003) and Program for Changjiang Scholars and Innovative Research Team in University. X. J. L. acknowledges the financial support from the Beijing Nova Program of China (No. 2010B017). Y. W. acknowledges the financial support from “Beijing Higher Education Young Elite Teacher Project”. The authors also thank Dr Heng Wang from Materials Science, California Institute of Technology for valuable discussion.References
- D. M. Rowe, CRC Handbook of Thermoelectrics, Boca Raton, FL, 1995 Search PubMed.
- K. F. Hsu, S. Loo, F. Guo, W. Chen, J. S. Dyck, C. Uher, T. Hogan, E. Polychroniadis and M. G. Kanatzidis, Science, 2004, 303, 818–821 CrossRef CAS PubMed.
- J. P. Heremans, V. Jovovic, E. S. Toberer, A. Saramat, K. Kurosaki, A. Charoenphakdee, S. Yamanaka and G. J. Snyder, Science, 2008, 321, 554–557 CrossRef CAS PubMed.
- B. Poudel, Q. Hao, Y. Ma, Y. Lan, A. Minnich, B. Yu, X. Yan, D. Wang, A. Muto and D. Vashaee, Science, 2008, 320, 634–638 CrossRef CAS PubMed.
- Y. Pei, X. Shi, A. LaLonde, H. Wang, L. Chen and G. J. Snyder, Nature, 2011, 473, 66–69 CrossRef CAS PubMed.
- K. Biswas, J. He, I. D. Blum, C. I. Wu, T. P. Hogan, D. N. Seidman, V. P. Dravid and M. G. Kanatzidis, Nature, 2012, 489, 414–418 CrossRef CAS PubMed.
- L. D. Zhao, S. H. Lo, Y. Zhang, H. Sun, G. Tan, C. Uher, C. Wolverton, V. P. Dravid and M. G. Kanatzidis, Nature, 2014, 508, 373–377 CrossRef CAS PubMed.
- S. I. Kim, K. H. Lee, H. A. Mun, H. S. Kim, S. W. Hwang, J. W. Roh, D. J. Yang, W. H. Shin, X. S. Li and Y. H. Lee, Science, 2015, 348, 109–114 CrossRef CAS PubMed.
- L. E. Bell, Science, 2008, 321, 1457–1461 CrossRef CAS PubMed.
- B. C. Sales, Science, 2002, 295, 1248–1249 CrossRef CAS PubMed.
- H. Goldsmid and R. Douglas, Br. J. Appl. Phys., 1954, 5, 386 CrossRef.
- D. Kraemer, B. Poudel, H.-P. Feng, J. C. Caylor, B. Yu, X. Yan, Y. Ma, X. Wang, D. Wang and A. Muto, Nat. Mater., 2011, 10, 532–538 CrossRef CAS PubMed.
- G. J. Snyder and E. S. Toberer, Nat. Mater., 2008, 7, 105–114 CrossRef CAS PubMed.
- Y. Zheng, Q. Zhang, X. Su, H. Xie, S. Shu, T. Chen, G. Tan, Y. Yan, X. Tang and C. Uher, Adv. Energy Mater., 2014, 5, 1401391 Search PubMed.
- Y. Pei, J. Lensch-Falk, E. S. Toberer, D. L. Medlin and G. J. Snyder, Adv. Funct. Mater., 2011, 21, 241–249 CrossRef CAS.
- W. Xie, J. He, H. J. Kang, X. Tang, S. Zhu, M. Laver, S. Wang, J. R. Copley, C. M. Brown, Q. Zhang and T. M. Tritt, Nano Lett., 2010, 10, 3283–3289 CrossRef CAS PubMed.
- J. Li, Q. Tan, J.-F. Li, D.-W. Liu, F. Li, Z.-Y. Li, M. Zou and K. Wang, Adv. Funct. Mater., 2013, 23, 4317–4323 CrossRef CAS.
- W. Liu, X. Tan, K. Yin, H. Liu, X. Tang, J. Shi, Q. Zhang and C. Uher, Phys. Rev. Lett., 2012, 108, 166601 CrossRef PubMed.
- L. Hu, T. Zhu, X. Liu and X. Zhao, Adv. Funct. Mater., 2014, 24, 5211–5218 CrossRef CAS.
- J. W. Yeh, S. K. Chen, S. J. Lin, J. Y. Gan, T. S. Chin, T. T. Shun, C. H. Tsau and S. Y. Chang, Adv. Eng. Mater., 2004, 6, 299–303 CrossRef CAS.
- J. W. Yeh, Ann. Chim., 2006, 31, 633–648 CAS.
- Y. Zhang, T. T. Zuo, Z. Tang, M. C. Gao, K. A. Dahmen, P. K. Liaw and Z. P. Lu, Prog. Mater. Sci., 2014, 61, 1–93 CrossRef CAS.
- L. J. Santodonato, Y. Zhang, M. Feygenson, C. M. Parish, M. C. Gao, R. J. Weber, J. C. Neuefeind, Z. Tang and P. K. Liaw, Nat. Commun., 2015, 6, 5964 CrossRef PubMed.
- M. H. Tsai and J. W. Yeh, Mater. Res. Lett., 2014, 2, 107–123 CrossRef.
- Z. P. Lu, H. Wang, M. W. Chen, I. Baker, J. W. Yeh, C. T. Liu and T. G. Nieh, Intermetallics, 2015, 66, 67–76 CrossRef CAS.
- B. Cantor, I. Chang, P. Knight and A. Vincent, Mater. Sci. Eng., A, 2004, 375, 213–218 CrossRef.
- V. Dolique, A. L. Thomann, P. Brault, Y. Tessier and P. Gillon, Mater. Chem. Phys., 2009, 117, 142–147 CrossRef CAS.
- C. W. Tsai, Y. L. Chen, M. H. Tsai, J. W. Yeh, T. T. Shun and S. K. Chen, J. Alloys Compd., 2009, 486, 427–435 CrossRef CAS.
- Y. Chen, T. Duval, U. Hung, J. Yeh and H. Shih, Corros. Sci., 2005, 47, 2257–2279 CrossRef CAS.
- Y. Zhou, Y. Zhang, Y. Wang and G. Chen, Mater. Sci. Eng., A, 2007, 454, 260–265 CrossRef.
- H. Wang, A. D. LaLonde, Y. Pei and G. J. Snyder, Adv. Funct. Mater., 2013, 23, 1586–1596 CrossRef CAS.
- S. Shafeie, S. Guo, Q. Hu, H. Fahlquist, P. Erhart and A. Palmqvist, J. Appl. Phys., 2015, 118, 184905 CrossRef.
- D. M. Rowe, CRC Handbook of Thermoelectric: Macro to Nano, CRC Taylor & Francis, Boca Ratcon, 2006 Search PubMed.
- X. Yan, B. Poudel, Y. Ma, W. S. Liu, G. Joshi, H. Wang, Y. Lan, D. Wang, G. Chen and Z. F. Ren, Nano Lett., 2010, 10, 3373–3378 CrossRef CAS PubMed.
- J. J. Shen, L. P. Hu, T. J. Zhu and X. B. Zhao, Appl. Phys. Lett., 2011, 99, 124102 CrossRef.
- W. T. Chiu, C. L. Chen and Y. Y. Chen, Sci. Rep., 2016, 6, 23143 CrossRef CAS PubMed.
- K. C. Lukas, W. Liu, G. Joshi, M. Zebarjadi, M. S. Dresselhaus, Z. Ren, G. Chen and C. P. Opeil, Phys. Rev. B: Condens. Matter Mater. Phys., 2012, 85, 205410 CrossRef.
- D. G. Cahill, S. K. Watson and R. O. Pohl, Phys. Rev. B: Condens. Matter Mater. Phys., 1992, 46, 6131 CrossRef CAS.
- A. F. May, E. S. Toberer, A. Saramat and G. J. Snyder, Phys. Rev. B: Condens. Matter Mater. Phys., 2009, 80, 125205 CrossRef.
- O. L. Anderson, J. Phys. Chem. Solids, 1963, 24, 909–917 CrossRef CAS.
- H. J. Goldsmid, Introduction to thermoelectricity, Springer Science & Business Media, 2009 Search PubMed.
- I. G. Austin, Proc. Phys. Soc., 1958, 72, 545 CrossRef CAS.
Footnote |
| † Electronic supplementary information (ESI) available. See DOI: 10.1039/c5ra28088e |
| This journal is © The Royal Society of Chemistry 2016 |