DOI:
10.1039/C5RA27785J
(Paper)
RSC Adv., 2016,
6, 20916-20925
Thermodynamics of a food macromolecular assembly: the case of okra mucilage†
Received
26th December 2015
, Accepted 11th February 2016
First published on 12th February 2016
Abstract
This is a comprehensive characterization of the bulk and interface thermodynamics of a model macromolecular hydrocolloid of interest in food, cosmetics and pharmaceutics, namely okra mucilage. Inverse gas chromatography (IGC) has been used to probe the affinity of 20 different compounds at infinite dilution to the hydrocolloid. Extensive surface characterization was conducted at three temperatures (40, 50, 60 °C) for the assessment of the surface energy, the free energy of adsorption, and the related enthalpic and entropic components. Okra extract matrix is shown to be Lewis amphoteric with predominantly basic character. Bulk thermodynamic parameters such as the Flory–Huggins interaction parameter, the weight fraction activity coefficient and the total and partial solubility parameters were determined at 90, 100, 110 °C. The above can form a background for the interpretation of many aspects of the hydrocolloid's structural and functional behavior.
1. Introduction
Water-soluble macromolecular assemblies play a key role in biological phenomena, affecting life mechanisms such as metabolism and, more specifically, nutrition and food uptake. If described in thermodynamic terms, the properties of macromolecular assemblies could help understand the fundamental principles of food assimilation, and hence nutrition. Despite their obvious importance in life, the macromolecular protagonists of eating and digestion are not adequately characterized in their fundamental thermodynamic parameters.
Understanding the thermodynamics of macromolecular assemblies in food can be instrumental in deriving fundamental information on their true role in textural and nutritional aspects. Such an approach should require the detailed thermodynamic study of an appropriate model hydrocolloid. A good candidate for a model hydrocolloidal material is the slime-producing okra (Abelmoschus esculentus L.). Also known as bamya/bamia, gumbo, or bhindi, is a plant of the Malvaceae family that is an integral part of the diet of Africa, Southeast Europe, the Middle East, India and Pakistan, the southern United States, the Caribbean, the west Pacific, among other countries and regions. Although some of its physical and chemical properties have been the subject of studies for more than half a century,1,2 the overall attention paid to it has been rather limited in comparison to its abundance and relative importance. The typical thick or slimy texture of okra water-extracts is attributed to its polysaccharide content. Recent work has been focused on the compositional,3–5 rheological,6 emulsifying7 and stabilizing8 aspects of the components of this mucilage. A typical composition of the thickening polysaccharide extracted from the alcohol-insoluble solids of okra fruit at 70 °C pH 5.2 is reported as 35 mol% galacturonic acid, 34 mol% galactose, and 26 mol% rhamnose, acetylated at a level of 58%.3 Such rhamnosyl residues can be substituted with acetyl and galactosyl groups.4 The degree of acetylation, or other substitutions such as methylation, can vary according to the extraction protocols.5 Apart from its obvious use as a food thickening material, okra extracts have been demonstrated to be efficient encapsulating materials for the controlled release of pharmaceutical substances,9,10 while the flour of its seeds is reported to have antioxidant properties.11 However, despite the adequate organic chemical characterization and the great variety of their applications, there is still a lack of data concerning some of the key thermodynamic properties of these materials.
Inverse gas chromatography (IGC) is a useful and quite versatile technique for materials' characterization over a wide temperature range. It has been used for the characterization of a variety of organic materials such as homopolymers and copolymers,12–14 hyperbranched polymers,15,16 polymer blends,17 pharmaceutical materials,18 powders,19,20 nanomaterials,21 fibers,22 crude oils,23 and some non-food carbohydrates.24–26 IGC can contribute to the estimation of two principal groups of properties, namely, (i) a material's (polymer's) surface energy parameters, typically its surface free energy and its acid–base character; (ii) its bulk thermodynamic properties, such as the polymer's solubility parameters and/or the Flory–Huggins interaction parameters. The solubility parameters of polymer-based systems are of primordial importance in sectors such as drug delivery,27 nanoparticle fabrication,28 and coating applications.29 Obtaining such thermodynamic parameters for a widespread mucilaginous plant, such as okra, can help to take advantage of its very high potential in the pharmaceutics, cosmetics and food industry.9,10 It has been studied as a binding agent for tablets and has also been shown to produce tablets with good hardness, friability, and drug release profiles.10 Because it is generally considered as safe, non-irritant, biodegradable, and eco-friendly, it has crucial advantages over most commercial synthetic polymers. Furthermore, is considered to be economical and non-toxic in principle, as it is a widely-harvested food material.
This group has worked on the IGC characterization of a specific fraction of okra hydrocolloids extracts in a preliminary study,30 involving adsorption of the methanol-soluble fraction of the okra hydrocolloid on an inert column-filler. This set-up did not allow for the measurement of bulk properties, while it would not take into account the contribution of some major carbohydrate groups of the okra mucilage. In the present work, a column has been filled with pure dry mucilage, producing a material that is fully representative of pure food-grade or pharmaceutical-grade okra hydrocolloid. Before proceeding, however, a diversion is deemed necessary for providing the reader with the required background on the experimental approach:
1.1 Theoretical background
In an IGC experiment, a series of compounds (“probes”) is injected into a gas chromatographic column filled with the material under study; the aim is to quantify the interactions between the probe and the hydrocolloid based on the probe's elution time (large elution times suggest strong interactions between probe and hydrocolloid). The present experiments were performed at very small probe concentrations; in IGC these are known as infinite dilution experiments,31 as the probe–probe interactions are considered to be negligible, while the stationary phase–probe interactions are dominant.24 A non-retained marker (i.e. methane) is eluted as to allow for the calculation of the column's dead time/volume.12,18,31,32 The parameter of interest in IGC experiments is the net retention volume, VN. For a given probe, this is the volume of the carrier gas required to sweep the injected probe out of the column, and is calculated by eqn (1):32,33 |
 | (1) |
where, tR and tM are the retention times of the probe and of the marker, respectively; FM is the carrier gas flow rate at an ambient pressure P′ and at a temperature TF; T is the column temperature, pw is the vapor pressure of water at TF; j is the James and Martin factor, used in order to correct for the gas carrier compressibility, and is defined as:17,18 |
 | (2) |
where, Pi and Po are the inlet and outlet pressure, respectively.
1.2 Surface properties
1.2.1 Dispersive interactions. The following discussion assumes that any forces between an eluting compound (probe) and the okra mucilage contained in the column can be categorized in two distinct groups: (i) dispersive interactions, which include all non-polar forces/interactions, typically of an induced dipole type (essentially London-type forces); (ii) specific interactions, which include all interactions between polarized and ionized groups. The dispersive (“non-polar”) component of a solid body's surface energy, γds can be determined with the Dorris and Gray method34 through eqn (3): |
 | (3) |
where, N is Avogadro's number; ΔGCH2 is the contribution to the free energy of adsorption of one single methylene group, considered to have a cross-sectional area, αCH2. In eqn (3), γCH2 is the surface energy of a hypothetical solid body consisting solely of methylene groups. The adsorption free energy of a single methylene group is given by24: |
 | (4) |
where Vn+1 and Vn are the retention volumes of n-alkanes with n + 1 and n carbon atoms, respectively. Linearity can be assumed to apply for a plot of the calculated RT
ln
VN values corresponding to the elution of a series of n-alkanes versus the number of their respective carbon atoms. The slope of this line equals, then, to the free energy of adsorption ΔGCH2 for a single methylene group24.
1.2.2 Specific interactions. For the calculation of specific interaction parameters, probes are selected on the basis of their capacity to interact with the solid matrix (here okra hydrocolloid) with forces other than dispersive ones. “Specific” here includes all types of non-dispersive interactions, such as hydrogen bonding, polar, or ionic forces.24,31 Upon a polar probe's injection into the column, both dispersive and specific interactions take place. As the total free energy of adsorption can be considered to be equal to the sum of a specific and of a non-specific component, the contribution of specific interactions to the free energy of adsorption, ΔGsp, can be calculated from the difference between the total free energy of adsorption, ΔGads, and any dispersive components of this free energy ΔGd. ΔGsp can be calculated from plots of ΔG (or RT
ln
VN) values versus the boiling temperatures of the probes (Tb, in °C)35. The non-polar probes used for the determination of non-specific interactions (that is the n-alkane series linear plot) are used as a reference straight line for the determination of the dispersive interactions. The contribution of specific interactions to the free energy of adsorption, ΔGsp of a probe, corresponds to the vertical distance between the ΔGads value and the reference n-alkane line, according to the following equation: |
(−ΔGsp) = (−ΔGads) − (−ΔGref) = RT ln(VN/VN,ref)
| (5) |
where VN is the net retention volume of the polar probe; VN,ref is the net retention volume of a hypothetical alkane which has the same boiling point with the polar probe. Plotting ΔGsp values as a function of the reciprocal temperature, T−1, yields the specific enthalpy ΔHsp from the slope of the straight line corresponding to the classical equation: |
 | (6) |
The enthalpies of specific interactions between the solid surface under examination and the polar probe are related to their acidic or basic character by means of equation:
|
 | (7) |
where DN and AN* are the polar probe numbers for Gutmann's donor
36 and modified acceptor
37, respectively.
KA and
KB are indices reflecting the solid surface's acidity (electron acceptor) and basicity (electron donor) character
36–38.
KA and
KB can be determined from the slope and the intercept, respectively, of the straight line plots of Δ
Hsp/AN*
versus DN/AN*. The
KB/
KA ratio can be used as an empirical basis for the surface classification with respect to its acidity–basicity character. When
KB/
KA > 1, the surface is considered to be basic; for
KB/
KA < 1, the surface is considered to be acidic.
1.3 Bulk thermodynamic properties
1.3.1 Interaction parameters. The same set-up can be used in a temperature range in order to assess bulk, rather than interfacial, thermodynamic properties of a material. This involves, at a first stage, quantifying the specific retention volume, Vg:34 |
 | (8) |
where Ws is the mass of the polymeric stationary phase, while T is the temperature of the column. The probe's molar heat (enthalpy) related to its adsorption, ΔHs1, the probe's molar heat of mixing in the polymer matrix at infinite dilution, ΔH∞1, and its heat of vaporization, ΔHv, can be calculated by the following equations:34 |
 | (9) |
|
 | (10) |
The probe's relevant molar free energy of sorption, ΔGs1, the infinite dilution molar free energy of mixing, ΔG∞1, and its sorption entropy can be calculated as follows34:
|
 | (12) |
|
ΔG∞1 = RT ln Ω∞1;
| (13) |
|
 | (14) |
The probe's weight fraction activity coefficient at infinite dilution, Ω∞1, and the Flory–Huggins interaction parameter, χ∞12 (reflecting the polymer–probe interaction strength), are given by the following equations:34
|
 | (15) |
|
 | (16) |
where
P01 is the vapor pressure of the probe and
B11 its second virial coefficient at temperature
T.
V1 and
v2 are the relevant probe's molar volume and the polymer specific volume, respectively. The values for probes' vapor pressure, second virial coefficients, molar volumes and heats of vaporization were all obtained from the literature
39.
1.3.2 Solubility parameters. In a first approximation, Hildenbrand and Scott40 defined a material's solubility parameter as a function of the material's molar heat of vaporization ΔHv and its molar volume V1. This allows for IGC to calculate the latent heats of evaporation of non-evaporable materials such as polymers, which is a good indication of their transition from an immobilized state (i.e. embedded in a solid matrix) to a mobile one (i.e. evaporated or dissolved). A polymer's solubility parameter, δ2, can be calculated using equation:41 |
 | (17) |
where δ1 is the IGC probe's solubility parameter; while χs is the entropic component of the Flory–Huggins interaction parameter, χ∞12. A plot of the left hand side of eqn (17) versus δ1, is expected to yield a straight line with a slope of 2δ2/RT. This allows for the determination of δ2 for the materials under study.The above rationale does not distinguish between the various types of interactions. Hansen's concept42 of three-dimensional δ – space (which will be briefly discussed below) can be used in that capacity in order to account for the partial solubility parameters due to (i) non-specific (non-polar) interactions, (ii) non-hydrogen bonding specific interactions and (iii) hydrogen bonding ones. Voelkel and Janas43 have proposed a method for the estimation of these partial solubility parameters, which are related to the total solubility parameter, δT, by means of the equation:
|
δT2 = δd2 + δp2 + δh2
| (18) |
where
δd,
δp and
δh are the partial solubility parameters due to dispersive, polar and hydrogen bonding interactions, respectively. These partial parameters can be calculated from the slope of
eqn (17),
via the elution of three groups of probes, namely,
n-alkanes, these molecules interacting solely
via non-specific forces; other probes interacting
via polar non-hydrogen bonding forces; and a third category of probes interacting
via hydrogen bonding. Data from these probe categories can be quantified by the following equations:
|
 | (19) |
|
 | (20) |
|
 | (21) |
where
mn-alkanes is the value of the previously-discussed slope of the data for the
n-alkanes;
m1 the value of the slope for polar probes such as aromatic hydrocarbons, acetonitrile, 1-nitropropane; ketones, and
m2 is the value for hydrogen bonding probes such as alcohols, pyridine and chloroform.
These three parameters can be treated as the Cartesian co-ordinates in a three dimensional (solubility) space, a calculation paradigm known as the Hansen space.42 As a general rule, the closer two molecules are in this three-dimensional space, the more likely they are to be mutually soluble.
2. Materials and methods
2.1 SEC, DSC and TGA characterization
The size exclusion chromatographic (SEC) system was comprised of: a SpectraSystem SCM 1000 degasser (Thermo Separation Products, San Jose, CA); a SpectraSystem P2000 chromatographic pump (Thermo Separation Products, San Jose, CA), which is followed by a μm frit (Idex, Oak Harbor, WA); a GPC/SEC PL-Aquagel-OH 50 × 7.5 mm guard column (8 μm) (Varian Inc, Palo Alto, CA); three tandem GPC/SEC PL-Aquagel-OH 300 × 7.5 mm columns (Varian Inc, Palo Alto, CA); a DNDC differential diffractometer detector (Brookhaven Instruments Corporation, NY); a BI-MwA multi-angle laser light scattering (MALLS) detector (Brookhaven Instruments Corporation, NY); and a UV detector (Rigas Labs, Thessaloniki, Greece). All the samples (2 mg mL−1) were eluted with ultrapure water containing 0.02% sodium azide with a flow rate of 0.8 mL min−1. ParSEC software (Brookhaven Instruments Corporation, NY), was used for data acquisition and handling. Quantification of the proteins was made using the Lowry method,44 which the result was in accordance with published data.8
Differential scanning calorimetric analysis (DSC) was carried out using a temperature modulated TA Instrument (TA Q2000). Temperature modulated DSC scans (TMDSC) were performed at a heating rate of 5 °C min−1, with temperature modulation amplitude of 1 °C and period of 60 s. Nitrogen gas flow of 50 mL min−1 was purged into the DSC cell. The sample mass was about 5 mg and was heated from −10 °C to 200 °C. Thermogravimetric analysis (TGA) was performed using an 8 mg sample, using a Shimadzu TGA-50 TG analyzer (Shimadzu, Kyoto, Japan) with a heating rate of 10 °C min−1 up to 700 °C under a constant nitrogen flow of 20 cm3 min−1.
2.2 Zeta potential measurements
Zeta potential was measured using a Brookhaven ZetaPALS instrument (Brookhaven Instruments Corporation, Brookhaven, Holtsville, NY). Ultrapure water and 1 μm syringe filters were used for these measurements. 30 mg mL−1 samples were measured at a temperature of 25 °C, assuming for the continuous phase a viscosity of 0.89 Pa s and a refractive index of 1.33. The sample was diluted ten times and was measured again, as to eliminate the possibility of multiple scattering.
2.3 SEM measurements
Scanning electron microscopy (SEM) micrographs on freshly cut sample surfaces were taken with a Jeiss EVO50 low-vacuum scanning electron microscope (Carl Zeiss, Oberkochen, Germany) equipped with a W filament operated in variable pressure 30 Pa with operating voltage (EHT) 7 kV and working distance 11–13 mm, without any prior coating process.
2.4 Materials
Mature okra pods, 5–9 cm in length grown in the Meliki region (Imathia, Greece) were obtained from the local market. These pods were immediately frozen and stored at −20 °C. Distilled water has been used throughout the extraction experiments, while all relevant reagents were of analytical grade (Sigma, Poole, UK). For the IGC analysis, all solvents were of the highest available purity and were all purchased from Aldrich. The nonpolar solvents used in these measurements were n-hexane, n-heptane, n-octane, n-nonane, n-decane, n-undecane and n-dodecane. The polar probes were tetrahydrofuran, chloroform, acetonitrile, n-butanol, ethanol, ethyl acetate, pyridine, 1,4-dioxane, 1-propanol, 2-pentanone, cyclopentanone, methyl acetate, 1-nitropropane and methanol. All gases utilized in this work were purchased from Air Liquide Mediterranee and were of high purity.
2.5 Okra mucilage extraction
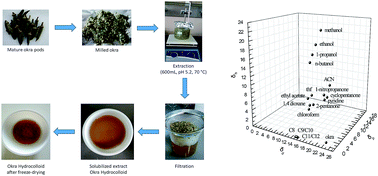
Okra pods were freeze-dried and then milled. 30 g of the dried material was subjected to extraction (600 mL at 70 °C for 30 min) with distilled water set at pH 5.2 by means of dropwise adding solutions of HCl or NaOH. The solubilized extract was separated from the insoluble residue via filtration, and was subsequently freeze-dried. Stages of the process and the material are shown in photographs in Fig. 1.
 |
| Fig. 1 Stages of hydrocolloid preparation. | |
2.6 Column preparation
A stainless steel column has been washed with acetone and dried. 2.2 g of okra extract were packed in the column by means of vertical tapping. Column loading was made with the aid of a mechanical vibrator and of a vacuum pump. The end of the column was plugged with a piece of glass wool and was connected to the vacuum pump. Filling up under mechanical vibration and manual tap ensured better packing of the stationary phase in the column. The column was then shaped into a coiled form in order to be adjusted to the injector's and detector's ports. Prior to measurements, the column was conditioned overnight to the working conditions (temperature and helium flow rate), as to remove contaminants which could be eluted during measurements. The column characteristics are presented in Table A1 (ESI†).
2.7 IGC setup
The IGC measurements were carried out with a Hewlett Packard HP 5890 gas chromatograph, equipped with a flame ionization detector (FID). High purity helium was used as a carrier gas. Helium flow rate was measured with a soap bubble flowmeter at room temperature. Methane was used as a non-interacting marker in order to determine the void volume of the column. The experimental conditions are presented in Table A1 (ESI†). Probes were injected manually with a 1 μL Hamilton syringe. The injection volume of each probe was 0.1 μL, in order to achieve infinite dilution. A minimum of three injections were made for each probe and the average retention time tR, was used for the calculations. The standard deviation was less than 4% in all measurements. The retention times of the probes were determined after the calculation of the first-order moment of the concentration distribution. This was deemed necessary due to the slight “tailing” exhibited by the elution profile of the probes.
3. Results and discussion
3.1 Physico-chemical characterization
Fig. A1 (ESI†) presents the size exclusion chromatography (SEC) plots obtained for the sample under study. The Mp of each peak was assessed based on the elution profile of dextran standards of known molecular weight. One must be careful in assigning molecular weight based on elution time of linear dextrans alone; however this is an adequate first indication for the size determination of individual populations.45
The peaks observed correspond at eluent volumes of 12 mL and 17 mL. The first peak is being typically attributed to larger macromolecules. Comparison of the elution volumes with those of dextran standards suggests that the first peak should be attributed to particles of molecular mass above 1.4 MDa, and suggests anisotropic scatterers (results not shown) as the scattering intensity varies with the scattering angle. The second substantial peak follows, corresponding respectively to a relatively large population of molecular mass ∼50 kDa. This latter peak absorbs strongly at 280 nm (in order to aid the reader, the region of high UV280 absorbance is highlighted). As absorbance at the near UV is principally due to aminoacids such as Tyr, Trp, Phe and disulphide bonds46 rather than sugars, the non-absorbing peak is more likely due to proteins or glycoproteins, rather than polysaccharides. The very last peak (20–21 mL), which is detected with the refractive index detector, can be attributed to small molecules, including a system peak. Fig. A2 (ESI†) shows the SEM image for okra extract, which appears as an amorphous material.
Furthermore, in combination with the Table A2 (ESI†) is confirmed that the polysaccharides which isolated have polydispersity as it was found 9% w/w protein by Lowry method,44 which is in accordance with published data.8 This table also shows the physical characteristics of okra gum.
The above can be summarized as follows: the sample under study contains one population of very large molecules, which can be identified as polysaccharides of a molecular mass of over ∼1.4 MDa. A multi disperse population of smaller macromolecules, of the order of some tens of kDa, can be identified as peptidic entities, that is proteins, glycoproteins or oligopeptides; the peptide fraction in the sample is in the order of ∼10%. Other smaller molecules exist and manifest as a system peak in the chromatogram.
Differential scanning calorimetry (DSC) analysis (scanned range −10 to 200 °C) showed no discernible thermal events at the temperature range between 40 and 60 °C. An endothermic event occurs at 80 °C, as illustrated in Fig. A3 (ESI†); this is in accordance with published data.10 The source of this event is unclear, while it is reasonably related to a phase transition, followed by a glass transition event. All measurements of the bulk thermodynamic properties were performed above that temperature, as to facilitate the penetration the probes into the bulk of the okra material.
The extract was subsequently examined using thermogravimetric analysis (TGA). Heating was performed up to 800 °C at a heating rate of 10 °C min−1. No weight loss of significance was recorded before 100 °C, which shows that the event at 80 °C was not mass transfer to the environment, but some sort of phase transition. Two distinct weight losses manifest: one between 120 and 390 °C and another between 410 and 450 °C. The first reduction is indicative of both water removal and of okra biopolymer (i.e. polysaccharide) depolymerization,47 and is in line with the previous DSC results. The latter should obviously be related to further depolymerization and pyrolysis.
3.2 Inverse gas chromatography
3.2.1 Surface properties. The dispersive component of the surface energy of okra was determined using eqn (3) and the slope derived from the plot of RT
ln
VN of n-alkanes versus their carbon atoms, at various temperatures, as illustrated in Fig. 2. The slope of the line corresponds to the free energy of adsorption of a single methylene group, ΔGCH2. The values of γds are 36.00 ± 0.19 mJ m−2 at 40 °C, 33.56 ± 0.09 mJ m−2 at 50 °C and 21.58 ± 0.13 mJ m−2 at 60 °C. As observed, the dispersive component of surface energy of okra decreases with increasing temperature. This is well expected, as any interactions are reasonably favored at lower temperatures.
 |
| Fig. 2 Variation of RT ln VN of n-alkanes with the number of carbon atoms, measured at various temperatures. | |
3.2.2 Specific interactions. The contribution of specific interactions to the free energy of adsorption, ΔGsp, for each polar probe was determined from the data presented in Fig. 3. The straight reference line is a fit to the probes exhibiting London dispersive interactions alone, that is one of the plots shown in Fig. 2. The points lying out of this line correspond to probes that interact with okra extract also under the influence of specific forces, that is dipole, ionic and hydrogen bonding interactions. The farther away they lie from the line, the stronger these interactions are. As per the above, for example, n-butanol interacts with the okra extract stronger than does ethyl acetate. The −ΔGsp values calculated for of all Lewis acidic, basic, and amphoteric probes are relatively high, leading to the conclusion that, on the surface of okra, all types of active sites are present. This is an important observation that can explain the relatively common observation that small changes in the aqueous eluent can yield mucilages of different compositional and structural characteristics, as, for example, in Alba and co-workers.5
 |
| Fig. 3 Energy of adsorption of n-alkanes and polar probes versus their boiling temperatures on the surface of okra extract, at 40 °C. | |
The existence of both non-polar and polar sites on the okra matrix is important in interpreting phenomena such as the extraction of the mucilage during processing and cooking, as the most important stage of mucilage formation is the dissolution of the polysaccharide on an appropriate solvent (usually water) and the subsequent transfer to the bulk aqueous phase, where the polymer may exert its thickening capacity. Moreover, this can also account for the capacity of okra mucilage to act as an emulsifier,7 as the capability of a macromolecule to emulsify oil-in-water emulsions is largely dependent on the co-existence of non-polar and polar moieties.48
The principal electrolytic character of the surface is determined by means of the KB/KA ratio. The values of the enthalpy and entropy of adsorption of polar probes on the surface of okra are summarized in Table A3 (ESI†). Acetonitrile, an amphoteric probe, exhibits the highest value of ΔHsp among all probes; ethyl acetate, also an amphoteric probe exhibits the lowest ΔHsp value. These results indicate that the surface of the matrix is of amphoteric character. KA and KB values were calculated using eqn (7) and the intercept of the ΔHsp/AN* vs. DN/AN* plot. KA and KB for okra are 0.0461 and 0.7575, respectively. KB/KA equals to 16.43 ± 4.14, confirming the indication that okra extract matrix is predominantly Lewis basic.
It should be stressed here that “basicity” and “acidity” refer to dry, non-hydrated samples, and are relevant to the Lewis concept of an electrolyte as giver or receiver of electrons, and not to the Brønstedt–Lowry property of exchanging protons (“H+”) between acids and bases to which most chemists are acquainted to. The basicity of the okra matrix here is substantial, but the acidic character is also important, suggesting a rather amphiphilic nature of the surface of the entire matrix.
3.3 Bulk thermodynamic properties
3.3.1 Interaction parameters. The specific retention volumes (Vg) were measured for 20 probes at three different temperatures, namely 90, 100, and 110 °C. The examined temperatures are below the temperatures leading to thermal degradation of the okra extract under study, as measured by DSC and lower than the decomposition temperatures of the polymer, as measured by TGA (plot not shown). Temperatures are high in relation to the previously-mentioned set of surface characterization, as to allow for the diffusion of the probes to the interior of the okra structure. Three different groups of probes were used to determine the bulk thermodynamic properties of okra: non-polar alkanes ranging from n-heptane to n-dodecane (used as to assess the non-specific, that is non-polar, interactions); polar non-hydrogen bonding aromatic hydrocarbons, ketones, acetonitrile (used as to assess specific, that is polar, interactions); and hydrogen bonding probes, such as alcohols, 1,4-dioxane and pyridine. The probes' specific retention volumes, Vg, were calculated from to eqn (8). These values are summarized in Table 1. As has been mentioned earlier, Vg is a direct measure of the interactions between each probe and the okra extract material.
Table 1 Specific retention volumes, Vg (cm3 g−1) of various probes at 90, 100 and 110 °C
Probes |
90 °C |
100 °C |
110 °C |
n-Heptane |
0.49 |
0.45 |
0.37 |
n-Octane |
1.01 |
0.95 |
0.86 |
n-Nonane |
1.82 |
1.68 |
1.27 |
n-Decane |
3.64 |
2.59 |
2.04 |
n-Undecane |
6.76 |
5.10 |
4.01 |
n-Dodecane |
12.00 |
8.69 |
7.09 |
Tetrahydrofuran |
0.42 |
0.40 |
0.39 |
Chloroform |
0.40 |
0.35 |
0.17 |
Acetonitrile |
0.44 |
0.42 |
0.40 |
n-Butanol |
1.72 |
1.24 |
1.08 |
Ethanol |
0.33 |
0.27 |
0.21 |
Ethyl acetate |
0.25 |
0.21 |
0.13 |
Pyridine |
2.33 |
1.77 |
1.37 |
Methyl acetate |
0.12 |
0.10 |
0.09 |
1,4-Dioxane |
0.84 |
0.71 |
0.55 |
1-Propanol |
0.54 |
0.38 |
0.36 |
2-Pentanone |
0.63 |
0.54 |
0.44 |
Cyclopentanone |
1.70 |
1.33 |
1.18 |
1-Nitropropane |
1.16 |
1.13 |
0.84 |
Methanol |
1.26 |
1.20 |
1.16 |
As can be observed from the values in Table 1, the specific retention volume Vg of each probe decreases with increasing temperature. This behavior is reasonable and can be explained by the fact that the temperature rise makes molecules move faster, which in turn makes for a smaller volume of carrier gas. Considering that the retention volume is a direct indication of the interactions between probe and column material, interactions become weaker as the temperature increases. These data have been used as to calculate the entropy of the direct sorption of the probes at the okra material surface. These values presented in Table 2 are the molar enthalpies of sorption of the probes, ΔHs1, as calculated from the slopes of Vg versus T−1 according to eqn (9). A satisfactory linear fitting is obtained, which indicates that equilibrium between the probes and the polymer was achieved.
Table 2 The molar heats of sorption, ΔHs1, the partial molar heats of mixing, ΔH∞1 of various probes on okra extract and the heats of vaporization, ΔHva, at 90–110 °C
Probes |
ΔHs1 (kJ mol−1) |
ΔH∞1 (kJ mol−1) |
ΔHva (kJ mol−1) |
ΔHvb (kJ mol−1) at 373 K |
Calculated according to eqn (11). From Daubert & Danner.39 |
n-Heptane |
−17.14 |
15.30 |
32.44 |
31.63 |
n-Octane |
−9.45 |
27.38 |
36.83 |
36.45 |
n-Nonane |
−20.48 |
20.41 |
41.26 |
41.13 |
n-Decane |
−33.36 |
12.33 |
45.68 |
45.42 |
n-Undecane |
−30.14 |
20.08 |
50.22 |
50.25 |
n-Dodecane |
−30.54 |
24.00 |
54.54 |
54.61 |
Tetrahydrofuran |
−3.00 |
25.72 |
28.72 |
27.83 |
Chloroform |
−48.15 |
−20.44 |
27.72 |
27.11 |
Acetonitrile |
−2.50 |
28.10 |
30.60 |
29.12 |
n-Butanol |
−27.00 |
18.54 |
45.54 |
45.26 |
Ethanol |
−25.25 |
13.10 |
38.35 |
37.45 |
Ethyl acetate |
−37.54 |
−6.38 |
31.16 |
30.43 |
Pyridine |
−30.42 |
5.93 |
36.35 |
36.06 |
Methyl acetate |
−0.48 |
27.62 |
28.11 |
27.45 |
1,4-Dioxane |
−24.62 |
9.62 |
34.24 |
34.45 |
1-Propanol |
−23.80 |
18.04 |
41.85 |
41.30 |
2-Pentanone |
−20.65 |
13.61 |
34.25 |
33.60 |
Cyclopentanone |
−21.47 |
16.85 |
38.32 |
38.16 |
1-Nitropropane |
−17.39 |
21.60 |
38.99 |
38.91 |
Methanol |
−4.77 |
30.23 |
35.00 |
32.71 |
The enthalpic changes occurring during the sorption process depend on the interaction between each probe and the polymer. The number of CH2 groups of each member of the n-alkanes series affects the value of ΔHs1. This enthalpy is due to each CH2 group interacting with the column-filling material (here dry okra extract) via dispersive forces. ΔHs1 values of n-alkanes increase with the number of carbon atoms, leading to an increasingly exothermic process, as these molecules lose their kinetic energy as to interact with the solid matrix of the column. As the sorption of the probes to the okra matrix creates a non-uniform distribution profile, a substantial entropic component is also created. The molar free energy of sorption and the entropy of sorption were calculated according to eqn (12) and (14), respectively. The sorption parameters ΔGs1 and ΔSs1 are given in Tables A4 and A5 (ESI†).
A careful read of Tables 2, A4 and A5† shows that the enthalpic and the entropic components are, in terms of absolute values, of the same order of size. What can be noticed is that, while the enthalpic term can be exothermic, the free energy is generally endothermic, while the values of the molar heats of sorption of the probes are strongly dependent on the type of probe. That suggests that, during okra cooking and processing, okra solvation at the fruit matrix is, at a first level, an enthalpy-driven process, as direct interactions between solvent and solute in the form of both non-specific (London) and non-specific (polar, ionic & hydrogen) interactions.
The molar heat of mixing ΔH∞1 was obtained from the slope of ln
Ω∞1 versus T−1, using eqn (10). The values of the molar heats of sorption, the heats of mixing, and the heats of vaporization are reported in Table 2. The heats of vaporization, ΔHv are comparable with literature values for all the probes, suggesting that the experimental values of the molar heats of sorption and of mixing are well-fit as to be used in the subsequent calculations. As the free energy component of these processes is generally positive (endothermic), it appears that there is no direct spontaneity in the solvation of okra polymers. In order to assess the conditions for the spontaneity of hydration/wetting of okra macromolecules, the data were treated with the Flory–Huggins approach for polymer interactions.
The weight fraction activity coefficient, Ω∞1, and the Flory–Huggins interaction parameter, χ∞12, are indicative of the polymer–solvent compatibility. Theoretically, if Ω∞1 is lower than 5, the probe can be considered as a good solvent for the polymer, whereas if 5 < Ω∞1 < 10, the probe is characterized as a moderate solvent; values of 10 or above imply poor polymer–solvent compatibility.49 As far as the Flory–Huggins interaction parameter, χ∞12 is concerned, χ∞12 values lower than 0.5 stand for favorable polymer–solvent interactions, while values higher than 0.5 stand for unfavorable polymer–solvent interactions. The values of the calculated parameters are given in Tables 3 and 4.
Table 3 Weight fraction activity coefficients, ln
Ω∞1 of various probes at 90, 100 and 110 °C
Probes |
90 °C |
100 °C |
110 °C |
n-Heptane |
6.42 |
6.14 |
6.15 |
n-Octane |
6.41 |
6.14 |
5.93 |
n-Nonane |
6.52 |
6.24 |
6.17 |
n-Decane |
6.56 |
6.49 |
6.34 |
n-Undecane |
6.65 |
6.48 |
6.31 |
n-Dodecane |
6.80 |
6.63 |
6.38 |
Tetrahydrofuran |
5.95 |
5.74 |
5.50 |
Chloroform |
5.35 |
5.26 |
5.71 |
Acetonitrile |
7.01 |
6.92 |
6.53 |
n-Butanol |
6.28 |
6.20 |
5.96 |
Ethanol |
6.90 |
6.75 |
6.67 |
Ethyl acetate |
6.58 |
6.46 |
6.70 |
Pyridine |
5.61 |
5.56 |
5.51 |
Methyl acetate |
6.91 |
6.89 |
6.43 |
1,4-Dioxane |
6.11 |
5.97 |
5.94 |
1-Propanol |
6.85 |
6.82 |
6.53 |
2-Pentanone |
6.44 |
6.28 |
6.21 |
Cyclopentanone |
6.35 |
6.25 |
6.05 |
1-Nitropropane |
6.75 |
6.38 |
6.37 |
Methanol |
5.45 |
5.19 |
4.93 |
Table 4 Flory–Huggins interaction parameters, χ∞12 of various probes at 90, 100 and 110 °C
Probes |
90 °C |
100 °C |
110 °C |
n-Heptane |
4.74 |
4.45 |
4.45 |
n-Octane |
4.77 |
4.49 |
4.27 |
n-Nonane |
4.91 |
4.61 |
4.54 |
n-Decane |
4.97 |
4.89 |
4.73 |
n-Undecane |
5.08 |
4.90 |
4.71 |
n-Dodecane |
5.24 |
5.06 |
4.80 |
Tetrahydrofuran |
4.54 |
4.31 |
4.06 |
Chloroform |
4.46 |
4.34 |
4.78 |
Acetonitrile |
5.46 |
5.35 |
4.94 |
n-Butanol |
4.79 |
4.70 |
4.44 |
Ethanol |
5.37 |
5.21 |
5.12 |
Ethyl acetate |
5.17 |
5.04 |
5.25 |
Pyridine |
4.32 |
4.26 |
4.19 |
Methyl acetate |
5.53 |
5.50 |
5.01 |
1,4-Dioxane |
4.86 |
4.71 |
4.67 |
1-Propanol |
5.35 |
5.31 |
5.00 |
2-Pentanone |
4.94 |
4.77 |
4.67 |
Cyclopentanone |
5.02 |
4.91 |
4.70 |
1-Nitropropane |
5.47 |
5.09 |
5.07 |
Methanol |
3.93 |
3.65 |
3.37 |
The weight fraction activity coefficient of the examined range of solvents for okra shows that they are insoluble in many organic solvents, these data being of potential interest for pharmaceutical (encapsulation) uses. This is important, as the use of a biomaterial as (micro)encapsulant is strongly related to its selective solubility in specific solvents, and the selective solubility of other molecules (encapsulated materials) to the polymer itself. This reduces the problem of selecting microcapsules and establishing the controlled release conditions to calculating simple thermodynamical parameters, at least as a first approach to designing a controlled delivery vehicle. As shown in Tables 3 and 4, within the investigated temperature range, most solvents can be characterized as poor solvents. Solvents which could be considered as moderate are methanol, tetrahydrofuran and pyridine. The molar free energies of mixing, ΔG∞1, were calculated from eqn (13) and the values are listed in Table A6 (ESI†). These data can be used as a first approach in designing controlled-release vehicles and triggering conditions for the release of an encapsulated material.
3.3.2 Solubility parameters. The above can be quantified as to provide maps for the solubility of okra mucilage in a series of solvents, as to allow for the tuning of its utilization as an encapsulant or solute. The solubility parameters δd, δp and δh that can be yielded by such an approach contain valuable information, as they quantify the dispersive, polar and hydrogen bonding interactions, respectively, allowing for the separate assessment of the contribution of each one of the interactions.According to the methodology of Voelkel and Janas,43 the partial and total solubility parameters of okra can be determined from the eqn (18)–(21). The experimental data for the three different temperatures are shown in Table 5. In all cases, the correlation coefficients are high. In general terms, a negative correlation exists between the solubility parameters' absolute value with temperature. The total and dispersive components of the solubility parameter of okra decrease linearly with temperature (Table 5), contrary to the hydrogen bonding components. The increase of δh with temperature has often been observed in literature.13,14,16,18,50 Such behaviour could attributed to orientation, steric hindrance, or group exposure, which might be influenced by the variable arrangement of the polymeric chain18 of a macromolecule arranged on the bulk okra material. That suggests that the bulk structure of the okra macromolecules assembly is stabilized via hydrogen bonds; this is well-expected for a polysaccharide-based structure, and can hint that key to the dissolution of okra solid polysaccharide is the break-up of such interactions. It should be stressed that, however, as the standard error for the δ-values of the polar probes is substantial, one should avoid drawing conclusions based on these values alone.
Table 5 Solubility parameters (MPa)0.5 of okra at 90, 100 and 110 °C
T (°C) |
δd ± std |
δp ± std |
δh ± std |
δT ± std |
90 |
24.61 ± 0.83 |
0.30 ± 1.81 |
0.60 ± 0.05 |
24.70 ± 12.30 |
100 |
21.56 ± 0.81 |
2.33 ± 0.78 |
4.65 ± 0.29 |
22.11 ± 3.11 |
110 |
20.07 ± 1.50 |
0.96 ± 0.80 |
5.73 ± 0.09 |
20.87 ± 4.40 |
The partial solubility parameters of the probes at the experimental temperatures are shown in Table A7 (ESI†). The partial solubility parameters of the probes at 90, 100 and 110 °C were calculated according to the Hansen equations42 depending on the partial solubility parameters of the probes at 25 °C and are shown in Fig. 4 (also in ESI† for 100 and 110 °C). As shown in Fig. 4, within the investigated temperature range, most solvents can be characterized as poor solvents, with exceptions such as chloroform which can be considered a moderate solvent. These can be used to fine-tune the solvent systems to the okra extract, taking separately into account dispersion, specific and hydrogen bonding interactions. In fact, for the selection of solvent one may use two criteria: the value of χ∞12 or the Hansen's solubility distance. The latter does take into account the separate solubility parameter components. According to the first criterion (χ∞12) the best solvent for okra extract is methanol while according to the second criterion the best solvent is chloroform and this is schematically shown in Fig. 4 (also in ESI† for 100 and 110 °C).
 |
| Fig. 4 Partial solubility parameters in three dimensions (Hansen space) of okra at 90 °C. | |
4. Conclusions
The thermodynamic properties that have been calculated and are presented can provide a theoretical background for the predictive calculation and the interpretation of wetting, extraction, thickening, and adsorption of okra mucilage. In summation of the data themselves, the surface energy of okra decreases as the temperature increases within the investigated temperature range. Unhydrated okra extract is an amphoteric solid body of predominantly basic character. The solvation of the solid macromolecules which eventually leads to the transfer of the macromolecules to the bulk solvent and the formation of mucilage is an enthalpy-driven process. The Flory–Huggins interaction parameters and the weight fraction activity coefficients have been calculated, and may be used as a guide for predicting and tuning the solubility of okra in a number of media. Thermodynamic data are provided for both interface and bulk of the okra solids, which can be used as to model the behavior of okra mucilage during food processing, cosmetics/pharmaceutics formulation, and oral processing/digestion.
Acknowledgements
This research has been co-financed by the European Union (European Social Fund – ESF) and Greek national funds through the Operational Program “Education and Lifelong Learning” of the National Strategic Reference Framework (NSRF) – Research Funding Program: ARCHIMEDES III.
References
- R. L. Whistler and H. E. Conrad, J. Am. Chem. Soc., 1954, 76, 1673–1674 CrossRef CAS.
- P. A. Karakoltsidis and S. M. Constantinides, J. Agric. Food Chem., 1975, 23, 1204–1207 CrossRef CAS PubMed.
- N. Senghamparn, R. Verhoef, H. A. Schols, T. Sajjaanantakul and A. G. J. Voragen, Carbohydr. Res., 2009, 344, 1824–1832 CrossRef PubMed.
- N. Sengkhamparn, E. J. Bakx, R. Verhoef, H. A. Schols, T. Sajjaanantakul and A. G. J. Voragen, Carbohydr. Res., 2009, 344, 1842–1851 CrossRef CAS PubMed.
- K. Alba, A. P. Laws and V. Kontogiorgos, Food Hydrocolloids, 2015, 43, 726–735 CrossRef CAS.
- V. Kontogiorgos, I. Margelou, N. Georgiadis and C. Ritzoulis, Food Hydrocolloids, 2012, 29, 356–362 CrossRef CAS.
- K. Alba, C. Ritzoulis, N. Georgiadis and V. Kontogiorgos, Food Res. Int., 2013, 54, 1730–1737 CrossRef CAS.
- N. Georgiadis, C. Ritzoulis, G. Sioura, P. Kornezou, C. Vasiliadou and C. Tsioptsias, Food Hydrocolloids, 2011, 25, 991–999 CrossRef CAS.
- M. U. Ghori, K. Alba, A. M. Smith, B. R. Conway and V. Kontogiorgos, Food Hydrocolloids, 2014, 15, 342–347 CrossRef.
- N. D. Zaharuddin, M. I. Noordin and A. Kadivar, BioMed Res. Int., 2014, 2014, 735–891 Search PubMed.
- O. E. Adelakun, O. J. Oyedale, B. I. O. Ade-Omowaye, I. A. Adeyemi and M. van de Venter, Food Chem. Toxicol., 2009, 47, 1123–1126 CrossRef CAS PubMed.
- A. B. Nastasovic, A. B. Onjia, S. K. Milonjic and S. M. Jovanovic, Eur. Polym. J., 2005, 41, 1234–1242 CrossRef CAS.
- S. K. Papadopoulou, G. Dritsas, I. Karapanagiotis, I. Zuburtikudis and C. Panayiotou, Eur. Polym. J., 2010, 46, 202–208 CrossRef CAS.
- S. K. Papadopoulou and C. Panayiotou, J. Chromatogr. A, 2012, 1229, 230–236 CrossRef CAS PubMed.
- G. S. Dritsas, K. Karatasos and C. Panayiotou, J. Polym. Sci., Part B: Polym. Phys., 2008, 46, 2166–2172 CrossRef CAS.
- G. S. Dritsas, K. Karatasos and C. Panayiotou, J. Chromatogr. A, 2009, 1216, 8979–8985 CrossRef CAS PubMed.
- J. M. R. C. A. Santos, K. Fagelman and J. T. Guthrie, J. Chromatogr. A, 2002, 969, 119–132 CrossRef CAS PubMed.
- K. Adamska and A. Voelkel, Int. J. Pharm., 2005, 304, 11–17 CrossRef CAS PubMed.
- E. Papirer, H. Balard and A. Vidal, Eur. Polym. J., 1988, 24, 783–790 CrossRef CAS.
- N. M. Ahfat, G. Buckton, R. Burrows and M. D. Ticehurst, Eur. J. Pharm. Sci., 2000, 9, 271–276 CrossRef CAS PubMed.
- K. Batko and A. Voelkel, J. Colloid Interface Sci., 2007, 315, 768–771 CrossRef CAS PubMed.
- A. van Asten, N. van Veenendaal and S. Koster, J. Chromatogr. A, 2000, 888, 175–196 CrossRef CAS PubMed.
- F. Mutelet, G. Ekulu and M. Rogalski, J. Chromatogr. A, 2002, 969, 207–213 CrossRef CAS PubMed.
- M. N. Belgacem, A. Blayo and A. Gandini, J. Colloid Interface Sci., 1996, 182, 431–436 CrossRef CAS.
- N. Cordeiro, C. Gouveia and M. Jacob John, Ind. Crops Prod., 2011, 33, 108–115 CrossRef CAS.
- N. Cordeiro, A. Ornelas, A. Ashori, S. Sheshmani and H. Norouzi, Carbohydr. Polym., 2012, 87, 2367–2375 CrossRef CAS.
- U. Bertram and R. Bodmeier, Eur. J. Pharm. Biopharm., 2006, 63, 310–319 CrossRef CAS PubMed.
- C. Duclairoir, E. Nakache, H. Marchais and A. M. Orecchioni, Colloid Polym. Sci., 1998, 276, 321–327 CAS.
- C. M. Hansen, Prog. Org. Coat., 2004, 51, 77–84 CrossRef CAS.
- M. Dimopoulou, C. Ritzoulis and C. Panayiotou, Colloids Surf., A, 2015, 475, 37–43 CrossRef CAS.
- A. Voelkel, B. Strzemiecka, K. Adamska and K. Milczewska, J. Chromatogr. A, 2009, 1216, 1551–1566 CrossRef CAS PubMed.
- Z. Y. Al-Saigh, Int. J. Polym. Anal. Chem., 1997, 3, 249–291 CrossRef CAS.
- J. R. Young and C. L. Conder, Physicochemical measurements by gas chromatography, Wiley, Chichester, 1979 Search PubMed.
- G. M. Dorris and D. G. Gray, J. Colloid Interface Sci., 1980, 77, 353–362 CrossRef CAS.
- D. J. Brookman and D. T. Sawyer, Anal. Chem., 1968, 40, 106–110 CrossRef CAS.
- V. Gutmann, The donor–acceptor approach to molecular interactions, Plenum Press, New York, 1978 Search PubMed.
- D. P. Kamdem, S. K. Bose and P. Luner, Langmuir, 1993, 9, 3039–3044 CrossRef CAS.
- F. L. Riddle and F. M. Fowkes, J. Am. Chem. Soc., 1990, 112, 3259–3264 CrossRef CAS.
- T. E. Daubert and R. P. Danner, Physical and Thermodynamic Properties of Pure Compounds: Data Compilation, Hemisphere, New York, 2001 Search PubMed.
- J. Hildebrand and R. L. Scott, Regular Solution, Prentice-Hall, Englewood Cliffs, 1962 Search PubMed.
- G. Dipaola-Baranyi and J. E. Guillet, Macromolecules, 1978, 11, 228–235 CrossRef CAS.
- C. M. Hansen, Solubility Parameters: A User's Handbook, CRC Press, Boca Raton, 2007 Search PubMed.
- A. Voelkel and J. Janas, J. Chromatogr., 1993, 645, 141–151 CrossRef CAS.
- O. H. Lowry, N. J. Rosebrough, A. L. Farr and R. J. Randall, J. Biol. Chem., 1951, 193, 265–275 CAS.
- M. Gaborieau and P. Castingolles, Anal. Bioanal. Chem., 2011, 399, 1413–1423 CrossRef CAS PubMed.
- A. Aitken and P. Learmonth, in Protein determination by UV absorption, The protein protocols Handbook, ed. J. W. Walker, Humana Press, NY, 3rd edn, 2009 Search PubMed.
- G. Archana, K. Sabina, S. Babuskin, K. Radhakrishnan, M. A. Fayidh, P. Azhag Saravana Babu, M. Sivarajan and M. Sukumar, Carbohydr. Polym., 2013, 98, 89–94 CrossRef CAS PubMed.
- C. Ritzoulis, Introduction to the Physical Chemistry of Foods, CRC Press, Boca Raton, FL, 2013 Search PubMed.
- J. Klein and H. E. Jeberien, Makromol. Chem., 1980, 181, 1237–1249 CrossRef CAS.
- T. V. M. Sreekanth and K. S. Reddy, J. Appl. Polym. Sci., 2008, 108, 1761–1769 CrossRef CAS.
Footnote |
† Electronic supplementary information (ESI) available. See DOI: 10.1039/c5ra27785j |
|
This journal is © The Royal Society of Chemistry 2016 |
Click here to see how this site uses Cookies. View our privacy policy here.