Effect of sulfonated graphene oxide on the performance enhancement of acid–base composite membranes for direct methanol fuel cells

S. Neelakandana, Noel Jacob Kb, P. Kanagaraja, R. M. Sabarathinamc, A. Muthumeenala and A. Nagendran*a
aPG & Research Department of Chemistry, Polymeric Materials Research Lab, Alagappa Government Arts College, Karaikudi – 630 003, India. E-mail: nagimmm@yahoo.com; Fax: +91-4565-227497; Tel: +91-4565-224283
bMembrane Laboratory, Department of Chemical Engineering, ACT, Anna University, Chennai-600025, India
cFunctional Material Division, Central Electrochemical Research Institute, Karaikudi – 630 006, India

Received 24th December 2015 , Accepted 14th May 2016

First published on 17th May 2016


Abstract

Sulfonated poly(1,4-phenylene ether ether sulfone) (SPEES)/poly(ether imide) (PEI)/sulfonated graphene oxide (SGO) based proton exchange membranes (PEMs) were prepared by a solution casting method. The membranes were characterized for their tensile strength, thermal stability, electrochemical properties and physico-chemical properties using a universal testing machine, thermogravimetric analyzer, impedance spectroscopy and water uptake studies respectively. Compared with SPEES/PEI composite (SP) membranes, the ion exchange capacity, hydrophilicity and water uptake of the SP/SGO membranes were enhanced. Surface morphology of the composite membrane was investigated by atomic force microscopy (AFM) and scanning electron microscopy (SEM). AFM images reveal that the nodule size and surface roughness are increased by the incorporation of SGO. Tensile strength and proton conductivity of the composite membranes increased with increasing SGO content. A maximum conductivity of 8.87 × 10⁻³ S cm−1 was achieved at 25 °C upon addition of 0.8 wt% of SGO. All the SP/SGO membranes exhibited methanol permeability lower than 3.26 × 10⁻⁷ cm2 s−1, which was much lower than that of Nafion 117 (3.41 × 10⁻⁶ cm2 s−1). Furthermore, the composite membranes exhibited much higher relative selectivity compared with SP and Nafion 117 membranes. It was found that the SP/SGO-0.8 composite membrane appears to be a good candidate for use in DMFC applications.

1. Introduction

Environmental pollution and climate changes have turned out to be worldwide issues that have currently motivated researchers to find alternative sources of energy to diminish the reliance on non-renewable fossil fuels.1 Nowadays, polymer electrolyte fuel cells (PEFCs) have gained more interest due to their low level of pollution and environmental impact. In the last decade, direct methanol fuel cells (DMFCs) have drawn much attention mainly in the area of portable applications.2 PEM is a crucial part of the fuel cell, allowing facile transport of protons from anode to cathode as well as a barrier to prevent the direct contact of fuel and oxidant.3,4 Until now, perfluorosulfonated ionomers, such as Dupont’s Nafion membrane, are most commonly used as the PEM in DMFCs owing to their high proton conductivity, good physical and chemical stability. However, several disadvantages, such as high production cost, high methanol permeability, environmental inadaptability of fluorinated materials and difficulty in synthesizing, still hinders extensive commercialization.5 Therefore, many researchers have developed alternative membrane materials to overcome the aforementioned problems using various techniques such as graft copolymerization,6 radiation grafting,7 blending and sol–gel methods etc.8–11

Currently, chemically modified graphene is receiving great deal of attention in a wide range of application, such as energy related materials, sensors, field-effect transistors and biomedical applications.12–16 The interesting properties of graphene oxide (GO) like high surface area, inherent flexibility, electronic insulating property, thermal and excellent mechanical strength etc., make it an important material to be used as an organic filler for nano-composite membranes.17 GO can be easily modified because of oxygen containing functional groups such as carbonyl, hydroxyl and epoxy. For PEM preparation, GO nanosheets are usually sulfonated to achieve high proton conductivity. Jung et al., observed that the graphene reinforced Nafion composite shows improved water uptake and proton conductivity,18 while Zarrin et al., found higher water uptake and proton conductivity in a sulfonic acid functionalized GO–Nafion composite membrane compared to that of powdered GO.19 Later, in the work done by Gahlot et al., the composite membranes of sulfonated poly(ether sulfone) (SPES) incorporated with sulfonated GO (SGO) resulted in improved electrochemical properties.20

Sulfonated poly arylene ether sulfones/ketones, sulfonated poly imide and sulfonated poly phenylene oxide have been successfully used as polymer electrolyte membranes for DMFC applications. Among these polymers, poly(1,4-phenylene ether ether sulfone) (PEES) has good thermal stability, mechanical stability and film forming ability. It has been reported that, these types of polymer membranes achieve appropriate conductivities only at high ion exchange capacities (IEC), which causes an extremely high swelling, low oxidative stability and high methanol crossover. As a strategy to enhance the oxidative strength, dimensional stability and methanol resistance ability of the membranes, many approaches have been proposed. The polymer blending approach is one of the favored methods to improve PEM properties, as the required behavior of the two components can be combined in one blend.21 Recently we reported that blend membrane containing acidic (sulfonated PEES) and basic polymers (poly etherimide) (PEI) showed enhanced methanol resistance with improved oxidative and dimensional stability.22 These composite membranes had excellent methanol barrier properties with reasonable proton conductivity. Increasing the concentration of PEI improves the chemical stability of the highly sulfonated PEES matrix but reduces the proton conductivity. Addition of 15 wt% of PEI into the SPEES matrix shows promising performances such as good oxidative stability and higher membrane selectivity. In this study, SGO was synthesized and SPEES/PEI/SGO composite membranes were prepared with various content of SGO using the solution casting and evaporation method. It was expected to improve the proton conductivity when SGO was introduced into the SPEES/PEI composite membranes. The prepared composite membranes were characterized by proton conductivity, methanol permeability, water uptake, ion exchange capacity, dimensional and chemical stability.

2. Experimental

2.1 Materials

SPEES with a degree of sulfonation of 70% was obtained from direct sulfonation of PEES.22 PEI (Ultem® 1000) was supplied by GE plastics, India. Graphite (fine powder 98%) extra pure was purchased from Loba Chemie, Pvt. Ltd., India. N-Methyl-2-pyrrolidone (NMP) was purchased from Merck Millipore, India. All other chemicals used in this work were reagent grade and used as received. De-ionized water was used for all the experiments.

2.2 Preparation of GO and SGO

Graphene oxide was prepared from natural graphite flakes according to the procedure in Chen et al., using sulfuric acid and potassium permanganate.23 Typically 70 ml of concentrated sulfuric acid was cooled to 5 °C in a round bottom flask, and then 3 g graphite powder was added slowly into the flask with constant stirring. After 2 h, 9 g of potassium permanganate was slowly added to the solution to ensure that the temperature was maintained lower than 15 °C. After 30 min, the mixture was heated to 35–40 °C and stirred vigorously for 1 h. Then 150 ml of deionized water was added drop wise to this mixture then the temperature of the mixture was raised to 95 °C for 1 h. Finally, 500 ml of water was added followed by drop wise addition of 15 ml of H2O2 (30%) to the solution. Then the solid was filtered and washed with de-ionized water several times, filtered and dried under vacuum.

For sulfonation of SGO, 100 mg of GO was treated with a sufficient amount of 0.06 M sulfanilic acid solution at 70 °C.24 Under continuous stirring, 5 ml of sodium nitrate solution was added slowly and the reaction mixture was held at 80 °C for 12 h. After completion of the reaction, the solid mixture was collected by centrifugation and washed with de-ionized water several times until the pH value reached 7.

2.3 Preparation of the SPEES/PEI/SGO membrane

SPEES and PEI solutions were prepared by dissolving in NMP (15 wt%). Blends of SPEES (85%) and PEI (15%) were prepared by mixing two individual polymer solutions until they became homogeneous. Furthermore, a desired amount of the as prepared SGO was added to the above blend solution. The mixture was stirred and ultra-sonicated for 1 h to attain a homogeneous dispersion. The above dope solution was cast on a clean glass plate. The fabricated membranes were dried at 50 °C for 12 h and 80 °C for 30 h in a vacuum oven. The composite membranes were peeled off from the glass plate by immersing in DI water. Prepared membranes were designated as SP/SGO-X where SP is the SPEES/PEI blend and X is the weight percentage of SGO (0, 0.1, 0.2, 0.5 and 0.8 wt%).

2.4 Characterization methods

Fourier transform infrared (FTIR) spectroscopy of the GO, SGO and composite membranes was performed on a Bruker Optik Gmbzh (Tensor 27, Germany) with a wavelength range from 4000–400 cm−1. Zeta potential and particle size of the GO and SGO were measured using laser scattering analyses (Zetasizer ZS nano Maivern UK). Scanning electron microscopy (SEM) images of GO, SGO and composite membranes were studied using a scanning electron microscope (Hitachi S-3000H, Japan). AFM of the composite was performed with a scanning probe microscope (Model 5500, Agilent Technologies, USA) operating in tapping mode at room temperature in air.
2.4.1 Ion exchange capacity (IEC). IEC of the composite membranes was measured by the acid–base titration method. The dried and weighed membrane sample was immersed in a 1 M NaCl solution at 50 °C for two days to liberate H+ ions (the H+ ions in the membrane were replaced by Na+ ions). The solution was then titrated with 0.05 M NaOH solution using bromothymol blue as an indicator.
2.4.2 Water uptake and swelling ratio. The water uptake and swelling properties of the SP/SGO-X membranes were determined using water uptake measurements. The membrane samples were dried using a vacuum at 105 °C for 1 h and then 50 °C for 24 h prior to the measurements. After measuring the weights and lengths of dry membranes, the samples were soaked in de-ionized water at pre-determined temperatures for 24 h. The swollen membrane was taken out, wiped with tissue paper to remove the surface water, and then the swollen membrane was weighed and measured. The water uptake was calculated by:
image file: c5ra27655a-t1.tif

The swelling ratio of the membranes were calculated from the change of the film length using the following equation:

image file: c5ra27655a-t2.tif
where Lwet and Ldry is the length of the wet and dry membrane, respectively.

The lambda value of the membrane was calculated from the following equation:

image file: c5ra27655a-t3.tif
where WU is the water uptake, and Mw is the molecular weight of water (18.01 g mol−1).25

2.4.3 Oxidative and hydrolytic stability. The chemical stability was assessed by measuring the weight loss of the composite membrane (1.5 × 1.5 cm) in Fenton’s solution (3 wt% H2O2 containing 4 ppm FeSO4) at 68 °C for 2 h.26 The hydrolytic stability of the blend membranes was measured by comparing the IEC values before and after soaking the membranes in 60 °C water for two weeks.
2.4.4 Thermal analysis. The thermal stability of the membranes was analyzed using thermogravimetric analysis (TA Instruments SDT Q600) from 30 °C to 800 °C at a rate of 10 °C min−1, and the measurement was performed in nitrogen atmosphere.
2.4.5 Contact angle measurement. Water contact angle measurement was carried out using a contact angle goniometer (OCA 15EC, DATAPHYSICS Germany) at 25 °C. Droplets of DI water were placed at different places and at least 5 readings were taken to determine the average values.
2.4.6 Proton conductivity. Through plane proton conductivity of the composite membranes at 25 °C was measured using alternating current impedance spectroscopy (Autolab Potentiostat Galvanostat PGSTAT-30) over a frequency range of 1 MHz to 100 Hz with an oscillating voltage of 10 mV applied to the cell. Prior to measurement all the membranes were hydrated in water for 24 h. The conductivity of the sample was calculated from the following equation:
image file: c5ra27655a-t4.tif
where R and S is the resistance (ohm) and surface area (centimeter square) of the membranes respectively and d is the thickness (centimeter) of the membrane.
2.4.7 Methanol permeability. Methanol permeability of the prepared membranes was determined at 25 °C using a cell that consists of two half cells separated by the test membrane.27 30% methanol solution was placed on one side of the cell and water was placed on the other side. The test membrane was immersed in water for hydration before measuring for more than 24 h. Both cell solutions were kept stirring slightly during the permeation experiment. The methanol concentration on the water side was determined using a refractive index measurement (Refractometer ABBE NAR-3T). The methanol permeation was calculated from the following equation:
image file: c5ra27655a-t5.tif
where m is the slope of the straight line of concentration versus time, VB is the volume of the methanol side and A, L and CA is the membrane effective area, membrane thickness and feed concentration of methanol, respectively.
2.4.8 Relative selectivity. Relative selectivity is the ratio between proton conductivity and methanol permeability and indicates the membrane performance for DMFC application.
2.4.9 Mechanical strength of the composite membrane. Tensile strength of the composite membranes was determined at room temperature on a universal testing machine (Tinius Olsen, H10). Samples were cut into film strips of 20 mm in width and 70 mm in length. The samples were drawn at 5 mm min−1. Each reported value is the average of three measurements.

3. Results and discussion

3.1 Characterization of GO and SGO

The FTIR spectrum was employed to confirm the successful oxidation of graphite into GO and sulfonation of GO into SGO. The presence of different functional groups such as hydroxyl, carboxyl, epoxy etc., on GO was shown in Fig. 1a. It shows C[double bond, length as m-dash]C stretching at 1623 cm−1 and C–O deformation at 1390 cm−1.28,29 The peak at 1727 cm−1, 1234 cm−1 and 1055 cm−1 confirms the presence of carboxyl, epoxy and alkoxy functional groups.30 Presence of these peaks confirms the successful oxidation of graphite into GO. Fig. 1b shows the FTIR spectrum of SGO. By comparing Fig. 1a and b, two new characteristic peaks at 2920 cm−1 and 1180 cm−1 appear in the SGO spectra which are attributed to the absorption of the sulfonic acid group.18,29 A hydrogen bonded O–H stretching vibration is found at 3398 cm−1 for GO and SGO.
image file: c5ra27655a-f1.tif
Fig. 1 FTIR spectra of (a) GO and (b) SGO.

The oxidized graphite sheets prepared by the modified Hummers method have a thin sheet-like morphology. Fig. 2b shows SEM images of SGO and reveals that the structure of GO remains unchanged even after modification. The SGO sheets show a slightly more wrinkled structure and an increase in distance between successive sheets as reported by other researchers as well.


image file: c5ra27655a-f2.tif
Fig. 2 SEM images of (a) GO and (b) SGO and (c) digital photographs of the composite membranes.

A colloidal solution having a zeta potential of greater than ±40 mV is said to be highly stable as per the ASTM standards. The zeta potential values were measured at pH 6.5–7 (in DW) and the SGO dispersion showed excellent stability even up to one week. The zeta potential values of GO and SGO are −36.6 ± 3.5 mV and −58.6 ± 5 mV, respectively. The zeta potential value for functionalized GO is lower than that of pristine GO, which confirms the presence of SO3 groups introduced onto the GO backbone. The negatively charged group accounts for the electrostatic repulsion and keeping the successive carbon layers separated. The diameter of synthesized GO was 245 ± 24 nm, and after sulfonation, the GO size was 487 ± 36 nm.

3.2 Characterization of SP/SGO-X membranes

Blending of PEI was done to improve the properties such as oxidative stability, methanol resistance etc. of the SPEES membrane as well as to reduce the membrane manufacturing cost. Among them all, membranes prepared from the cast solution of SPEES/PEI-15% exhibit good oxidative stability with high relative selectivity; therefore SPEES/PEI-15% dope solution was used for further work.

Fig. 3 shows the FT-IR spectra of SP and SP/SGO composite membranes. The characteristic band of the imide group in SP appears at 1743 cm−1 and 1678 cm−1. The bands at 1164, 1116, and 1028 cm−1 are assigned to symmetric and asymmetric O[double bond, length as m-dash]S[double bond, length as m-dash]O stretching vibration of the –SO3H group in SP. Similar bands are observed for SP/SGO composite membranes. In addition, after the increment of SGO into the SP matrix, the band association with sulfonate groups (1164, 1116 cm−1) was shifted due to the interaction between SGO and the SP polymer.


image file: c5ra27655a-f3.tif
Fig. 3 FT-IR spectra of (a) SP, (b) SP/SGO-0.2 and (c) SP/SGO-0.8 membranes.
3.2.1 Ion exchange capacity. The IEC of the PEM provides information on the charge density of the membrane, which is an important factor associated with proton conductivity and the transport property of the membrane.31 Table 1 shows the IEC value of the prepared membranes. The IEC capacity of the SP membrane was 1.28 meq. g−1. The IEC of the composite membrane increases with increasing SGO content. This is due to the SGO contained –CO2H/–SO3H groups, responsible for high mobility of the ionizable group. With the increase in SGO content in the composite membrane, it becomes more hydrophilic and augments the suitable ion exchangeable sites.
Table 1 Properties of the composite membranes
Membrane code IEC, meq. g−1 λ value Swelling ratio, % Proton conductivity, S cm−1 Methanol permeability, cm2 s−1 Selectivity, ×104 S cm−3 s Tensile strength, MPa
25 °C 80 °C Dry state Wet state
a Data obtained from ref. 22.
SPa 1.28 14.3 6.8 18.3 5.32 × 10⁻³ 3.26 × 10⁻⁷ 1.63 31.3 28.9
SP/SGO-0.1 1.30 14.6 7.1 18.9 5.86 × 10⁻³ 3.19 × 10⁻⁷ 1.83
SP/SGO-0.2 1.33 15.3 7.6 19.5 6.41 × 10⁻³ 3.05 × 10⁻⁷ 2.10 32.4 29.2
SP/SGO-0.5 1.39 16.1 8.2 20.3 7.02 × 10⁻³ 2.89 × 10⁻⁷ 2.43
SP/SGO-0.8 1.45 17.1 8.9 22.0 8.87 × 10⁻³ 2.96 × 10⁻⁷ 2.99 36.5 28.7


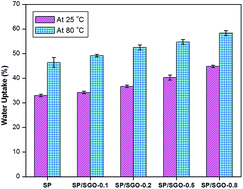
3.2.2 Water uptake and swelling ratio. The water uptake of the composite membranes plays a crucial role in proton transferring because it provides proton carriers in a vehicle type mechanism and forms a hydrogen bond network for Groutthuss type mechanism.32–34 As shown in Fig. 4 the water uptake of the prepared membranes increases with the increase in SGO content in the membrane. This is due to the hydrophilic groups of SGO, which can interact with water via an electrostatic bond or hydrogen bond. The water uptake of the SP/SGO-X membranes was measured at 25 °C and 80 °C as presented in Fig. 4. The water uptake of the composite membranes increases with an increase in temperature. The only possible reason is that polymer chain mobility increases at higher temperatures causing a larger space for water absorption.35 The SP/SGO-0.8 membrane possessed the highest water uptake of 44.8% at 25 °C and 58.3% at 80 °C owing to its mostly hydrophilic content. The number of water molecules absorbed per sulfonic acid group (designated as λ) was calculated using water uptake and IEC. From Table 1, λ value for the SP membrane is found to be 14.3, which is an increase with increasing SGO content due to the presence of highly acidic functionalized SGO. The λ value of the composite membrane was in the range of 14.6–17.1. The higher λ value in the composite membranes is responsible for formation of an ionic cluster in the membrane.
image file: c5ra27655a-f4.tif
Fig. 4 Water uptake of the composite membranes.

Swelling ratio is also considered as an important parameter for the practical utilization of PEM in DMFCs.36 As shown in Table 1, the swelling ratio of the composite membranes displays a similar dependence to that of water uptake. The swelling ratio of the composite membranes was in the range of 18.3–22.0% at 80 °C. An enhanced swelling ratio of SP/SGO-X composite membranes was attributed to the high hydrophilic membrane surface, which is due to the high density of carboxylic and sulfonic acid groups in SGO.37 The hydrophilic nature of the membrane surface was confirmed by contact angle measurement. The largest swelling ratio is 22.0% at 80 °C, which is slightly higher than that of Nafion 117 (21.7%).2 The above experimental results indicate that the SP/SGO-X membranes display a comparable swelling property with Nafion 117.

3.2.3 Oxidative stability. Fenton’s test provides an indication of the relative durability of a membrane from free radical attack under fuel cell operating conditions.38 The retained weight and rupture time of the composite membranes are shown in Fig. 5. It has been observed that SP/SGO-X membranes retained 95.6 wt% after immersion in Fenton’s solution, while the rupture time of the membrane decreases slightly due to an oxidative attack on the aromatic rings of the main chain by HO˙ and HOO˙ radicals. From the results, the impact on the radicals on the SP/SGO composite membranes was very low. This may be due to the stable nature of the SGO filler and the presence of oxygen containing functional groups on the SGO surface forming a hydrogen bonding network with the SP matrix, which may protect the polar groups of the SP matrix from attack by the radicals.39,40 This result demonstrates that the SP/SGO-X membrane has good oxidative stability against Fenton’s test.
image file: c5ra27655a-f5.tif
Fig. 5 Oxidative stability of the composite membranes.

The membranes did not break and did not lose their dimensional stability after 2 weeks of water immersion. It indicates that the SP/SGO-X membrane exhibits good hydrolytic stability.

3.2.4 Thermal stability. The thermal stability of the SP/SGO-X composite membranes was investigated by thermo gravimetric analysis (TGA). Fig. 6 shows the TGA curves of SP, SP/SGO-0.2, SP/SGO-0.5 and SP/SGO-0.8 membranes. It is obvious that all the composite membranes exhibited three stages of weight loss in the TGA curve. For the SP membrane, the initial weight loss below 150 °C was due to the evaporation of absorbed/bound water. The second weight loss started approximately around 274 °C, which was caused by the thermal decomposition of sulfonic acid groups. The third weight loss started at about 480 °C, which was attributed to the thermal decomposition of the polymer backbone. For the SP/SGO composite membranes, thermal degradation of SGO occurs in the second and third stages. In the second stage, the incorporated SGO retards the decomposition of SP chains as confirmed by their highest onset temperatures.29 The composite membranes displayed higher desulfonation and polymer backbone degradation temperatures compared to SP membranes due to the strong interaction between the SGO and SP polymer which hinders the polymer chain mobility.41,42 These results showed that the incorporation of SGO can improve the thermal stability of the composite membranes.
image file: c5ra27655a-f6.tif
Fig. 6 Thermal stability of the composite membranes.
3.2.5 Surface morphology of the membranes. The morphology of the composite membranes was investigated by SEM and AFM. Fig. 7a–c shows the SEM micrographs of the composite membranes. The SP membrane exhibited a smooth surface, while the SP/SGO membrane showed a relatively rough surface and incorporated SGO was well embedded in the SP matrix.37 Fig. 7d and e shows the cross section SEM images of SP and SP/SGO-0.8 membranes. The cross section of SP in Fig. 7d displays a relatively dense and slightly rougher cross section. Compared with the SP membrane, the cross section of SP/SGO-0.8 becomes rougher and reveals obvious wrinkles due to the strong interfacial interactions and SGO remains exfoliated in the SP matrix.29 The digital photographs of the SP and SP/SGO composite membranes are shown in Fig. 2c. The SP composite membranes lost their transparency with increasing SGO content in the membrane. Also the SGO particles were homogeneously dispersed in the SP matrix.
image file: c5ra27655a-f7.tif
Fig. 7 Top surface (a) SP, (b) SP/SGO-0.2 and (c) SP/SGO-0.8 and cross-section (d) SP and (e) SP/SGO-0.8 SEM images of the composite membranes.

Comparing the AFM images of SP and SP/SGO-X membranes in Fig. 8a–f, the surface morphology of the membranes had incurred considerable change after the addition of SGO particles. The surface roughness values of the prepared membranes are tabulated in Table 2. It reveals an increasing roughness value of the membrane with an increasing amount of SGO. This is due to the hydrogen bond formation between the oxygen containing functional groups of the SGO surface with the sulfonic acid group in the SP matrix, which gives good compatibility between the SGO with SP matrix.24,40 However, the surface roughness of the SP/SGO membrane was lower than that of the pristine SP membrane.


image file: c5ra27655a-f8.tif
Fig. 8 AFM images with a 2D and 3D view of the SP (a and d), SP/SGO-0.2 (b and e) and SP/SGO-0.8 (c and f) composite membranes.
Table 2 Surface roughness properties of the composite membranesa
Membrane Rm (nm) Rq (nm) Rz (nm) Contact angle, (°)
a Rm – the mean roughness, Rq – the root mean square of the Z data, and Rz – mean height of the roughness profile.
SP 4.66 5.35 20.1 64.4 ± 2.1
SP/SGO-0.2 1.15 1.44 7.33 61.3 ± 2.4
SP/SGO-0.8 1.29 1.58 7.71 56.1 ± 1.7


3.2.6 Contact angle measurement. The contact angle with water is a common measure of the hydrophilicity of a surface. It can be seen from Table 2 that the water contact angle of SP/SGO-X composite membranes is less than 90°, demonstrating their hydrophilic surface due to the presence of polar groups such as –OH, –SO3H and –COOH. The contact angle of the SP membrane is 64.4°. However, this value changes to 56.1° after incorporation of 0.8 wt% of SGO, indicating the enhancement of hydrophilicity due to the increment of aforementioned hydrophilic groups.
3.2.7 Proton conductivity. Proton conductivity is a key property of a PEM and it is necessary to be high for their effective utilization in fuel cell devices. Initially, all the membrane samples were immersed in DI water for one day and then reached a fully hydrated condition.43 From Table 1, the proton conductivity value of the SP/SGO-X membranes is higher than those of SP membranes. The presence of two different acidic groups (–CO2H, –SO3H) in the membrane brings about more facile proton transport.44 The SP membrane shows a conductivity of 5.32 × 10⁻³ S cm−1, which is raised up to 8.87 × 10⁻³ S cm−1 for the SP/SGO-0.8 membrane. Since water uptake of the composite membrane increases, the protons are effortlessly passing through the hydrogen bond network of the water molecules. Hydrogen bonding is an important factor for proton mobility in PEMs. Protons are transported in a PEM via the formation and breakage of hydrogen bonds between a water molecule and functionalities in the polymer. As is well known, hydroxyl groups have the potential to produce hydrogen bonds with water molecules and other hydroxyl groups.45,46
3.2.8 Methanol permeability. Methanol permeability through the PEM from anode to cathode would poison the electro-catalyst at the anode and reduce the open circuit potential. Table 1 shows the methanol permeability of the prepared membranes measured at room temperature. The thickness of the membranes was about 110–125 μm for this methanol permeability measurement. As shown in Table 1, the SP membrane (3.26 × 10⁻⁷ cm2 S−1) displayed lower methanol permeability than the Nafion 117 membrane (3.41 × 10⁻⁶ cm2 S−1). Furthermore, the methanol permeability of SP membranes was significantly suppressed from 3.19 × 10⁻⁷ cm2 S−1 to 2.89 × 10⁻⁷ cm2 S−1 by incorporating an increasing SGO content from 0.1 to 0.5 wt%. The membrane with 0.8 wt% of SGO exhibit slightly higher methanol permeability, although they have a high IEC and conductivity. On one hand, SGO in the membrane acts as a methanol barrier by suppressing polymer chain mobility. So it may be decreasing the dimensions of ionic clusters for methanol permeation.47 On the other hand, more compact microstructures that were formed by the interaction between hydroxyl groups of SGO and the –SO3H group of the SP matrix reduces methanol transport through the membrane.
3.2.9 Relative selectivity. Table 1 shows the relative selectivity of the SP and SP/SGO-X membranes at room temperature. As can be seen, all the SGO incorporated membranes had higher selectivity values than the SP membrane and Nafion 117 membrane. From Table 1, higher selectivity was observed for the SGO incorporated composite membranes due to their lower methanol permeability and high proton conductivity. Moreover, the relative selectivity of the membranes increased with increasing SGO content. The highest selectivity value was obtained for the SP/SGO-0.8 membrane (2.99 × 10⁴ S cm−3 s), which was about 56% higher than that of the unmodified membrane and 186% higher than that of the Nafion 117 membrane. Table 3 shows the comparison of the present results with others reported in the literature. The relative selectivity of the SGO based membranes was higher than that of Nafion 117, but compared with other studies it has lower relative selectivity. This is because of the lower proton conductivity of the SP membrane.
Table 3 Comparison of GO based PEMs
Membrane Proton conductivity, S cm−1 Methanol permeability, cm2 s−1 Selectivity, S cm−3 s Reference
SP/SGO-0.8 8.87 × 10⁻³ 2.96 × 10⁻⁷ 2.99 × 10⁴ Present work
SPI/SPSCO-8 9.62 × 10⁻² 14.6 × 10⁻⁷ 7.34 × 10⁴ 20
Nafion/2 wt% GO 4.0 × 10⁻² 7.92 × 10⁻⁷ 5.05 × 10⁴ 42
NSBC/GO-8 5.28 × 10⁻² 19.02 × 10⁻⁷ 2.78 × 10⁴ 44
NSBC/NMPSGO-8 8.87 × 10⁻² 16.93 × 10⁻⁷ 5.24 × 10⁴ 44
SPEEK/GO 1.48 × 10⁻³ 48
SPEEK/GO 1.41 × 10⁻² 49
MGO-SCH-5 6.77 × 10⁻² 1.01 × 10⁻⁶ 6.71 × 10⁴ 50
PVA/GLA/SGO 4.1 × 10⁻² 51


3.2.10 Mechanical properties. Tensile strength of the composite membranes is shown in Table 1. The SP membrane and SP/SGO-0.2 and SP-SGO-0.8 were chosen as representatives. The SP membrane showed an acceptable tensile strength of 31.3 MPa in its dry state. The results from the table indicate that the addition of SGO into the SP polymer matrix can improve the tensile strength of the composite membranes. The tensile strength value of the composite membrane reached a maximum value of 36.5 MPa at a SGO content of 0.8 wt%, whereas 0.2 wt% reached 32.4 MPa. The maximum tensile strength was attributed to the uniform distribution of SGO in the polymer matrix52 and the mutual interaction between the sulfonic acid group of SGO and SPEES and the imide group of PEI which helped to distribute the stress throughout the membrane.

The tensile strength of the composite membranes was studied both dry and in completely water saturated conditions. From the results, the tensile strength of the composite membranes in wet condition was lower than those in dry condition. This is due the water plasticization for polymer chains.53 Under a wet condition, the SP/SGO-0.8 membrane has lower tensile strength than the SP and SP/SGO-0.2 membrane. It might be due to the higher water absorption in the SP/SGO-0.8 membrane.

4. Conclusions

SP/SGO-X composite membranes were prepared by a solution casting method. The essential characteristics such as water uptake, ion exchange capacity, swelling ratio, proton conductivity and methanol permeability of the composite membranes were investigated. The water uptake and IEC of the composite membranes were increases with increasing SGO content. The AFM study showed that the addition of SGO into the SP matrix increases the surface roughness of the membranes. The introduction of SGO (additional hydrophilic groups) into the membrane matrix helps to form hydrogen bonds and thus increases the proton conductivity. These composite membranes exhibit good dimensional and thermal stability. Methanol permeability decreases gradually from 3.26 × 10⁻⁷ cm2 s−1 to 2.89 × 10⁻⁷ cm2 s−1 with increasing SGO content from 0.1 to 0.5 wt%. Although, proton conductivities of the SP/SGO-X membranes were higher than those of the SP membrane, and a higher selectivity value was found for the SP/SGO-0.8 membrane. All the results suggest that the SP/SGO-X composite membranes offer the possibility for good performance in DMFCs.

Acknowledgements

This work was supported by the University Grants Commission (UGC), Government of India, under the F. No. 41-219/2012. This support is gratefully acknowledged.

References

  1. H. Ilbeygi, M. Ghasemi, D. Emadzadeh, A. F. Ismail, S. M. J. Zaidi, S. A. Aljlil, J. Jaafer, D. martin and S. Keshani, Int. J. Hydrogen Energy, 2015, 40, 477–487 CrossRef CAS.
  2. S. Neelakandan, P. Kanagaraj, R. M. Sabarathinam and A. Nagendran, Appl. Surf. Sci., 2015, 359, 272–279 CrossRef CAS.
  3. H. Gao and K. Lian, RSC Adv., 2014, 4, 33091–33113 RSC.
  4. A. Muthumeenal, S. S. Pethaiah and A. Nagendran, Renewable Energy, 2016, 91, 75–82 CrossRef CAS.
  5. S. Zhong, X. Cui, T. Fu and H. Na, J. Power Sources, 2008, 180, 23–28 CrossRef CAS.
  6. G. Zhai, E. T. Kang and K. G. Neoh, Macromolecules, 2004, 37, 7240–7249 CrossRef CAS.
  7. L. Gubler, N. Prost, S. A. Gürsel and G. G. Scherer, Solid State Ionics, 2005, 176, 2849–2860 CrossRef CAS.
  8. M. Prasad, S. Mohanty and S. K. Nayak, RSC Adv., 2014, 4, 61178–61186 RSC.
  9. S. Neelakandan, P. Kanagaraj, A. Nagendran, D. Rana, T. Matsuura and A. Muthumeenal, Renewable Energy, 2015, 78, 306–313 CrossRef CAS.
  10. A. Muthumeenal, S. Neelakandan, D. Rana, T. Matsuura, P. Kanagaraj and A. Nagendran, Fuel Cells, 2014, 14(6), 853–861 CrossRef CAS.
  11. A. Muthumeenal, S. Neelakandan, P. Kanagaraj and A. Nagendran, Renewable Energy, 2016, 86, 922–929 CrossRef CAS.
  12. D. R. Dreyer, S. Park, C. W. Bielawski and R. S. Ruoff, Chem. Soc. Rev., 2010, 39, 228–240 RSC.
  13. A. K. Geim and K. S. Novoselov, Nat. Mater., 2007, 6, 183–191 CrossRef CAS PubMed.
  14. L. M. Lu, H. B. Li, F. Qu, X. B. Zhang, G. L. Shen and R. Q. Yu, Biosens. Bioelectron., 2011, 26, 3500–3504 CrossRef CAS PubMed.
  15. X. Wang, Y. Ouyang, X. Li, H. Wang, J. Guo and H. Dai, Phys. Rev. Lett., 2008, 100, 206803 CrossRef PubMed.
  16. Y. Zhang, T. R. Nayak, H. Hong and W. Cai, Nanoscale, 2012, 4, 3833–3842 RSC.
  17. S. Gahlot, P. P. Sharma, H. Gupta, V. Kulshrestha and P. K. Jha, RSC Adv., 2014, 4, 24662–24670 RSC.
  18. J. H. Jung, J. H. Jeon, V. Sridhar and I. K. Oh, Carbon, 2011, 49, 1279–1289 CrossRef CAS.
  19. H. Zarrin, D. Higgins, Y. Jun, Z. Chen and M. Fowler, J. Phys. Chem. C, 2011, 115, 20774–20781 CAS.
  20. S. Gahlot, P. P. Sharma, V. Kulshrestha and P. K. Jha, ACS Appl. Mater. Interfaces, 2014, 6, 5595–5601 CAS.
  21. S. G. Peera, S. Meenakshi, K. H. Gopi, S. D. Bhat, P. Sridhar and S. Pitchumani, RSC Adv., 2013, 3, 14048–14056 RSC.
  22. S. Neelakandan, P. Kanagaraj, R. M. Sabarathinam, A. Muthumeenal and A. Nagendran, J. SolidState Electrochem., 2015, 19, 1755–1764 CrossRef CAS.
  23. J. Chen, B. Yao, C. Li and G. Shi, Carbon, 2013, 64, 225–229 CrossRef CAS.
  24. H. C. Chien, L. D. Tsai, C. P. Huang, C. Y. Kang, J. N. Lin and F. C. Chang, Int. J. Hydrogen Energy, 2013, 38, 13792–13801 CrossRef CAS.
  25. Y. Li, M. Xie, X. Wang, D. Chao, X. Liu and C. Wang, Int. J. Hydrogen Energy, 2013, 38, 12051–12059 CrossRef CAS.
  26. L. Zhang and S. Mukerjee, J. Electrochem. Soc., 2006, 153, A1062–A1072 CrossRef CAS.
  27. S. Neelakandan, D. Rana, T. Matsuura, A. Muthumeenal, P. Kanagaraj and A. Nagendran, Solid State Ionics, 2014, 268, 35–41 CrossRef CAS.
  28. L. Cao, Q. Sun, Y. Gao, L. Liu and H. Shi, Electrochim. Acta, 2015, 158, 24–34 CrossRef CAS.
  29. L. Zhao, Y. Li, H. Zhang, W. Wu, J. Liu and J. Wang, J. Power Sources, 2015, 286, 445–457 CrossRef CAS.
  30. T. Kuila, A. K. Mishra, P. Khanra, N. H. Kim, M. E. Uddin and J. H. Lee, Langmuir, 2012, 28, 9825–9833 CrossRef CAS PubMed.
  31. C. Klaysom, B. P. Ladewig, G. M. Lu and L. Wang, J. Membr. Sci., 2011, 368(1), 48–53 CrossRef CAS.
  32. G. He, J. Zhao, S. Hu, L. Li, Z. Li, Y. Li, Y. Li, H. Wu, X. Yang and Z. Jiang, ACS Appl. Mater. Interfaces, 2014, 6, 15291–15301 CAS.
  33. S. J. Peighambardoust, S. Rowshanzamir and M. Amjadi, Int. J. Hydrogen Energy, 2010, 35, 9349–9384 CrossRef CAS.
  34. L. Vilčiauskas, M. E. Tuckerman, G. Bester, S. J. Paddison and K. D. Kreuer, Nat. Chem., 2012, 4, 461–466 CrossRef PubMed.
  35. Q. Li, L. Liu, Q. Miao, B. Jin and R. Bai, Chem. Commun., 2014, 50, 2791–2793 RSC.
  36. S. Feng, Y. Shang, S. Wang, X. Xie, Y. Wang, Y. Wang and J. Xu, J. Membr. Sci., 2010, 346(1), 105–112 CrossRef CAS.
  37. R. P. Pandey, A. K. Thakur and V. K. Shahi, ACS Appl. Mater. Interfaces, 2014, 6, 16993–17002 CAS.
  38. K. H. Lee, S. Y. Lee, D. W. Shin, C. Wang, S. H. Ahn, K. J. Lee, M. D. Guiver and Y. M. Lee, Polymer, 2014, 55, 1317–1326 CrossRef CAS.
  39. R. P. Pandey and V. K. Shahi, J. Power Sources, 2015, 299, 104–113 CrossRef CAS.
  40. Y. He, C. Tong, L. Geng, L. Liu and C. Lü, J. Membr. Sci., 2014, 458, 36–46 CrossRef CAS.
  41. Y. He, J. Wang, H. Zhang, T. Zhang, B. Zhang, S. Cao and J. Liu, J. Mater. Chem. A, 2014, 2, 9548–9558 CAS.
  42. B. G. Choi, Y. S. Huh, Y. C. Park, D. H. Jung, W. H. Hong and H. Park, Carbon, 2012, 50, 5395–5402 CrossRef CAS.
  43. C. Wang, B. Shen, H. Dong, W. Chen, C. Xu, J. Li and Q. Ren, Electrochim. Acta, 2015, 145–150 CrossRef.
  44. R. P. Pandey and V. K. Shahi, RSC Adv., 2014, 4, 57200–57209 RSC.
  45. Y. Kwon, S. Y. Lee, S. Hong, J. H. Jang, D. Henkensmeier, S. J. Yoo, H. J. Kim and S. H. Kim, Polym. Chem., 2015, 6, 233–239 RSC.
  46. M. Koinuma, C. Ogata, Y. Kamei, K. Hatakeyama, H. Tateishi, Y. Watanabe, T. Taniguchi, K. Gezuhara, S. Hayami, A. Funatsu, M. Sakata, Y. Kuwahara, S. Kurihara and Y. Matsumoto, J. Phys. Chem. C, 2012, 116, 19822–19827 CAS.
  47. T. Fu, S. Zhong, Z. Cui, C. Zhao, Y. Shi, W. Yu, H. Na and W. Xing, J. Appl. Polym. Sci., 2009, 111, 1335–1343 CrossRef CAS.
  48. J. X. Leong, W. R. R. Daud, M. Ghasemi, A. Ahmad, M. Ismail and K. B. Liew, Int. J. Hydrogen Energy, 2015, 40, 11604–11614 CrossRef CAS.
  49. W. Dai, L. Yu, Z. Li, J. Yan, L. Liu, J. Xi and X. Qiu, Electrochim. Acta, 2014, 132, 200–207 CrossRef CAS.
  50. P. P. Sharma and V. Kulshrestha, RSC Adv., 2015, 5, 56498–56506 RSC.
  51. H. Beydaghi, M. Javanbakht and E. Kowsari, Ind. Eng. Chem. Res., 2014, 53, 16621–16632 CrossRef CAS.
  52. R. Kumar, C. Xu and K. Scott, RSC Adv., 2012, 2, 8777–8782 RSC.
  53. Y. Gao, G. P. Robertson, M. D. Guiver, G. Wang, X. Jian, S. D. Mikhailenko, X. Li and S. Kaliaguine, J. Membr. Sci., 2006, 278, 26–34 CrossRef CAS.

This journal is © The Royal Society of Chemistry 2016
Click here to see how this site uses Cookies. View our privacy policy here.