Sorption mechanism(s) of orthophosphate onto Ca(OH)2 pretreated bentonite
Giorgos Markou*a,
Vassilis J. Inglezakisb,
Dimitris Mitrogiannisa,
Ilias Efthimiopoulosc,
Maria Psychoyoua,
Petros Koutsovitisd,
Koenraad Muylaerte and
Ioannis Baziotisa
aDepartment of Natural Resources Management and Agricultural Engineering, Agricultural University of Athens, Iera Odos 75, 11855 Athens, Greece. E-mail: markoug@aua.gr
bChemical Engineering Department, School of Engineering, Nazarbayev University, 53, Kabanbay batyr ave., 010000 Astana, Republic of Kazakhstan
cTheoretical and Physical Chemistry Institute, National Hellenic Research Foundation, 48 Vassileos Constantinou Avenue, Athens 11635, Greece
dInstitute of Geology and Mineral Exploration, Olympic Village Acharnae, Athens, Greece P.C. 13677
eLaboratory Aquatic Biology, KU Leuven Kulak, E. Sabbelaan 53, 8500 Kortrijk, Belgium
First published on 17th February 2016
Abstract
Bentonite was chemically pretreated with Ca(OH)2 to enhance orthophosphate phosphorus (OPP) sorption capacity (qe). The pretreatment resulted in an increase of qe from about 0.3 mg P per g to about 8 mg P per g at pH 7 and 25 °C, and of OPP concentration 100 mg P per L. The effects of solution pH, OPP concentration, sorbent dosage, and temperature on OPP sorption onto pretreated bentonite were investigated. The variation of initial pH (4–9) did not affect qe, however, re-adjustment of the final pH showed that the variation of the final pH had a significant positive effect on qe. The sorption kinetics showed a low rate, reaching half of qe in the first 4 h and equilibrium after 96 h. The calculated Langmuir qmax was 11.68 mg P per g. Thermodynamic analysis suggests that the sorption process is spontaneous and endothermic. Desorption of OPP was high in solutions of 0.1 M HCl and 0.01 EDTA-Na2 and reached 83% and 98%, respectively. We conclude that the predominant sorption mechanism for OPP uptake is inner-sphere surface complexation (ligand exchange). Other less important mechanisms such as surface precipitation and replacement of P5+ for Si4+ on the tetrahedral sites of montmorillonite may operate during the OPP uptake process by pretreated bentonite with Ca(OH)2.
1. Introduction
Phosphorus (P) is an essential nutrient for photosynthetic organisms and is the main cause of eutrophication of water bodies, such as rivers, lakes and the sea. P is widely used in the agricultural sector as a nutrient for plant production, either in the form of synthetic fertilizers or of manure. P takes various forms (organic and inorganic), but the most directly impacting one is the orthophosphate (PO43−) phosphorus (OPP) because it easily runs off from soil to water bodies.1 Several methods for its removal from wastewater have been developed including biological, chemical, physicochemical and electro-chemical.2 For P removal the most frequently used technology is through chemical precipitation with calcium, aluminum and iron salts. However, OPP precipitation has relative high costs, which may hinder its widespread application. Moreover, the product of OPP precipitation is a metal-phosphate sludge with relatively high phosphorus content, which is typically disposed because the recovery of phosphorus from sludge is very difficult.3 Therefore, a solid-phase OPP sorption may be advantageous over the OPP precipitation, due to the potential easier separation and recovery of OPP.Recently, removal of OPP by sorption has gained great interest.4,5 Natural materials such as bentonite and zeolite are frequently suggested as sorbents for the removal of various pollutants such as ammonium, heavy metal ions and dyes from aqueous environments.6–8 The advantage of many minerals is their abundance and their low cost.9,10 However, the capacity of clay minerals such as those hosted in bentonite (e.g. montmorillonite) for OPP sorption is very low mainly due to the negatively charged surface which repulses the uptake of anions by adsorption.11 Therefore their surface modification is required in order to enhance their OPP sorption capacity.6,12,13 However, the modification of bentonite with rare and/or expensive chemicals such as lanthanum14 decreases the application potential of bentonite as advantageous low-cost material. Therefore a more cost-effective pretreatment using common chemicals is desired. Moreover, the modification should not be associated by the formation and desorption of toxic compounds.12 Ca(OH)2 is an inexpensive chemical and Ca2+ is not harmful, displaying no environmental issues. Moreover, calcium is known to form complexes with OPP and could be used as nucleation sites of OPP on the surface of the host grain.15,16
Beside the environmental impact of OPP, its removal and recovery from wastewater is gaining more interest for one more reason, in particular its application potential for biomass production, reducing thereby the use of synthetic fertilizers.17–19 P is applied mostly as phosphate fertilizer, but P is not renewable and for the production of fertilizers fossil phosphate rocks as feedstock are used. A significant concern about phosphate fertilizers are that the worldwide phosphate reserves will become depleted in the near or far future.20 The availability of those essential nutrients is therefore of major interest for food and feed production. OPP sorption onto natural or modified minerals is of particular interest because on the one hand OPP could be easily recovered by chemical desorption, or on the other hand the OPP-loaded minerals could be applied to soils as fertilizing agents.
In a previous work, the pretreatment of organic materials (biomass of Phragmites sp.) with hydrated lime [Ca(OH)2] resulted to a drastic 22-fold increase of OPP sorption capacity,21 while in preliminary experiments it was also observed that bentonite pretreated with Ca(OH)2, named here as CaT-B, had a significant increase in OPP sorption capacity. The aim of this paper was to perform a detailed study on the sorption capacity of CaT-B to remove and recover phosphates from aqueous solutions. We used a range of complementary techniques—Scanning Electron Microscope (SEM), X-ray diffraction (XRD), and Infrared-attenuated total reflectance (IR-ATR)—to characterize the texture, composition and modal mineralogy of both the starting and treated materials. Finally, we examine the effects of solution pH, initial OPP concentration, sorbent dosage, and temperature, in order to assess the extent of the predominant sorption mechanism occurred during orthophosphate loading of CaT-B.
2. Materials and methods
2.1 Bentonite treatment
The bentonite used was commercially purchased and prior to experimentation it was rinsed several times with deionized (DI) water to wash-out impurities and unwanted particles, and dried overnight at moderate temperature (70 °C). Bentonite was sieved to obtain particle size of 300–1000 μm.2.2 Bentonite modification
The chemical pretreatment of the bentonite was performed by adding 100 g L−1 in saturated solution of 1 M Ca(OH)2 shaken for 24 h at room temperature. After the chemical pretreatment, CaT-B was thoroughly washed with deionized (DI) water and dried overnight at 70 °C. All chemicals used were of analytical grade.2.3 Sorption and desorption experiments
The sorption experiments were performed in the batch mode by placing 50 mL OPP solution and 10 g L−1 CaT-B in 100 mL capacity HDPE bottle (Nalgene), which was sealed and agitated with a horizontal agitation plate at 200 rpm for 72 h in order to reach equilibrium. The required equilibration time was studied separately and confirmed in separate kinetic experiments under various conditions, which will be analysed in a future work. The plate was placed in a temperature-controlled chamber. The effect of initial solution pH (4.0–9.0) on sorption capacity was determined at initial OPP concentration of 100 mg L−1 CaT-B dosage 10 g L−1, and 25 °C. The solution pH was adjusted using HCl and/or NaOH. The effect of CaT-B dosage (5, 10, 15, 20, and 25 g L−1) was investigated at initial OPP concentration of 100 mg P per L, pH 7 and 25 °C. The effect of initial OPP concentration and temperature on sorption capacity was studied in the range of 25–300 mg P per L and at 15–45 °C, respectively, at pH 7, and at a constant CaT-B dosage of 10 g L−1. All experiments were performed in triplicates and their average values are given.The sorption capacity of bentonite, i.e. the amount of the sorbate sorbed onto bentonite at equilibrium conditions, qe (mg g−1), was calculated with the following equation:
 | (1) |
Solutions of 0.1 M NaOH, 0.01 M EDTA-Na2, 0.1 M HCl, 0.1 M NaCl, 0.01 Ca(OH)2 and DI water were used for the desorption of OPP from the P-loaded CaT-B at 25 °C. The desorption process duration lasted 2 h. The desorption efficiency of OPP was calculated with the following equation:
 | (2) |
2.4 Analytical methods
OPP was determined using the ascorbic acid method22 on a Dr Lange, Cadas 50 spectrophotometer. To evaluate the degree of Ca–P precipitation from the liquid phase, the qe was determined following two methods: in first method (M1) the samples were left to settle for some seconds (2–3) to allow bentonite to settle and then the OPP were measured taken an aliquot from the solution. During such short time, nucleation and precipitation of Ca–P is precluded; therefore – upon their formation – the possible stable Ca–P nuclei are still suspended in the solution. In the second method (M2) the OPP was measured in the supernatant after settling for over 30 min or centrifugation (5000 rpm for 5 min). Based on the uncertainties, the difference between the OPP measurements of M1 and M2 was ascribed to the OPP removal due to incorporation or deposition of P onto CaT-B.Point of zero charge (PZC) was measured adding 10 g L−1 untreated bentonite and CaT-B in 0.1 M NaCl at initial pH values of 4, 6, 8 and 10. The samples were placed on an orbital shaker for 24 h. The day after the solutions pH change was recorded. As ΔpH the difference of initial and final pH is defined. The ΔpH is plotted against initial pH, and the PZC is the point in which ΔpH = 0.23 The above processes are examined applying different instrumental methods that provide information on texture, modal mineralogy and phase formation on the starting and treated material.
2.5. Isotherm models
The experimental equilibrium data were fitted to the following isotherm models:(1) the Langmuir isotherm expressed by the following linear form:
 | (3) |
 | (4) |
(2) the Freundlich isotherm expressed by the following linear form:
 | (5) |
The fit quality of the isotherm models applied to the experimental data was determined by the determination coefficient (R2) (through linear regression) and chi-square statistic. The latter function measures the difference between experimental and model predicted data, and can be expressed by the following equation:
 | (6) |
3. Results and discussion
3.1 Characterization of materials
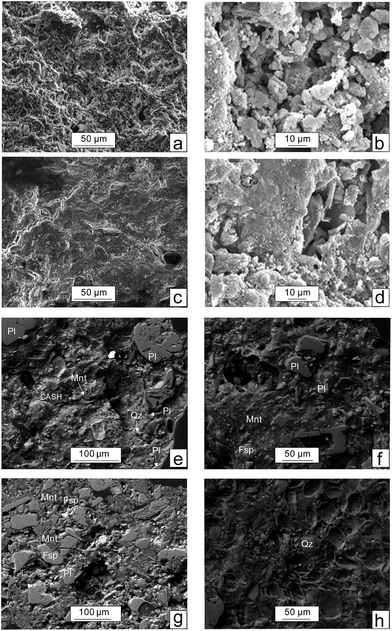
Under the SEM, the CaT-B exhibits a complicated texture which in places is flat with parallel flakes (Fig. 1c) whereas in other sites preserves the rough surface inherited from the starting untreated material. The reaction of Ca(OH)2 with the matrix aluminosilicate minerals (e.g. montmorillonite), forms a thin well compacted layer (Fig. 1d). Considering the SEM-EDS quantitative analyses (not given), this layer primarily composed by small (<10 μm in diameter) isometric calcium–(aluminium)–silicate-hydrated [C(A)SH] crystals (nodules) with a composition close to tobermorite (Fig. 1d).
The P-loaded CaT-B material is extensively studied by SEM in order to evaluate the role of phosphorus. We have verified the presence of phosphorus in the aluminosilicate minerals. In particular, P2O5 is variable, in the range of 0.6–11.0 wt% (values given in dry basis), except for one spot which has a high concentration of 30.5 wt% (possible corresponds to a mixed analysis of SiO2 and late-crystallized apatite from the Ca–P-saturated solution). The montmorillonite structure is overwhelmed by tetrahedral (mostly Si4+) and octahedral (mostly Al3+, Fe3+ and Mg2+) crystal sites. Therefore, the pentavalent phosphorus (P5+) cation may substitute the Si4+ into the tetrahedral site, however, creating a positive charge within the montmorillonite crystal lattice; then a coupled substitution mechanism is required that could balance the extra charge. Important role will play the correlation of the P2O5 concentration with the trivalent (Al, Fe) and divalent (Mg, Fe, Ca) cations. Our SEM-EDS analyses suggest a negative correlation of P2O5 with SiO2 and Al2O3, and a positive with CaO (inter-layer cation) and FeOtotal (octahedral cation). The former anti-correlation, which is more prominent, suggests a predominant substitution of P5+ for Si4+ balanced either by tetrahedral vacancies 5IVSi4+ = 4IVP5+ + IV[ ] ([ ] corresponds to vacancies) or by octahedral vacancies as the following: 2IVSi4+ + 4VID2+ = 2IVP5+ + 3VIM2+ + VI[ ]/M (D and M corresponds to divalent and monovalent inter-layer cations, respectively); furthermore, the negative correlation of P2O5 with Al2O3 probably indicates that the Al3+ cations are exposed on the edge face of the crystal.24 Thereafter, detailed SEM and electron microprobe analyses are required that should be reflected on the mineral composition and the element's inter-relation, in order to infer robust constraints on the substitution mechanisms involved not only within montmorillonite but also in the rest of the silicates (e.g. CASH, plagioclase). Despite the analytical uncertainties, we feel confident, that our SEM data, indicate that one possible sorption mechanism for phosphorus – even not the predominant – is related with minor sorption in the tetrahedral site.
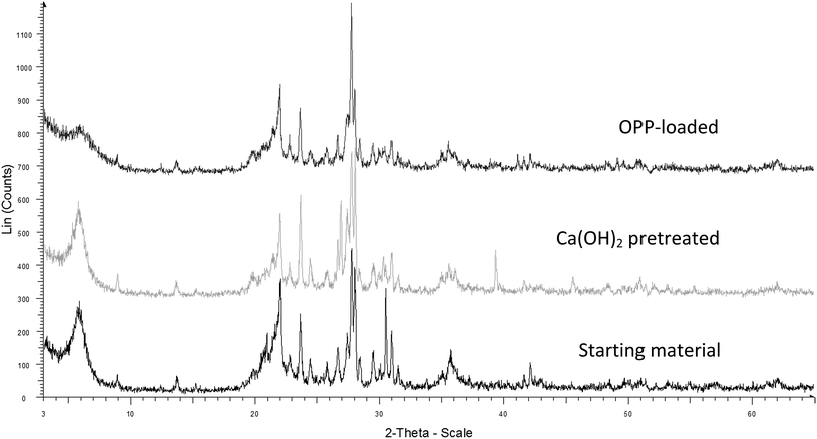 | ||
| Fig. 2 X-ray diffraction results obtained for starting material (bentonite), Ca(OH)2 pretreated bentonite, and OPP-loaded bentonite. | ||
In the OPP-loaded CaT-B montmorillonite, illite, quartz, plagioclase and dolomite can easily be detected; we noticed a major difference from the respective XRD pattern of CaT-B associated with the absence of the peaks that were assigned to the tobermorite-like phase. As long as the CASH phase identified under SEM (Fig. 1e), it suggests that the modal content has been decreased to a value lower than the detection limit of XRD.
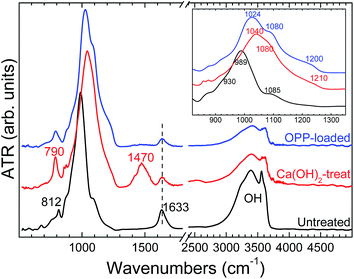
The IR spectrum of the Ca(OH)2-treated sample exhibits significant differences compared to the starting phase. In particular, the main feature in the 900–1300 cm−1 Si–O stretching region is now a broad band located at 1040 cm−1, accompanied by a prominent sideband at 1080 cm−1 and a low-intensity feature at 1210 cm−1 (inset in Fig. 3). In addition, a well-resolved mode at 790 cm−1 and a new peak at ∼1470 cm−1 (CO32− stretching) can be observed in the CaT-B. In accordance with our XRD data, the IR spectrum of the Ca(OH)2-treated material tentatively resembles that of a tobermorite-like phase.31,32 As for the presence of the carbonate species, this is probably due to the incorporation of atmospheric CO2 in the Ca(OH)2-treated material upon air exposure.31
The IR response of the OPP-loaded sample is very similar to the CaT-B one. The IR spectrum it is characterized by slight shift of the prominent band from 1040 cm−1 (CaT-B) at 1024 cm−1 (OPP-loaded) and its low-intensity shoulder from 1210 cm−1 (CaT-B) to 1200 cm−1 (OPP-loaded), disappearance of the carbonate-related band at ∼1470 cm−1 and the intensity reduction of the H2O-related bands at ∼1630 and 3000–3750 cm−1. These frequency changes can most likely be attributed to the sorption of phosphorus within the Ca(OH)2-treated sample, since P–O stretching modes in orthophosphate units are expected near these frequencies.33,34
3.2 Sorption kinetics
The kinetics experiments were conducted with solution of 100 mg P per L and CaT-B dosage of 10 g L−1. In addition, the change of solution pH against time was recorded up to 48 h at the same time intervals during the kinetic study, in order to determine a possible relation between OH− release from CaT-B and sorbed OPP (Cs = C0 − Ce). As shown in Fig. 4, the sorption kinetics of OPP onto CaT-B is a relative slow process, reaching equilibrium after 96 h. However, the half of qe (8.79 mg P per g) was achieved in the first 4 h (4.43 mg P per g). Considering that solution pH increases over time (up to 24 h; Fig. 4b), the sorption kinetics could be associated with a relative fast ligand exchange sorption mechanism while the overall slow sorption rate could be attributed to the porous surface and to a slower diffusion and/or surface precipitation process.35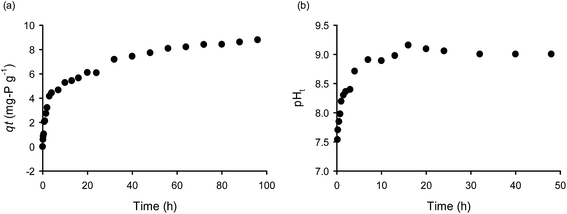 | ||
| Fig. 4 Kinetics of (a) phosphate sorption onto CaT-B and (b) solution pH (T = 25 °C, C0 = 100 mg P per L, Cs = 10 g L−1, pH = 7). | ||
3.3 Effect of pH and investigations for the solid and liquid phase Ca–P precipitation
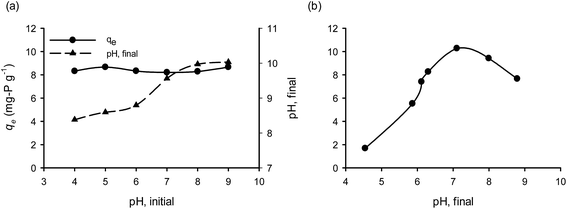
Natural materials like bentonite carry two types of electrical charge; one permanent negative charge generated from its structural components and a second variable surface charge which depends on the pH of the liquid phase.36 There is a pH value, which is called point of zero charge (PZC), at which surface carries no electrical charge. The PZC determines the electrical charge density of a surface at a given solution pH by varying the degree of the protonation/deprotonation of the surface components. PZC could change when the surface functional groups are altered due to their modification. The surface charge is effected by the solution pH; at pH < pHPZC the surface is positively charged, while at pH > pHPZC is negatively charged.37 In the present study, the Ca(OH)2 pretreatment of bentonite resulted to an increase of PZC from 8.97 to 10.54; that means for a wide range of pH values, the CaT-B remains positively charged, favoring the electrostatic attraction to H2PO4− (pKa = 2.1) and to HPO42− (pKa = 7.2) species. As we have already shown, the initial PZC of the raw bentonite was accompanied with a low affinity for OPP (0.3 mg g−1) in contradiction to the expected; the latter is attributed to the electrostatic attraction mechanism (solution pH < pHPZC during the initial sorption phase). Hence, the chemical modification of bentonite with Ca(OH)2 and the enhanced chemical or/and physical sorption mechanisms should play a greater role on P removal by CaT-B.Since pH is a major parameter affecting the sorption process, various experimental trials were performed in a wide range of OPP solution pH (4–9) values. The initial pH values of the solution had a slight effect on phosphate sorption (Fig. 5a). At all pH values investigated the final pH increased, reaching values of 8 up to 10 due to release of anions (OH− and/or CO32−) in exchange with OPP (ligand exchange) or due to protonation of the surface components. The contribution of carbonates to phosphate sorption and their interaction in natural ecosystems are mentioned in the literature.12 These results show that OPP sorption by CaT-B could be occur in a wide range of pH, a fact that renders the suggested method advantageous because the OPP solution to be treated probably requires no pH adjustment, which means that no additional chemicals (acids or alkalis) are needed. The increase of pH, should favor Ca–P complexation. However, in order to investigate values of pH < 8, the experimental trials were taken after 72 h sorption and their pH values were re-adjusted and let for additional 72 h to allow equilibrium to be re-reached.
When the final pH was re-adjusted, its effect on qe was significant (Fig. 5b), indicating the importance of the final and not the initial pH. When pH was re-adjusted, the values of qe show a positive correlation with final pH (for a value up to 7), whereas qe is negatively correlated for final pH > 7. This former should be associated with the fact that increasing pH promotes the Ca–P complexes, and the latter with the competitiveness of OH− and OPP anions. However, it may be possible the association of sorbed OPP to the outer-sphere complexation (ion-exchange with electrostatic traction); in that case, as the pH approaches the PZC value, the OPP sorption decreases due to weaker positive electric charges.
As was mentioned before, OPP could be removed by: (i) surface complexation (inner- and outer-sphere), (ii) surface precipitation and (iii) liquid phase precipitation. The surface precipitation occurs even when Ca and OPP solution concentrations are lower than expected to form precipitates.5 However, for the formation of surface precipitation, dissolved Ca2+ ions are required. A close inspection of the Ca2+ concentration with time (Fig. 6), indicates that Ca2+ released from CaT-B into the solution during the first 15 min. We observed a rapid decrease of Ca2+ after ∼20 h due to incorporation of Ca2+ in solid phase (precipitation at the surface). The amount of Ca2+ and the ratio of Ca–P were much lower than the required for liquid precipitation, strengthening the concept for surface precipitation. Additionally, on a qe vs. pH diagram, the curves corresponding to the different qe evaluation method (M1 and M2; see Section 2.4 Analytical methods) were similar, indicating the absence of Ca–P complexation/precipitation in the solution (Fig. 7a). In contrast, when 0.01 M CaCl2 was added to the solution (Fig. 7b), the two curves overlapped each other at low pH (4–6); at higher pH the gap between the two curves becomes significant; therefore, at alkaline conditions (pH > 7) and high Ca–P ratios (≫2![[thin space (1/6-em)]](https://www.rsc.org/images/entities/char_2009.gif) :
:![[thin space (1/6-em)]](https://www.rsc.org/images/entities/char_2009.gif) 1) OPP removal through complexation with Ca2+ and precipitation in the liquid phase (CPLP) is favored.38 Our results suggest that when CPLP is favored, then a high portion of liquid phase precipitation remains as precipitate in the solution. In contrast, when the conditions are against CPLP then the precipitation and deposition occurs at the surface of the sorbent.
1) OPP removal through complexation with Ca2+ and precipitation in the liquid phase (CPLP) is favored.38 Our results suggest that when CPLP is favored, then a high portion of liquid phase precipitation remains as precipitate in the solution. In contrast, when the conditions are against CPLP then the precipitation and deposition occurs at the surface of the sorbent.
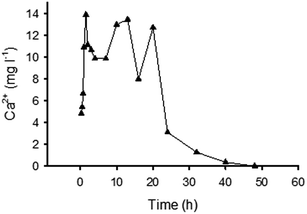 | ||
| Fig. 6 Kinetics of Ca2+ concentration released from CaT-B into the solution (T = 25 °C, C0 = 100 mg P per L, Cs = 10 g L−1). | ||
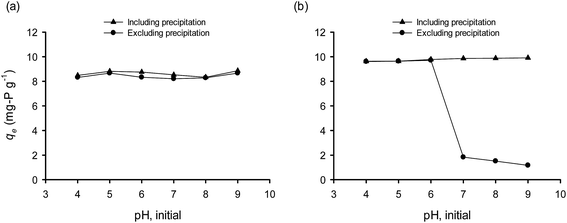 | ||
| Fig. 7 Effect of initial pH on the solid phase and liquid phase Ca–P precipitation (a) without and (b) with the presence of dissolved Ca (0.01 M CaCl2; T = 25 °C, C0 = 100 mg P per L, Cs = 10 g L−1). | ||
3.4 Effect of dosage of Ca(OH)2 pretreated natural bentonite on OPP sorption
In Fig. 8, the effect of CaT-B dosage on qe is illustrated. The qe shows a negative correlation with the sorbent dosage for the range of 5 to 15 g L−1; at higher dosages, qe was relatively constant. In a sorption process the equilibrium isotherms are typical monotonically increasing functions, i.e. the higher the liquid phase equilibrium concentration the higher the solid phase equilibrium concentration is. Hence the observation that qe decreased with the increase of the dosage was expected since the higher the mass of the sorbent, the higher the removal of sorbate and thus the lower the liquid equilibrium concentration.39–41 Therefore, the constant qe values for increased CaT-B dosages (from 15 to 25 g L−1), indicates that the liquid/solid relationship has been influenced by a combination of factors like pure sorption, internal complexation and precipitation.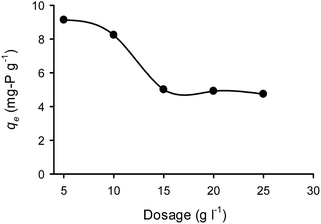 | ||
| Fig. 8 Effect of CaT-B dosage on the orthophosphate sorption capacity (T = 25 °C, C0 = 100 mg P per L, pH = 7). | ||
3.5 Sorption isotherms
Fig. 9 shows the sorption capacity and OPP concentrations at equilibrium at different temperatures. The values of qe at low initial OPP concentrations (25 and 50 mg P per L) did not significantly differ in relation to temperature, probably because the OPP removal was high (>90%), hindering the differentiation between the trials. Table 1 lists the calculated parameters of the two applied isotherm models. As can be seen, the Langmuir isotherm exhibited the best fit with the experimental equilibrium data at all studied temperatures due to its higher R2 (≥0.96) and lower χ2 values (≤1.18) compared to the Freundlich one. Ma et al.42 reported also that Langmuir describes better the experimental data of OPP sorption onto bentonite pretreated with CaO. The best applicability of the Langmuir model suggests a monolayer sorption onto limited binding sites.43 A favorable sorption system was suggested at all studied temperatures by the values of the dimensionless separation factor RL derived from the Langmuir model (being 0 < RL < 1) and also by the values of the Freundlich parameter n being >2. Previous studies reported the good fit of Langmuir model for phosphate sorption onto modified Ca(OH)2-bentonite,42 modified Ca-rich montmorillonite,44 and other modified montmorillonites.45,46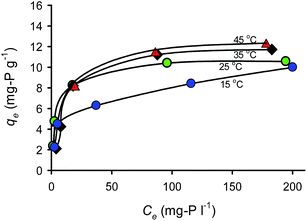 | ||
| Fig. 9 Adsorption capacity and P concentrations at equilibrium and at different temperatures (T = 25 °C, Cs = 10 g L−1, pH = 7, contact time = 72 h). | ||
| Isotherm models | Sorption temperature (°C) | ||||
|---|---|---|---|---|---|
| 15 | 25 | 35 | 45 | ||
| Langmuir | qmax (mg g−1) | 9.35 | 11.68 | 16.89 | 13.02 |
| b (L mg−1) | 0.1327 | 0.1912 | 0.0389 | 0.1021 | |
| RL (range) | 0.025–0.232 | 0.017–0.173 | 0.079–0.507 | 0.032–0.281 | |
| R2 | 0.96 | 0.96 | 0.98 | 0.99 | |
| χ2 | 0.56 | 0.39 | 1.18 | 0.09 | |
| Freundlich | KF ((mg g−1)(L mg−1)1/n) | 2.138 | 2.936 | 1.671 | 2.234 |
| n | 3.390 | 3.650 | 2.411 | 2.788 | |
| R2 | 0.91 | 0.85 | 0.85 | 0.92 | |
| χ2 | 0.45 | 1.27 | 2.10 | 0.98 | |
3.6 Sorption thermodynamics
Equilibrium experiments were conducted at various temperatures in order to calculate the thermodynamic parameters of Gibbs free energy change (ΔG°), enthalpy change (ΔH°) and entropy change (ΔS°), using the following equations:
ΔG° = −RT![[thin space (1/6-em)]](https://www.rsc.org/images/entities/char_2009.gif) ln ln![[thin space (1/6-em)]](https://www.rsc.org/images/entities/char_2009.gif) Kc = −RT Kc = −RT![[thin space (1/6-em)]](https://www.rsc.org/images/entities/char_2009.gif) ln(Csorbed,e/Ce) ln(Csorbed,e/Ce)
| (7) |
 | (8) |
![[thin space (1/6-em)]](https://www.rsc.org/images/entities/char_2009.gif) Kc versus 1/T (eqn (8)).
Kc versus 1/T (eqn (8)).
As shown in Table 2, the values of ΔG° were negative at all studied temperatures indicating a spontaneous and favorable sorption process. In addition, the degree of sorption reaction spontaneity increased with increasing temperature.47 The positive ΔH° suggested the endothermic nature of the OPP sorption onto CaT-B, while the positive ΔS° suggested the increased disorder at the liquid–solid interface during the move of OPP anions from the solution to the sorbent surface. The observed release of OH− from the sorbent to the solution due to anion exchange reaction can be attributed to enthalpy (S°) increase.42 A similar result in terms of positive ΔH° and ΔS° was observed for OPP sorption by the Ca(OH)2-bentonite42 and Zr/Al-pillared montmorillonite.45
| C0 (mg P per L) | R2 | ΔH° (kJ mol−1) | ΔS° (kJ mol−1 K−1) | ΔG° (kJ mol−1) | |||
|---|---|---|---|---|---|---|---|
| 15 °C | 25 °C | 35 °C | 45 °C | ||||
| 200 | 0.868 | 15.09 | 0.108 | −15.77 | −17.31 | −18.32 | −19.00 |
| 300 | 0.974 | 8.47 | 0.081 | −14.88 | −15.60 | −16.55 | −17.26 |
3.7 Desorption of OPP
Six different eluents were used for OPP desorption from P-loaded CaT-B. As shown in Fig. 10, the OPP desorption was ∼98% in eluents with 0.1 M HCl, and ∼83% with Na2-EDTA. The other four eluents [DI water, NaOH, NaCl, Ca(OH)2], shows a much lower capability for OPP desorption in the range of 0.5–5.5%. These results suggest that the OPP was bounded to calcium in the sorbent surface because that HCl-extractable OPP is associated with Ca2+ (ref. 48) and EDTA-Na2 is a chelating agent for many metals, including Ca2+.49 The lower desorption using NaCl, DI water, NaOH and Ca(OH)2 solutions, suggests a significant contribution of inner-sphere surface complexation; desorption of NaCl solution suggests insignificant contribution of ion-exchange mechanism between OPP anions and Cl−; similarly, desorption with NaOH and Ca(OH)2 solution indicates almost the absence of a hydrogen bonding mechanism due to the inability of OPP to connect with oxides or/and hydroxides of the surface.5,50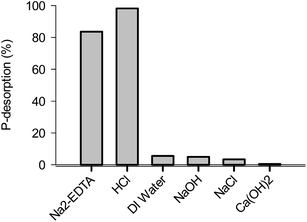 | ||
| Fig. 10 Desorption of orthophosphate using various eluents for 2 h (0.01 M Na2-EDTA, 0.1 M HCl, 0.1 M NaOH, 0.1 M NaCl and 0.01 M Ca(OH)2). | ||
In the point of view of the recovery of OPP, the form of OPP removed which displays a particular interest is the bounded solid phase sorption, which is more advantageous than liquid phase precipitation.3 Desorption is a significant issue, because it determines the degree of sorbate recovery. In a previous study,19 OPP-loaded particle of zeolite was used for the cultivation of the cyanobacterium Arthrospira (Spirulina) platensis and the microalga Chlorella vulgaris. It was observed that when the particles were directly used in the liquid cultivation media, only a low portion of OPP was biologically desorbed and taken up by the cells. This finding suggests that the only satisfactory desorption and recovery of OPP is made through chemical desorption, which though should be optimized in order the recovered OPP to be used without being detrimental to cells. Moreover, further research is needed to investigate the potential of applying OPP-loaded CaT-B in soils for biomass production.
3.8 OPP sorption mechanism(s)
The proposed model of OPP sorption onto bentonite pretreated with Ca(OH)2 is shown in the graphical presentation on Fig. 11. In the present study OPP was observed to be mainly sorbed in CaT-B through a surface complexation mechanism (ligand exchange). The ligand exchange, by definition, refers to a covalent chemical bond between OPP and a cation, which in turn leads to release of other ions that were chemically bonded to the cation.5 In the case of CaT-B, Ca2+ was responsible for OPP uptake, because the former incorporated to the material surface during the pretreatment. Based on our SEM, XRD and IR-ATR data, Ca2+ was bonded both in the hydrated ([C(S)SH] and montmorillonite) and carbonated (like calcite) phases with the anions OH− and/or CO32−. As revealed by the analyses employed, the significant decrease of the presence of these ions in the surface after OPP sorption and the degree of OPP desorption using different eluents show that OPP is sorbed onto CaT-B mainly through ligand exchange. Further, two other mechanisms, less important compared to the predominant ligand exchange – seem to operate in our OPP sorption experiments. First, the surface precipitation mechanism, which normally associated with the solid-phase crystallization in the liquid phase, and the subsequent precipitation into the pores of the sorbent.5 This mechanism occurred only when the concentration of the dissolved Ca2+ was low enough – at sub-saturation level – to prevent Ca–P crystallization and precipitation in the liquid phase (solution). Finally, the third mechanism is consistent with the SEM data, which seems to be associated with the replacement of P5+ for Si4+ and hence the sorption of P in the tetrahedral site of the material, compensated by some mix of trivalent ions and vacancies on tetrahedral sites or by coupled substitutions on octahedral sites. The latter, requires additional electron microprobe analyses in order to infer robust constraints on the extent of the substitution mechanism involved not only within montmorillonite but also in the rest of the silicates.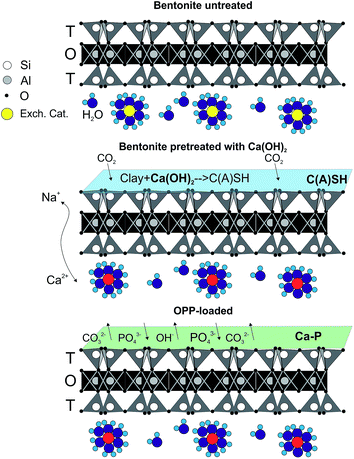 | ||
| Fig. 11 Graphical presentation of the proposed model of OPP sorption onto bentonite pretreated with Ca(OH)2. | ||
4. Conclusions
The chemical pretreatment of bentonite with Ca(OH)2 resulted to a significant increase of the OPP sorption capacity of bentonite from about 0.3 mg P per g to 8 mg P per g. The main sorption mechanism for OPP uptake corresponds to the inner-sphere surface complexation (ligand exchange) as indicated by the Ca2+ bond with OH− and/or CO32− anions which were exchanged by OPP. The variation of initial pH in the range of 4–9 did not affect qe, mainly because due to ligand exchange the final pH of the solution was equal or higher than 8. However, the re-adjustment of the final pH have shown that the final pH had a significant effect on qe. The highest qe was observed at final pH 7. CaT-B dosage effected qe only in the range of 5–15 g L−1, whereas at higher values (15–25 g L−1) the qe was unaffected. In overall, the sorption kinetic had a low rate reaching equilibrium after 96 h, with half qe reached in the first 4 h. The calculated qmax from Langmuir model was 11.68 mg P per g. Thermodynamic analysis indicates that the sorption process is spontaneous and favorable.The potential advantages of the present suggested method for OPP removal could be summarized as: (i) the pretreatment agent Ca(OH)2 is inexpensive and eco-friendly, (ii) minerals such as bentonite are equate and inexpensive, (iii) OPP removal occur in a wide range of pH (4–9) and there is no need for pH adjustment of the OPP solution, (iv) OPP could be recovered from the OPP-loaded CaT-B by desorption, while (iv) the OPP-loaded CaT-B could be applied directly to soil as a fertilizing agent and soil improver.
Acknowledgements
E. I. Kamitsos, director at the Theoretical and Physical Chemistry Institute, National Hellenic Research Foundation is gratefully acknowledged for his permission to use the IR-ATR and Raman laboratories. We want to express our sincere thanks to G. Economou, director at the Institute of Geology and Mineral Exploration, for his assistance during the SEM-EDS analyses. A. Argyraki from the Department of Geology and Geoenvironment at the National and Kapodistrian University of Athens, is also acknowledged for performing the XRD analyses at her lab.References
- J. Sims, R. Simard and B. Joern, J. Environ. Qual., 1998, 27, 277–293 CrossRef CAS.
- L. E. De-Bashan and Y. Bashan, Water Res., 2004, 38, 4222–4246 CrossRef CAS PubMed.
- K. Karageorgiou, M. Paschalis and G. N. Anastassakis, J. Hazard. Mater., 2007, 139, 447–452 CrossRef CAS PubMed.
- C. Vohla, M. Kõiv, H. J. Bavor, F. Chazarenc and Ü. Mander, Ecol. Eng., 2011, 37, 70–89 CrossRef.
- P. Loganathan, S. Vigneswaran, J. Kandasamy and N. S. Bolan, Crit. Rev. Environ. Sci. Technol., 2014, 44, 847–907 CrossRef CAS.
- S. S. Gupta and K. G. Bhattacharyya, RSC Adv., 2014, 4, 28537–28586 RSC.
- K. Mukherjee, A. Kedia, K. J. Rao, S. Dhir and S. Paria, RSC Adv., 2015, 5, 30654–30659 RSC.
- J. P. Soetardji, J. C. Claudia, Y.-H. Ju, J. A. Hriljac, T.-Y. Chen, F. E. Soetaredjo, S. P. Santoso, A. Kurniawan and S. Ismadji, RSC Adv., 2015, 5, 83689–83699 RSC.
- S. Wang and Y. Peng, Chem. Eng. J., 2010, 156, 11–24 CrossRef CAS.
- S. S. Gupta and K. G. Bhattacharyya, Phys. Chem. Chem. Phys., 2012, 14, 6698–6723 RSC.
- P. Stathi, K. Litina, D. Gournis, T. S. Giannopoulos and Y. Deligiannakis, J. Colloid Interface Sci., 2007, 316, 298–309 CrossRef CAS PubMed.
- M. Zamparas, A. Gianni, P. Stathi, Y. Deligiannakis and I. Zacharias, Appl. Clay Sci., 2012, 62, 101–106 CrossRef.
- A. Tilková, P. Majorová and J. Seidlerová, Advanced Science Focus, 2013, 1, 351–353 CrossRef.
- F. Haghseresht, S. Wang and D. Do, Appl. Clay Sci., 2009, 46, 369–375 CrossRef CAS.
- Y. Song, P. G. Weidler, U. Berg, R. Nüesch and D. Donnert, Chemosphere, 2006, 63, 236–243 CrossRef CAS PubMed.
- J. Van Dijk and H. Braakensiek, Water Sci. Technol., 1984, 17, 133–142 Search PubMed.
- J. B. K. Park, R. J. Craggs and A. N. Shilton, Bioresour. Technol., 2011, 102, 35–42 CrossRef CAS PubMed.
- A. Argiri, Z. Ioannou, P. M. Gavala and A. Dimirkou, Commun. Soil Sci. Plant Anal., 2013, 44, 551–565 CrossRef CAS.
- G. Markou, O. Depraetere, D. Vandamme and K. Muylaert, Int. J. Mol. Sci., 2015, 16, 4250–4264 CrossRef CAS PubMed.
- J. J. Elser, Curr. Opin. Biotechnol., 2012, 23, 833–838 CrossRef CAS PubMed.
- G. Markou, D. Mitrogiannis, K. Muylaert, A. Çelekli and H. Bozkurt, J. Environ. Sci., 2016 DOI:10.1016/j.jes.2015.12.009.
- APHA, Standard methods for the examination of water and wastewater, American Public Health Association, Washington DC, 1995 Search PubMed.
- M. Kosmulski, Surface charging and points of zero charge, CRC Press, 2010 Search PubMed.
- L. P. Lavikainen, J. T. Tanskanen, T. Schatz, S. Kasa and T. A. Pakkanen, Theor. Chem. Acc., 2015, 134, 1–7 CrossRef.
- M. Mantovani, A. Escudero, M. Alba and A. Becerro, Appl. Geochem., 2009, 24, 1251–1260 CrossRef CAS.
- S. Shaw, S. Clark and C. Henderson, Chem. Geol., 2000, 167, 129–140 CrossRef CAS.
- S. Boonjaeng, P. Chindaprasirt and K. Pimraksa, Appl. Clay Sci., 2014, 95, 357–364 CrossRef CAS.
- R. Fernández, L. González, A. I. Ruiz and J. Cuevas, Journal of Geochemistry, 2014, 145425 Search PubMed.
- C. M. Muller, B. Pejcic, L. Esteban, C. D. Piane, M. Raven and B. Mizaikoff, Sci. Rep., 2014, 4, 6764 CrossRef CAS PubMed.
- F. A. Yitagesu, F. van der Meer, H. van der Werff and C. Hecker, Appl. Clay Sci., 2011, 53, 581–591 CrossRef CAS.
- P. Yu, R. J. Kirkpatrick, B. Poe, P. F. McMillan and X. Cong, J. Am. Ceram. Soc., 1999, 82, 742–748 CrossRef CAS.
- A. Vidmer, G. Sclauzero and A. Pasquarello, Cem. Concr. Res., 2014, 60, 11–23 CrossRef CAS.
- J. C. Elliott, Structure and chemistry of the apatites and other calcium orthophosphates, Elsevier, The Netherlands, 1994 Search PubMed.
- C.-P. E. Varsamis, E. I. Kamitsos, T. Minami and N. Machida, J. Phys. Chem. C, 2012, 116, 11671–11681 CAS.
- V. J. Inglezakis, A. A. Zorpas, M. D. Loizidou and H. P. Grigoropoulou, Microporous Mesoporous Mater., 2003, 61, 167–171 CrossRef CAS.
- P. Stathi, I. T. Papadas, A. Enotiadis, R. Y. N. Gengler, D. Gournis, P. Rudolf and Y. Deligiannakis, Langmuir, 2009, 25, 6825–6833 CrossRef CAS PubMed.
- P. Chutia, S. Kato, T. Kojima and S. Satokawa, J. Hazard. Mater., 2009, 162, 204–211 CrossRef CAS PubMed.
- Y. Song, H. Hahn and E. Hoffmann, Chemical water and wastewater treatment VII, 2001, p. 349 Search PubMed.
- K. Xu, T. Deng, J. Liu and W. Peng, Fuel, 2010, 89, 3668–3674 CrossRef CAS.
- Y. Bulut and Z. Baysal, J. Environ. Manage., 2006, 78, 107–113 CrossRef CAS PubMed.
- R. A. K. Rao and M. A. Khan, Colloids Surf., A, 2009, 332, 121–128 CrossRef CAS.
- J. Ma, J. Qi, C. Yao, B. Cui, T. Zhang and D. Li, Chem. Eng. J., 2012, 200, 97–103 CrossRef.
- V. A. Anagnostopoulos, I. D. Manariotis, H. K. Karapanagioti and C. V. Chrysikopoulos, Chem. Eng. J., 2012, 213, 135–141 CrossRef CAS.
- I. Perassi and L. Borgnino, Geoderma, 2014, 232–234, 600–608 CrossRef CAS.
- W. Huang, J. Chen, F. He, J. Tang, D. Li, Y. Zhu and Y. Zhang, Appl. Clay Sci., 2015, 104, 252–260 CrossRef CAS.
- D. Bhardwaj, P. Sharma, M. Sharma and R. Tomar, J. Taiwan Inst. Chem. Eng., 2014, 45, 2649–2658 CrossRef CAS.
- A. Alshameri, C. Yan and X. Lei, Microporous Mesoporous Mater., 2014, 196, 145–157 CrossRef CAS.
- V. Ruban, J. López-Sánchez, P. Pardo, G. Rauret, H. Muntau and P. Quevauviller, Fresenius' J. Anal. Chem., 2001, 370, 224–228 CrossRef CAS PubMed.
- T. Alexander and J. Robertson, Soil Sci., 1972, 114, 69–72 CrossRef CAS.
- R. Bowman and C. Cole, Soil Sci., 1978, 125, 95–101 CrossRef CAS.
| This journal is © The Royal Society of Chemistry 2016 |

