SnSb/TiO2/C nanocomposite fabricated by high energy ball milling for high-performance lithium-ion batteries

Haihua Zhaoac, Wen Qi*b, Xuan Lie, Hong Zengb, Ying Wub, Jingwei Xiangd, Shengen Zhangc, Bo Lia and Yunhui Huang*d
aCentral Iron and Steel Research Institute, 76 South Xueyuanlu Rd, Haidian District, Beijing 100081, China
bBeijing Key Laboratory of Energy Nanomaterials, Advance Technology & Materials Co., Ltd, China Iron & Steel Research Institute Group, Beijing 100081, China. E-mail: qiwen@atmcn.com
cInstitute for Advanced Materials Technology, School of Materials Science and Engineering, University of Science and Technology Beijing, Beijing, 100083, China
dState Key Laboratory of Material Processing and Die & Mould Technology, School of Materials Science and Engineering, Huazhong University of Science and Technology, Wuhan, Hubei 430074, China. E-mail: huangyh@hust.edu.cn
eSchool of Materials Science and Engineering, Tianjin University, Tianjin, China

Received 21st December 2015 , Accepted 22nd March 2016

First published on 24th March 2016


Abstract

Alloy anodes for Li-ion batteries (LIBs) have attracted great interest due to their high capacity. However, their large volume change during electrochemical lithiation/delithiation causes a poor cycle life, which significantly limits their application. Here we design and fabricate a carbon-coated SnSb/TiO2 nanocomposite via an in situ mechanochemical reduction route, in which a nanostructured SnSb alloy is grown on TiO2 and coated by a layer of conductive carbon. Compared with the SnSb/TiO2 composite or C-coated SnSb alloy, such a C-coated SnSb/TiO2 nanocomposite (SnSb/TiO2/C) shows a higher reversible capacity of 630 mA h g−1 and better capacity retention (80% over 200 cycles). Our work suggests that the mechanochemical reduction by high energy ball milling can be a powerful method to fabricate alloy anodes with improved cycle stability for addressing the volume change issue.

Introduction

During the last decades, Li-ion batteries have been aggressively pursued for consumer electronics and electric vehicles due to their high energy density and long cycle life. LIBs with superior performance are always desirable with the ever-increasing demand. Currently, the commercial graphite anode exhibits a limited capacity based on Li-ion intercalation/de-intercalation mechanism, which significantly hinders the further development of LIBs. Thus, many anode materials based on the conversion reaction or alloying/de-alloying reaction have been widely investigated due to their high theoretical specific capacities.1–5 Compared with conversion type anodes, alloy type anodes possess more advantages including higher gravimetric and volumetric capacity, light weight, low toxicity and low cost, which are very promising for the next-generation LIBs.3,6,7 Despite these advantages, alloy anodes usually suffer from poor capacity retention, which is ascribed to the huge volume change during electrochemical lithiation/delithiation.

To enhance the cycle life of alloy anodes, numerous efforts have been devoted to addressing the issue of volume change evolved in the electrochemical reactions. As an effective method, reducing the particle size of anode alloys has been widely employed. However, small particles are likely to aggregate into large particles that are pulverized again upon cycling, eventually leading to rapid capacity fading.3,4,8 On the other hand, a wide variety of nanostructures, such as metal/carbon nanocomposites,9–13 hollow structures,14,15 mesoporous structures,16–18 and inactive/active composites19–23 have been developed, which provide short diffusion pathways for Li ions. Meanwhile, these nanostructures show great promise to reduce the detrimental effect of large volume change and to alleviate the side reaction with electrolyte.

Among various alloy anodes, SnSb based alloys have attracted particular attention due to their high theoretical capacities, where both Sn (Li4.4Sn, 990 mA h g−1) and Sb (Li3Sb, 660 mA h g−1) can be active materials for LIBs.8,24,25 Unfortunately, the pulverization problem due to the large volume change would also lead to a high level of irreversibility and poor cycle life for SnSb based anodes. To improve the cyclic stability, previous studies21,26–28 reported that incorporating Sb into intermetallic by a one-step ball milling can achieve a good cyclability of 330 mA h g−1 over 500 cycles. To this end, Sb2O3 and carbon, used as host matrix can reduce the aggregation of Sb during cycling and maintain the structural stability. Furthermore, carbon coating was also widely employed to overcome the volume change issues for SnSb anodes. Various coating methods, such as conformal carbon coating, tubular carbon coating, and silica shell coating, have been investigated,8,12,29 which exhibit great promise. Moreover, studies on the carbon type, carbon content and synthesis method were studied to benefit the initial capacity and cycling stability.3,30–33

In this work, we for the first time designed a carbon-coated SnSb based anodes for LIBs. To make the design promising for large scale production, we used an industry-accepted two-step ball milling method with low cost precursors, like Sn and Sb2O3. An in situ mechanochemical reduction was occurred during the ball milling that a C-coated SnSb/TiO2 nanocomposite (SnSb/TiO2/C) is fabricated. Such a SnSb/TiO2/C nanocomposite exhibits a high capacity of 630 mA h g−1 at 100 mA g−1, great rate capability of 241 mA h g−1 at 1000 mA g−1 and most importantly, excellent capacity retention of 80% over 200 cycles. The promising performance of the as-prepared SnSb/TiO2/C is attributed to its unique structure, which could effectively address the drastic volume variation and agglomeration of SnSb alloys during electrochemical cycling.

Experimental

Synthesis

The raw materials Sn (Alfa Aesar, 325 mesh, 99%), Sb2O3 (Alfa Aesar, 200 mesh, 99%) and Ti (Alfa Aesar, 325 mesh, 99%) were mixed together with a molar ratio of 4[thin space (1/6-em)]:[thin space (1/6-em)]2[thin space (1/6-em)]:[thin space (1/6-em)]3. An industry-accepted ball milling approach with a ball to powder ratio of 20[thin space (1/6-em)]:[thin space (1/6-em)]1 was used to ball mill the raw materials at a speed of 400 rpm under Ar for 40 h. The as-prepared SnSb/TiO2 was further ball milled with graphite in a weight ratio of 1[thin space (1/6-em)]:[thin space (1/6-em)]1 at a speed of 200 rpm for 6 h to give the SnSb/TiO2/C nanocomposite. In a control experiment, a SnSb/C hybrid was made using Sn, Sb and graphite by high energy ball milling at a speed of 400 rpm for 40 h.

Characterizations

The morphology and microstructure of the as-prepared samples were characterized using a field-emission scanning electron microscope (SEM). High resolution transmission electron microscopy (HRTEM), selected-area electron diffraction (SAED) and energy-dispersive X-ray spectrometry (EDS) mapping were carried out on Tecnai G2 F20 operating at 200 kV. The phase purity and crystal structure of the samples were examined by X-ray diffraction (XRD, Bruker D8) with Cu Kα radiation at 40 kV and 40 mA. Raman spectra were collected by HORIBA JOBIN YVONS.A.S. system (model Lab RAM HR800) at 532 nm. X-ray photoelectron spectrometer (XPS) data were collected with an ESCALab220i-XL electron spectrometer from VG Scientific using 300 W Al K radiations. The binding energies obtained in the XPS analysis were corrected with reference to C 1s (284.8 eV).

Electrochemical measurements

The working electrodes were prepared by casting a slurry composed of 70 wt% active material, 20 wt% polyvinylidene fluoride (PVDF) binder and 10 wt% carbon black on copper foil. The mass loading of active material was 1.5–1.8 mg cm−2. Electrochemical performance was tested using 2025-type coin cells using Li metal foil as counter electrode, 1.0 M LiPF6 in a mixture of ethylene carbonate (EC), diethyl carbonate (DEC) and fluoroethylene carbonate (FEC) (1[thin space (1/6-em)]:[thin space (1/6-em)]1[thin space (1/6-em)]:[thin space (1/6-em)]1 by volume) electrolyte and Celgard 2400 separator. Galvanostatic charge/discharge tests were carried out on a LAND battery tester (Land BT2001A, Wuhan, China) between 0.01 V and 3.0 V versus Li/Li+. Cyclic voltammetry (CV) was performed at a scan rate of 0.01 mV s−1 within the range of 0.01–3.0 V on an electrochemical workstation (VMP3, Bio-Logic SA, France). Electrochemical impedance spectroscopy (EIS) was performed by applying a sine wave with amplitude of 5 mV in the frequency range from 1000 kHz to 1 Hz.

Results and discussion

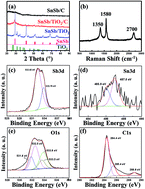
The crystalline phase, crystallinity, and particle size of the as-prepared SnSb/TiO2, SnSb/TiO2/C, and SnSb/C samples were first examined by XRD. As shown in Fig. 1a, XRD patterns of SnSb/TiO2 correspond to SnSb (JCDPS no. 33-0118) and TiO2 (JCDPS no. 48-1278), respectively, which suggested the SnSb alloy was successfully synthesized via high energy ball milling induced mechanochemical reduction. In addition, the diffraction peaks of SnSb/TiO2 are intense and sharp, indicating the good crystallinity of SnSb alloy and TiO2. After carbon coating by another ball milling process with graphite, the diffraction peaks of SnSb/TiO2/C become much boarder, which reveals the decrease of crystallinity and particle size. Moreover, TiO2 cannot be observed in the XRD result of SnSb/TiO2/C, indicative of an amorphous structure of TiO2 after carbon coating. Interestingly, XRD pattern of SnSb/C sample obtained by ball milling Sn, Sb and graphite also indicates an amorphous structure, which demonstrates that high energy ball milling can effectively mix the precursor together. Raman spectra (Fig. 1b) are then collected to investigate the structure of carbon in the SnSb/TiO2/C nanocomposites, where D (1350 cm−1), G (1580 cm−1) bands and 2D (2700 cm−1) bands are clearly observed. Compared to graphite (Fig. S1), carbon in the SnSb/TiO2/C nanocomposites is typically amorphous, indicating that high energy ball milling leads to the formation of disordered carbon.
image file: c5ra27326a-f1.tif
Fig. 1 (a) XRD patterns of SnSb/TiO2, SnSb/TiO2/C, SnSb/C nanocomposites obtained by high energy ball milling synthesis; (b) Raman patterns of SnSb/TiO2/C nanocomposite; high resolution XPS spectra of the SnSb/TiO2/C nanocomposite: (c) Sb 3d peak, (d) Sn 3d peak, (e) O 1s peak and (f) C 1s peak.

To further investigate the structure of SnSb/TiO2/C nanocomposites, XPS measurements were carried out. Fig. 1c shows the high-resolution XPS spectrum of Sb, where XPS peaks at binding energies of 532.4 and 533.8 eV are observed. This result agrees well with pure Sb (532.6 eV) rather than Sb2O3 (529.6 eV), confirming the successful reduction of Sb2O3 and formation of SnSb alloy by high energy ball milling. The XPS signals at 485.9 and 487.0 eV in Fig. 1d can be indexed to Sn metal and Sn–O. Additionally, the high resolution C 1s spectra (Fig. 1e) can fit into three peaks at 284.4, 285.4 and 288.9 eV, respectively, which correspond to C–C, C–O and C[double bond, length as m-dash]O, and reveals that the C–C bonds of graphite was partially transformed from sp3 to sp2 after ball milling.31,32 This is well in accordance with the Raman results. The O 1s peaks can be deconvoluted into four peaks at 531.8, 532.5, 533.5 and 533.8 eV, which relate to hydroxide species, oxygen metal bonding and oxygen absorbed on the surface of material.33

The morphology of SnSb/TiO2/C nanocomposite was then investigated by SEM and TEM (Fig. 2). The SEM image in Fig. 2a show an average particle size of 300 nm and a homogeneous distribution of SnSb, TiO2 and C in the SnSb/TiO2/C nanocomposite. Fig. 2b shows TEM image of SnSb/TiO2/C along with selected area electron diffraction (SAED). It is clearly that SnSb alloy and TiO2 are coated by a thin carbon layer, indicated by the white line in Fig. 2b. Moreover, the high-resolution TEM (HRTEM) image (Fig. 2c) gives the lattice fringes of SnSb nanoparticles with a basal distance of 0.307 nm, which is consistent with the (101) lattice spacing of rhombohedral SnSb phase and the above XRD result. To further confirm the uniform distribution of SnSb alloy and TiO2 with a carbon layer coating, the element mappings were collected (Fig. 2e–i). Obviously, Ti signal is overlapped with O signal, while Sn is overlapped with Sb, confirming the formation of SnSb alloy and TiO2 nanocomposite.


image file: c5ra27326a-f2.tif
Fig. 2 Morphology characterizations of SnSb/TiO2/C nanocomposite: (a) SEM image, (b and d) TEM image, (c) HRTEM image and (e–i) corresponding elemental mapping images. The inset of (b) is the SAED pattern of SnSb/TiO2/C.

Based on the above characterizations, a plausible reaction process for the formation of the SnSb/TiO2/C nanocomposite is outlined in Fig. 3. During the first-step ball milling, Sb2O3 is reduced in the presence of Ti and Sn, forming SnSb alloy and TiO2 composite according the following equation.

 
4Sn + 2Sb2O3 + 3Ti → 4SnSb + 3TiO2 (1)


image file: c5ra27326a-f3.tif
Fig. 3 Schematic illustration of the formation process of SnSb/TiO2/C nanocomposite by a two-step ball milling.

In the second ball milling process, graphite was used carbon resource, which not only resulted in a carbon layer onto the SnSb/TiO2 composite, but also decreased the crystalline degree and particular size of SnSb/TiO2 composite. Such a phenomenon typically occurs in high energy ball milling.

We then measured the Li-ion storage properties of the as-prepared SnSb/TiO2/C nanocomposite, where galvanostatic discharge–charge measurements were first conducted. Fig. 4a displays the voltage profiles of SnSb/TiO2/C nanocomposite tested at 100 mA g−1 in the potential window of 0.01–3 V vs. Li/Li+, which delivers initial discharge and charge capacities of 813 and 598 mA h g−1, respectively, implying a columbic efficiency of 73.6%. The irreversible capacity loss is associated with the formation of solid electrolyte interfacial (SEI) in the first lithiation process. A high reversible capacity of 630 mA h g−1 is reached over 200 cycles, suggesting a high capacity and super cycling stability. To further investigate the electrochemical reaction between SnSb/TiO2/C nanocomposite and Li, CV curves were collected in the voltage window of 0.01–3 V vs. Li/Li+. As shown in Fig. 4b, the first peak is observed near 1.0 V in the first discharge curve, which can be ascribed to the formation of SEI. Then, the later peaks in the first discharge curve below 0.8 V can be attributed to the lithiation and alloying reaction between SnSb and Li (by comparing the CV of SnSb/C in Fig. S3). Correspondingly, the major delithiation and dealloying reactions occur between 0.1 V and 1.2 V in the first charge process. Moreover, the CV curves of the followed cycles are almost overlapped, indicating an excellent cyclic stability of SnSb/TiO2/C nanocomposite. It is noted that the strong cathodic/anodic peaks at ∼0/∼0.2 V caused by carbon appear in SnSb/TiO2/C, which are not found in SnSb/TiO2 (Fig. S4). This indicates the effective carbon wrapping in SnSb/TiO2/C and hence the better conductivity.


image file: c5ra27326a-f4.tif
Fig. 4 (a) Voltage profiles of SnSb/TiO2/C nanocomposite tested at 100 mA g−1 in the potential window of 0.01–3 V vs. Li/Li+; (b) CV curves of SnSb/TiO2/C nanocomposite tested at 0.01 mV s−1 in the potential window of 0.01–3 V vs. Li/Li+. (c and d) Rate and cycling performance of SnSb/TiO2/C, SnSb/TiO2 and SnSb/C.

To study the Li-ion storage properties of SnSb/TiO2/C nanocomposites, rate capability and cycling performance were also evaluated. For comparison, the electrochemical performance of SnSb/TiO2 and SnSb/C were also provided. As shown in Fig. 4c, SnSb/TiO2/C can deliver reversible capacities of 641, 551, 417, 313, and 241 mA h g−1 at current densities of 0.1, 0.2, 0.5, 1, 2 A g−1, respectively. These values are clearly higher than those of SnSb/TiO2 and SnSb/C at relevant current densities. The SnSb/TiO2/C nanocomposite retains a capacity of 317 mA h g−1 at a current of 2 A g−1, indicating a good rate capability. Such an enhancement can be ascribed to the improved conductivity by carbon layer and fine particle size. On the other hand, the capacities of SnSb/TiO2 and SnSb/C fade dramatically in less than 80 cycles (Fig. 4d), while the capacity of SnSb/TiO2/C decreases slightly in the first 10 cycles and then increases gradually in the following charge/discharge processes till 150th cycle. This should be attributed to the improved Li-ion accessibility and accommodation behaviour during the cycling process due to the unique nanostructure of SnSb/TiO2/C composite.34 Interestingly, a reversible capacity as high as 630 mA h g−1 can be achieved even after 200 cycles. These results suggest that SnSb/TiO2/C is more effective in accommodating the volume change during the electrochemical alloying/dealloying.

EIS measurements were conducted for further insight into the electrochemical performance of SnSb/TiO2, SnSb/TiO2/C and SnSb/C. The EIS spectrum can be divided into three frequency regions, i.e., low-frequency, medium-to-low-frequency, and high-frequency regions, which correspond, respectively, to cell geometric capacitance, charge transfer reaction, and Li-ion diffusion through the surface layer. The Nyquist plots of three samples after first discharge process are shown in Fig. 5 with a frequency range of 100 KHz to 0.001 Hz. The SEI resistance (RSEI) and the charge transfer resistance (Rct) are simulated with an equivalent circuit model (inset of Fig. 5) and the results are displayed in Fig. S2. The diameter of the semicircle is a measure of the charge-transfer resistance Rct, which is related to the electrochemical reaction between the particles or between the electrode and the electrolyte. On the other hand, the sloping line is related to Li-ion diffusion in the bulk of the active material. Compared to SnSb/C, the diameters of the semi-circles for the SnSb/TiO2 and SnSb/TiO2/C electrode at medium-frequency are much smaller, which indicates a decreased contact and charge transfer resistance. In the low frequency region, the SnSb/TiO2/C electrode exhibits a shortened and more inclined line with a slope of 1.46 (1.07 for SnSb/TiO2), indicating faster Li-ion diffusion in the SnSb/TiO2/C (inset of Fig. 5). These results suggest that SnSb/TiO2/C nanocomposite benefits the electron transformation between the electrode and the electrolyte as compared to SnSb/TiO2 and SnSb/C, which is consistent with the durability data shown in Fig. 5. In addition, the effect from TiO2 cannot be ignored. In our previous works,35,36 we found that bulk TiO2 usually shows a very low capacity (less than 200 mA h g−1) but has an excellent structure stability with only ∼3% volume expansion during lithiation/delithiation. We can see from Fig. 4d that the addition of TiO2 even decreases the capacity of SnSb, but improves the cyclability. We thus deduce that the TiO2 component in SnSb/TiO2/C should mainly stabilize the structure rather than contribute the capacity. Therefore, it is the synergistic effect brought by the carbon layer together with TiO2 that gives rise to the greatly improved electrochemical performance for the SnSb/TiO2/C composite.


image file: c5ra27326a-f5.tif
Fig. 5 EIS curves of SnSb/TiO2/C nanocomposite, SnSb/TiO2, and SnSb/C.

Conclusions

In conclusion, we used a two-step ball milling approach to fabricate a SnSb/TiO2/C nanocomposite using low cost precursors. An in situ mechanochemical reduction occurred during ball milling Sn, Sb and TiO2, leading the formation of SnSb/TiO2 nanocomposite. The second ball milling with graphite resulted in carbon coating, particle size reduction and crystalline degree decrease at the same time. With such a carbon coating nanocomposite structure, SnSb/TiO2/C exhibits outstanding electrochemical properties including high capacity, great rate capability and stable cycling performance, indicating a promising anode for LIBs. Our findings can shed light on the design and preparation of alloy type anodes using low cost precursors and methods.

Acknowledgements

The authors gratefully acknowledge the support from the National High Technology Research and Development Program (863 Program, Grant No. 2013AA032002 and 2015AA034601), China Iron & steel Research Institute Group Foundation (Grant No. SHI11AT0540A) and Advance Technology & Materials Co., Ltd Innovation Foundations (Grant No. 2011JA01GYF, Grant No. 2011JA02GYF, Grant No. 2013JA02PYF).

Notes and references

  1. P. Poizot, S. Laruelle, S. Grugeon, L. Dupont and J. M. Tarascon, Nature, 2000, 407, 496 CrossRef CAS PubMed.
  2. C. M. Park, J. H. Kim, H. Kim and H. J. Sohn, Chem. Soc. Rev., 2010, 39, 3115 RSC.
  3. W. J. Zhang, J. Power Sources, 2011, 196, 13 CrossRef CAS.
  4. H. B. Wu, J. S. Chen, H. H. Hng and X. W. Lou, Nanoscale, 2012, 4, 2526 RSC.
  5. H. Zhang and P. V. Braun, Nano Lett., 2012, 12, 2778 CrossRef CAS PubMed.
  6. J. M. Tarascon and M. Armand, Nature, 2001, 414, 359 CrossRef CAS PubMed.
  7. H. Wu and Y. Cui, Nano Today, 2012, 7, 414 CrossRef CAS.
  8. M. S. Park, S. A. Needham, G. X. Wang, Y. M. Kang and J. S. Park, Chem. Mater., 2007, 19, 2406 CrossRef CAS.
  9. I. Kim, G. E. Blomgren and P. N. Kumta, Electrochem. Solid-State Lett., 2004, 7, 249 Search PubMed.
  10. Y. S. Jung, K. T. Lee, J. H. Ryu, D. Im and S. M. Oh, J. Electrochem. Soc., 2005, 152, A1452 CrossRef CAS.
  11. L. W. Ji, M. Gu, Y. Y. Shao, X. L. Li, M. H. Engelhard, B. W. Arey, W. Wang, Z. Nie, J. Xiao, C. M. Wang, J. G. Zhang and J. Liu, Adv. Mater., 2014, 26, 2901 CrossRef CAS PubMed.
  12. X. Tang, F. Yan, Y. Wei, M. Zhang, T. Wang and T. Zhang, ACS Appl. Mater. Interfaces, 2015, 7, 21890 CAS.
  13. J. Zhou, Y. Hu, X. Li, C. Wang and L. Zuin, RSC Adv., 2014, 4, 20226 RSC.
  14. N. Liu, H. Wu, M. T. McDowell, Y. Yao, C. Wang and Y. Cui, Nano Lett., 2012, 12, 3315 CrossRef CAS PubMed.
  15. B. Luo, B. Wang, M. Liang, J. Ning, X. Li and L. Zhi, Adv. Mater., 2012, 24, 1405 CrossRef CAS PubMed.
  16. J. Qian, Y. Xiong, Y. Cao, X. Ai and H. Yang, Nano Lett., 2014, 14, 1865 CrossRef CAS PubMed.
  17. Y. Yan, F. Du, X. Shen, Z. Ji, H. Zhou and G. Zhu, Dalton Trans., 2014, 43, 17544 RSC.
  18. D. H. Wang, D. Choi, J. Li, Z. G. Yang, Z. Nie, R. Kou, D. H. Hu, C. M. Wang, L. V. Saraf, J. G. Zhang, I. A. Aksay and J. Liu, ACS Nano, 2009, 3, 907 CrossRef CAS PubMed.
  19. R. Zhang and M. S. Whittingham, Electrochem. Solid-State Lett., 2010, 13, A184 CrossRef CAS.
  20. Z. Chen, M. Zhou, Y. Cao, X. Ai, H. Yang and J. Liu, Adv. Energy Mater., 2012, 2, 95 CrossRef CAS.
  21. S. Yoon and A. Manthiram, Chem. Mater., 2009, 21, 3898 CrossRef CAS.
  22. S. Li, Y. Z. Wang, C. Lai, J. X. Qiu, M. Ling, W. Martens, H. J. Zhao and S. Q. Zhang, J. Mater. Chem. A, 2014, 2, 10211 CAS.
  23. S. Li, M. Ling, J. X. Qiu, J. S. Han and S. Q. Zhang, J. Mater. Chem. A, 2015, 3, 9700 CAS.
  24. L. Fan, J. J. Zhang, Y. C. Zhu, X. B. Zhu, J. W. Liang, L. L. Wang and Y. T. Qian, RSC Adv., 2014, 4, 62301 RSC.
  25. F. S. Ke, L. Huang, B. C. Solomon, G. Z. Wei, L. J. Xue, B. Zhang, J. T. Li, X. D. Zhou and S. G. Sun, J. Mater. Chem., 2012, 22, 17511 RSC.
  26. E. Allcorn and A. Manthiram, J. Phys. Chem. C, 2014, 118, 811 CAS.
  27. D. Applestone, S. Yoon and A. Manthiram, J. Mater. Chem., 2012, 22, 3242 RSC.
  28. R. M. Gnanamuthu, Y. N. Jo and C. W. Lee, Curr. Appl. Phys., 2013, 13, 1454 CrossRef.
  29. H. H. Zhao, H. Zeng, Y. Wu, S. G. Zhang, B. Li and Y. H. Huang, J. Mater. Chem. A, 2015, 3, 10466 CAS.
  30. J. Saint, M. Morcrette, D. Larcher, L. Laffont, S. Beattie, J. P. Peres, D. Talaga, M. Couzi and J. M. Tarascon, Adv. Funct. Mater., 2007, 17, 1765 CrossRef CAS.
  31. K. H. Liao, A. Mittal, S. Bose, C. Leighton, K. A. Mkhoyan and C. W. Macosko, ACS Nano, 2011, 5, 1253 CrossRef CAS PubMed.
  32. D. W. Chang, H. J. Choi, I. Y. Jeon, J. M. Seo, L. Dai and J. B. Baek, Carbon, 2014, 77, 501 CrossRef CAS.
  33. M. Kwoka, L. Ottaviano, M. Passacantando, S. Santucci, G. Czempik and J. Szuber, Thin Solid Films, 2005, 490, 36 CrossRef CAS.
  34. G. M. Zhou, D. W. Wang, F. Li, L. L. Zhang, N. Li, Z. S. Wu, L. Wen, G. Q. Lu and H. M. Cheng, Chem. Mater., 2010, 22, 5306 CrossRef CAS.
  35. C. J. Chen, X. L. Hu, B. Zhang, L. Miao and Y. H. Huang, J. Mater. Chem. A, 2015, 3, 22591 CAS.
  36. C. J. Chen, X. L. Hu, Z. H. Wang, X. Q. Xiong, P. Hu, Y. Liu and Y. H. Huang, Carbon, 2014, 69, 302 CrossRef CAS.

Footnote

Electronic supplementary information (ESI) available. See DOI: 10.1039/c5ra27326a

This journal is © The Royal Society of Chemistry 2016