One-pot synthesis of La-doped SnO2 layered nanoarrays with an enhanced gas-sensing performance toward acetone

Fan Gao a, Guohui Qina, Yuehua Li*b, Qiuping Jianga, Li Luoa, Kang Zhaoa, Yongjun Liuc and Heyun Zhao*ad
aDepartment of Materials Science and Engineering, Yunnan University, No. 2 Green Lake North Road, Kunming, 650091, PR China. E-mail: hyzhao@ynu.edu.cn; Fax: +86-871-5153832; Tel: +86-871-5031124
bAdvanced Analysis and Measurement Center of Dali University, No. 2 Hongsheng Road, Dali, 671200, PR China. E-mail: loneman2@163.com
cAdvanced Analysis and Measurement Center of Yunnan University, No. 2 Green Lake North Road, Kunming, 650091, PR China
dYunnan Key Laboratory for Micro/Nano Materials and Technology, Yunnan University, No. 2 Green Lake North Road, Kunming 650091, P.R. China

Received 20th December 2015 , Accepted 13th January 2016

First published on 15th January 2016


Abstract

Lanthanum doped SnO2 well-oriented layered nanorod arrays were synthesized by a substrate-free hydrothermal route of using sodium stannate and sodium hydroxide at 210 °C. The morphology and phase structure of the La-doped SnO2 nanoarrays were investigated by X-ray powder diffraction spectroscopy, scanning electron microscopy, transmission electron microscopy, X-ray photoelectron spectroscopy and the BET method. The results showed that the La-doped SnO2 layered nanorod array demonstrated a unique nanostructure combined together with double layers of nanorod arrays and could be indexed to a tetragonal structure. The gas sensing performance of La-doped SnO2 nanoarrays indicated that La doping could enhance the sensing response to acetone. The 3.0 at% La-doped level of the SnO2 sensor not only showed good selectivity and excellent stability, but also exhibited a rapid response and recovery compared to the pristine and other La-doped levels of SnO2 nanoarrays. The gas sensing mechanism of the La-doped SnO2 layered nanoarray was discussed. The La-doped SnO2 sensors are considered to be promising candidates for applications in detecting acetone.

1. Introduction

Gas monitoring and detection represent a growing demand driven by their applications in air quality control, environmental protection and healthcare as well as security.1,2 Gas sensors based on semiconductor metal oxides, such as SnO2,3 ZnO,4 In2O3 (ref. 5) and TiO2,6 play an important role in the detection of flammable, toxic and harmful gases.7 Tin dioxide (SnO2), a well-known n-type wide band gap semiconductor (Eg = 3.6 eV, at 300 K) with a high exciton binding energy of 130 meV at room temperature, has been widely used in gas sensors due its lower cost, higher chemical sensitivity, faster gas response and good stability. However, it usually suffers from several shortcomings, such as limited maximum sensitivity, high working temperatures, lack of long-term stability and poor selectivity. Thus, how to improve the sensitivity and selectivity of SnO2 gas sensors are still challenges for their practical application so far.8

In order to improve gas-sensing performances, a lot of effort has been devoted to the exploration of new material with enhanced gas sensing performance in recent years. Nanostructured semiconductor oxides are attracting a great deal of attention due to their exclusive properties and novel applications. Since Law et al. fabricated the photochemical NO2 sensors of the SnO2 nanoribbons synthesized by a thermal deposition process for the first time,9 the exploration of gas sensors was focused on various novel SnO2 nanostructures such as nanowires,10,11 nanobelts,12 nanorods,13,14 nanotubes,15 nanosheets,16 hollow spheres,17 nanofibers,18 flower-like,19,20 hierarchical nanoarchitectures21,22 and so on, because they often show a high response due to their high surface–volume ratio, abundant surface states and enhanced surface reactivity. Among them, attributing to their inherent high surface-to-volume ratio and ordered arrangement that are of great benefit for gas diffusion and mass transport in sensor materials, one-dimensional (1-D) nanoarray structures are preferable for the detection of pollutant gases.23–27 On the other hand, another significant effort of doping lanthanides, such as Pr,28 Y,29 La,30 Ce,31 and Sm32 has been made to overcome these limitations and improve the performance. In particular, La-doped SnO2 has become the preferred choice due to the excellent catalytic properties presented by the system,33 thus expecting to enhance the gas response properties.34 Shi et al. reported that La2O3 loading SnO2 nanorods exhibited an obvious enhancement in response to ethanol at low working temperature.35 In van Hieu’s work, SnO2 nanowire sensors functionalized with La2O3 realized an enhanced performance for ethanol compared to uncoated SnO2 nanowire sensors.30 However, as most of these papers are focused on their ethanol sensing properties, 1D SnO2 with high acetone sensing properties has been rarely reported.

Acetone with high volatility is an important reagent in physical and chemical laboratories. However, acetone vapor is toxic, has a bad smell and can cause harmful effects on human health. It has anesthetic effects on the central nervous system and can cause damage to the liver, kidney and pancreas in living beings. In addition, the most hazardous property of acetone is its extreme flammability. Therefore, it is very necessary to study acetone detection for the safety of people and environmental protection.36 Although the gas-sensing response of SnO2 for acetone was reported by some literature in the past few years,27,37,38 not only the gas-sensing response and selectivity, but also the response and recovery time was not good enough to apply in practice. However, a few works have presented that the response of metal oxide nanostructures to acetone is significantly enhanced by doping with rare earth (RE). For example, P. Song reported that Ce-doped SnO2 hollow spheres using PS spheres show a perfect sensing performance toward acetone gas with rapid response, good stability and a high response at 250 °C.39 By an electrospinning technique, X. L. Xu et al. produced an excellent acetone sensor of La-doped ZnO nanofibers with unique bead-like structures.40 These works indicated that RE doping can enhance the response for acetone. In addition, owing to their unique physicochemical properties and their importance in fundamental research and technological applications, various methods have been employed to synthesize SnO2 nanoarrays, including chemical vapor deposition (CVD),41 thermal evaporation (TE),42 a hydrothermal approach43 and so on. Among these routes, the hydrothermal process has been considered the most promising method due to advantages such as low temperature operation, single-step processes and high product purity and homogeneity.44 Nevertheless, to the best of our knowledge, the gas sensing properties for acetone by La-doped SnO2 nanoarrays prepared by the hydrothermal method have not been investigated yet. So it is necessary to investigate the improved acetone gas-sensing properties of La-doped SnO2 nanoarrays synthesized by the hydrothermal route.

In the present work, pristine and different levels of La-doped SnO2 layered nanorod arrays were synthesized using a substrate-free hydrothermal route without any surfactants. On the one hand, the aligned 1D SnO2 arrays are favourable for the improvement of conductivity. On the other hand, doping RE is beneficial to produce more chemisorbed oxygen. Both of them are important to obtain an excellent sensing performance. The gas sensing experiments of La-doped SnO2 nanoarrays were carried out and compared against the pristine SnO2 nanoarrays to study the effect of La-doping on the sensing properties towards acetone. It could be expected that a promising response of the SnO2 nanoarrays to acetone is promoted by doped La.

2. Experimental section

2.1. Preparation of La-doped layered SnO2 nanoarrays

All chemicals (analytical grade reagents) utilized in the present work were obtained from the Sinopharm Chemical Reagent Co. (Shanghai, China) and used as received without further purification. Pristine and La-doped SnO2 layered nanoarrays were synthesized via a simple hydrothermal process with neither substrates nor surfactants present. Typically, sodium hydroxide (NaOH, 7 mmol) was dissolved in 20 ml distilled water with vigorous stirring for 30 min to form a transparent solution. At the same time, sodium stannate four-hydrate (Na2SnO3·4H2O, 0.188 mmol) was also dissolved in 20 ml distilled water with vigorous stirring for 30 min to form a uniform solution. In order to obtain different levels of La-doped SnO2 layered nanoarrays, a suitable amount of lanthanum chloride (LaCl3·6H2O) was added to the solution with an atomic ratio of 0 at%, 1 at%, 3 at%, or 5 at%, respectively. Then, the obtained mixture suspension solution of Na2SnO3·4H2O and LaCl3·6H2O was slowly dripped into the NaOH solution with ceaseless stirring for 30 min to form a semitransparent colloidal solution. After that, 40 ml of absolute ethanol was gradually added into the above mixed solution with vigorous stirring for 60 min and kept at 60 °C. The resulting white homogeneous suspension was transferred to a 100 ml Teflon-lined stainless steel autoclave and then heated in an oven at 210 °C for 48 h. After the autoclave cooled down naturally, a large amount of a greyish white precipitate was collected and washed several times with deionized water and absolute ethanol. Finally, the resulting products were dried in an oven at 80 °C for 24 h for further characterization.

As for the formation mechanism of such layered nanoarrays, it has been studied in our previous work.44 The formation of nanoarrays was affected by the experimental conditions, such as pH value, concentration, growth temperature and reaction time. A non-classical crystallization process, the Ostwald ripening process followed by an in situ oriented growth mechanism was employed. The dopant La does not affect the formation of the layered SnO2 nanorod array, but it will restrain the nanorod upward growth. In the present work, the possible reaction path may be proposed as the following procedure:

 
image file: c5ra27270j-t1.tif(1)

2.2. Characterization of La-doped layered SnO2 nanoarrays

Powder X-ray diffraction (XRD) data were carried out with a Rigaku D/MAX-3B powder diffractometer with a copper target and Kα radiation (λ = 1.54056 Å) was used for phase identification. The samples were scanned from 15° to 90° (2θ) in steps of 0.02°. The general morphology of the SnO2 products was characterized using scanning electron microscopy (SEM, FEI Quanta 200) at an accelerating voltage of 25 kV, while performing detailed structural characterizations using transmission electron microscopy (TEM, JEOL 2010, 200 kV) equipped with selected area electron diffraction (SAED) pattern capabilities. X-ray photoelectron spectroscopy (XPS) was performed at room temperature using PHl X-tool. During XPS analysis, an Al Kα X-ray beam was adopted as the excitation source and power was set to 250 W. UV/vis measurements were made with a UV-2401PC spectrophotometer. The specific surface area of the product was determined by the Brunauer–Emmett–Teller (BET) equation based on the nitrogen adsorption isotherm obtained with a Micromeritics Gemini VII apparatus (Surface Area and Porosity System), and the pore-size distribution was obtained from the desorption branch of the isotherm using the corrected form of the Kelvin equation by means of the Barrett–Joyner–Halenda (BJH) method.

2.3. Fabrication and gas sensing performance tests

The indirect-heating structure was elected to prepare a series of sensors in this paper. A proper amount of the prepared sample was slightly ground together with several drops of water in an agate mortar to form a homogeneous paste. Then the paste was coated onto an alumina tube with Au electrodes and platinum wires which were used as electrical contacts. A Ni–Cr alloy coil was inserted through the tube as a heater to adjust the operating temperature from room temperature to 600 °C, which was controlled by tuning the heating voltage. Before measuring the gas sensing properties, the gas sensors were aged at 500 °C for 150 h in dry air. The gas-sensing properties test was performed on a JF02F gas sensing measurement system (Jin Feng Electronics of Sino-Platinum Metals Co. Ltd., China), which is a static system using atmospheric air as the interference gas and the diluting gas to obtain desired concentrations of target gases in a test chamber (about 15 L in volume). The export signal of the sensor was measured by using a conventional circuit in which the element was connected with an external resistor in series at a circuit voltage. The target gas was injected into the chamber and the response of the sensors began. The gas-sensing properties were assessed through the sensor response S, which was defined as the ratio of Ra/Rg, where Ra and Rg stand for the electrical resistance of the sensor in atmospheric air and in the target gas, respectively. All of the tests of gas-sensing properties were performed at a relative humidity range of 60–70%.

3. Results and discussion

3.1. Characterization of La-doped SnO2 nanoarrays

The crystal structures of the pristine and La-doped SnO2 layered nanoarray samples were firstly characterized by X-ray diffraction (XRD). The typical XRD patterns of the as-prepared SnO2 products as shown in Fig. 1 display a substantial texture effect in accordance with the crystal shape anisotropy and orientation. The peaks of the products are very sharp indicating a high crystallinity. For the 1 at% La-doped SnO2 nanoarray sample, being almost similar to that of the pristine SnO2 sample, all the diffraction peaks can be indexed to the rutile structured SnO2 (JCPDS file No. 41-1445: tetragonal, space group P42/mnm (136), with tetragonal lattice parameters of a = b = 4.738 Å, c = 3.186 Å). No signals of the secondary phase are found in the product. It is possible that La3+ ions cooperate with the matrix of SnO2 to form a La–Sn–O solid solution since the radius of La3+ (1.032 Å) is not much bigger than that of Sn4+ (0.069 nm). For the 3 at% La-doped SnO2 nanoarray sample, two weak additional diffraction peaks located at 28.6° and 48.6° can be detected (curve c), while two obvious additional diffraction peaks located at the same diffraction angle can be observed in the XRD pattern (curve d) for the 5 at% La-doped SnO2 nanoarray sample, indicating the presence of a secondary phase, possibly La2Sn2O7.45 It may be because 5 at% La doping oversaturates SnO2, and the excess La atoms react with SnO2 to form the new phase of La2Sn2O7 detected in the XRD measurement.
image file: c5ra27270j-f1.tif
Fig. 1 (a) XRD patterns of as-synthesized La-doped SnO2 layered nanorod array samples and (b) comparison of the shift of (110) and (101) peaks.

Fig. 1b shows an enlarged image of the diffraction peak corresponding to (110) and (101) planes of SnO2 array nanocrystals between 25° and 36°, which shows the La doping effect on the peak position and intensities. It demonstrates that the peak intensity decreased and the peak position shifted slightly towards a lower angle 2θ side (Δ2θ ∼ 0.24°) with the increase of the La-doped content, which indicates an increase of the lattice parameter caused by tensile/compressive stress on the lattice mainly owing to the rare earth incorporation. This physical process suggests that a portion of La ions formed a stable solid solution with SnO2 and occupied the regular lattice site in SnO2. On the other hand, Fig. 1b shows that the diffraction intensity of the SnO2 nanoarray samples significantly changed after La doping. At the beginning, the intensity decreases with the increase of the La doping levels, and then increased when the La doping level was up to 5 at%. The crystallite size with respect to La dopant concentration was calculated using Scherer’s eqn (2)

 
image file: c5ra27270j-t2.tif(2)
where k is a constant value taken as 0.89, λ is the wavelength of the X-ray source which is taken as 1.5406 Å, β is the full width at half maximum (FWHM) and θ is the Bragg angle. By using Scherer’s formula, the mean crystalline sizes of the obtained layered SnO2 nanoarray samples are calculated to be about 25.3, 15.9, 12.8, and 19.5 nm respectively, employing XRD data of the (101) plane diffraction peak. It indicates that the crystallite size decreased with the addition of the 1 and 3 at% level of the La dopant and slightly increased with the addition of the 5 at% La dopant. This result suggests that the 3 at% level of the La dopant might lead to supersaturation which is responsible for the grain’s shrinkage.32 The slight increase of the crystallite size could be attributed to the formation of La2Sn2O7 in the La-doped SnO2 system. This is in good agreement with the results reported by Weber et al. that segregation of La2Sn2O7 might take place in the SnO2 system.45 The formation of La2Sn2O7 may deteriorate the metal oxide surface that causes the crystallite size increase, which decreases the electric transport of the SnO2 nanoarray. Thus, it is a negative effect on the gas-sensing properties of SnO2 nanoarrays.

Moreover, with respect to the relative intensity of all the SnO2 layered nanoarray samples shown in Fig. 1, it is distinct from that of SnO2 powders, and higher intensity ratios of (101) and (002) to other planes in comparison with those in JCPDS file No. 41-1445 are observed. The peak (002) intensity of all the SnO2 nanoarray samples enhances very significantly. In particular, for the 3 and 5 at% La-doped SnO2 layered nanoarray samples, the intensity of the diffraction peak (002) is nearly equal to the intensity of the (211) diffraction peak. The enhancement of the (002) diffraction peak can be attributed to the oriented growth in the [001] direction and orients perfectly with its c-axis.43 This result indicates that the 3 and 5 at% La-doped SnO2 nanoarrays show a higher orientation degree than the pristine and 1 at% La-doped SnO2 nanorod array.

The morphology of the as-prepared 3% at La-doped SnO2 layered nanoarrays characterized by SEM is shown in Fig. 2. As shown in Fig. 2a, the top-view image of the SnO2 nanoarray displays a large-area, continuous and high ordered dense nanorod array. An enlarged SEM image presented in Fig. 2b shows that the size distribution of the nanorods is almost uniform over the entire area. The narrow size distribution of these nanorods with a fine round bar cross section as well as the vertical and dense alignment in the array is clearly observed. The density of the nanorods on the plane is statistically counted to be ca. 228 μm−2, and the diameter of the cross section is approximately 10 nm. It is clear that the diameter of the La-doped nanorods is obviously smaller than that of the undoped nanorods of the SnO2 nanoarrays synthesized using the same conditions as shown in Fig. 2c, which agrees with the result of the XRD patterns from Fig. 1. It indicates that the La dopant can act as a crystallite growth inhibitor for the SnO2 crystallite to prevent the nanorods further growth up.46,47 The small SnO2 nanorods should provide a large active surface area that could increase the probability of surface trapping to enhance the activity of the surface reaction.


image file: c5ra27270j-f2.tif
Fig. 2 SEM images of 3 at% La-doped SnO2 nanorod arrays. (a) Top-view image. (b) Enlarged image. (c) Pristine SnO2 nanorod array image. (d) Cross-sectional image. (e) Cross-sectional image of an individual nanoarray indicating the layered structure. (f) EDS spectrum.

A section edge of the La-doped layered SnO2 nanoarray as shown in Fig. 2d displays the small nanorods tightly combined together, and these nanorods are generally perpendicular and arranged in very large uniform arrays. Each of the nanorods has one end outside with a neat arrangement, exhibiting peculiar orderly arrayed structures. According to the cross-sectional view image of a single layered nanorod array at higher magnification in Fig. 2e, it can be seen that the La-doped layered SnO2 nanoarray is tightly combined together by two parts of the nanorod array with an apparent interface in the centre. The nanorods on each part, growing approximately perpendicular to the interface, have a length of about 100–200 nm. Note that we did not use any substrate before the reaction, which is usually employed for the growth of SnO2 nanoarrays.41–43 Fig. 2f shows the EDS spectrum of as-prepared 3% La-doped layered SnO2 nanoarrays, which reveals that the product is composed of stannum (Sn), oxygen (O) and lanthanum (La). The 2.91 at% of the La content in the SnO2 nanoarray is consistent with the initial ratio in the experimental design. Moreover, the presence of gold (Au) and carbon (C) in the spectrum is also detected, which come from plating with gold and conducting glue in the SEM experiments.

Fig. 3 shows the TEM and HRTEM images and the corresponding FFT pattern of the SnO2 products in order to further investigate the structure of the 3 at% La-doped layered SnO2 nanoarray. The TEM image of a section removed from the La-doped SnO2 nanorod arrays shown in Fig. 3a demonstrates the rod-like arrayed nanostructure of the La-doped SnO2. The dark middle region is a result of the roots of the numerous nanorods arranged in arrays. An enlarged TEM image of the peaked top of the SnO2 nanorod array shown in Fig. 3b shows that the product mainly consists of a solid rod-like structure with a diameter of about 10 nm. The top TEM image of the SnO2 nanorod array shown in Fig. 3c indicates that the straight nanorods have a smooth surface and an obtuse angled top rather than a flat top. To gain more detailed structural information, HRTEM and FFT of an individual nanorod shown in Fig. 3d depicts a uniform structure and clear lattice fringes. The HRTEM image reveals a 0.354 nm space between two adjacent lattice fringes corresponding to the (110) lattice plane of SnO2 in the tetragonal cassiterite structure, indicating that the exposed facet is the (110) plane and the oriented growth is preferential along the [001] direction.48 However, the space of the adjacent lattice fringes is wider than the general space of 0.32–0.34 nm of bulk SnO2. The increase of the lattice parameter is attributed to the tensile/compressive stress on the lattice caused by the rare earth incorporation, which is in good agreement with the survey result of the XRD patterns from Fig. 1. It is worthwhile to note that single nanoparticle or nanorod La2Sn2O7 is not observed in the HRTEM. The probable reason is that the secondary phase of La2Sn2O7 is not fully formed in the 3 at% La-doped SnO2 arrays due to lack of sufficient La atoms.


image file: c5ra27270j-f3.tif
Fig. 3 TEM images of 3 at% La-doped SnO2 nanorod arrays. (a) TEM image of a section removed from the nanorod array at low magnification. (b) Enlarged TEM image of the nanorod array. (c) TEM image of a few individual La-doped nanorods. (d) HRTEM image of a single La-doped SnO2 nanorod. Inset: electron diffraction pattern of the Fourier transform image.

A high-energy shift of an absorption edge is generally expected for nanomaterials. The UV-vis spectrum of the as-obtained pristine and 3 at% La-doped SnO2 nanorod array samples dispersed in ethanol were measured in the wavelength range of 200–700 nm and the result is depicted in Fig. 4. Two plots show nonlinear characteristics, indicating the direct transition nature. Compared to the strong absorption of the pristine SnO2 sample appearing in the ultraviolet region near the visible-light region in the vicinity of 253 nm, the 3 at% La-doped SnO2 sample appears in a broad absorption region in the wavelength range of 200–320 nm. A feature of the optical absorption spectrum is the narrowing at the absorption edge around 300 nm, confirming the ordered array structure of the SnO2 nanoarray. From the optical absorption spectrum, the optical band gap (Eg) of the SnO2 nanoarray can be determined by using the Wood and Tauc equation:49

 
(αhν)n = B(Eg) (3)
where is photonic energy, α is the absorption coefficient, which is obtained directly from the Munk–Kubelka equation, B is a constant related to the material, and Eg is the band-gap energy. For the direct band-gap semiconductor, n is equal to 2. Based on this relation, a plot of (αhν)2 vs. hν is shown in Fig. 4b. The band edge can be evaluated from the intercept of the extrapolated linear part of the curve on the energy axis. The corresponding value of the optical band gap (Eg) for bulk SnO2 is 3.65 eV, while 4.52 and 2.75 eV correspond to the pristine and 3 at% La-doped SnO2 nanorod arrays, respectively. The increase in the band-gap of the pristine SnO2 nanorod array indicates a blue-shift in comparison with that of its bulk counterparts, being ascribed to quantum confinement effects of the nanostructure and the small crystallite size.50 For the 3 at% La-doped SnO2 sample, the observed decrease in the band gap with the doping of La is analogous to the result reported elsewhere.51 The decrease in the band-gap is reflected by the red shift in the absorption spectrum to a certain minimum value. The red shift may be attributed to a change in the energy eigen value resulting from the perturbation potential caused by the exchange interaction. The variation in the band-gap due to La doping can be a result of the Moss–Burstein (MB) effect, in which the band-gap can be presented as Eg = Ego + ΔEMB, where Ego is the intrinsic band gap and ΔEMB is the amount of band gap change (a function of electron or hole concentration).52 The other reason for optical band-gap reduction may be the appearance of La–Sn metallic compounds. The narrowing band-gap is conducive to the electronic transport rate, which enhances the gas adsorption/desorption to accelerate the reaction rate. These considerations motivated us to explore the La-doped SnO2 nanorod arrays for gas sensing.


image file: c5ra27270j-f4.tif
Fig. 4 (a) UV-vis diffuse reflectance spectrum of a La-doped layered SnO2 nanorod array and (b) (αhν)2 vs. photon energy plots.

The narrow scan XPS spectra were measured in order to study the chemical bond configuration and the composition of as-prepared 3 at% La-doped SnO2 nanoarrays and the result is shown in Fig. 5. The carbon 1s line is used as the energy reference material to calibrate the binding energy scale for XPS measurements and to compensate for the surface charging effect. Fig. 5a shows the binding energy of C 1s at 285.4 eV, which might be introduced from adsorption of the sample surface and contamination of the instrument. The high-resolution XPS spectra survey of Sn 3d (Fig. 5b) shows that Sn 3d5/2 peaks occur at 487.28 eV, and the Sn 3d3/2 peak is located at 495.58 eV, respectively. The energy difference between the Sn 3d5/2 and Sn 3d3/2 peak is 8.3 eV, which is in good agreement with the energy splitting reported for SnO2.53 The Sn 3d5/2 peak of the prepared SnO2 nanorods is consistent with the standard data (486.70 eV), indicating that Sn presents in a chemical state of +4. The XPS La 3d spectrum presented in Fig. 5c shows complicated structures. It exhibits two double peaks and the energy loss peaks appearing on the high energy sides of the 3d5/2 and 3d3/2 peaks are satellite peaks. XPS results show that La is in the +3 oxidation state in La–SnO2, which is confirmed by the La 3d5/2 binding energy position at 835.2 eV, the value of the spin–orbit splitting (16.88 eV) and the presence of intense lines of the “shake-up satellites”. Similar La 3d5/2 binding energy values have been reported in ref. 40. The O 1s spectrum of SnO2 nanoarrays is shown in Fig. 5d. The broad and asymmetric nature of this peak could be due to various coordinations of oxygen in the nanorods.54 The obtained O 1s peak was deconvoluted into two components by fitting it according to the Gaussian function. The component on the binding energy side at 531.12 eV is associated with O2− anions in oxygen-deficient regions within the matrix of SnO2. The binding energy of 531.82 eV originates in the adsorbed Ox ions (O and O2 ions) in the oxygen deficient regions within the matrix of SnO2 caused by oxygen vacancy (VO), oxygen interstitial (Oi) and oxygen antisite (OSn), which react with the tested gases and then enhance the hole concentration.55 Therefore, the richness of adsorbed oxygen ions can contribute to the gas sensitivity.


image file: c5ra27270j-f5.tif
Fig. 5 High-resolution XPS spectra of La-doped SnO2 layered nanorod array. (a) C 1s. (b) Sn 3d. (c) La 3d and (d) O 1s region.

Brunauer–Emmett–Teller (BET) nitrogen adsorption and desorption measurement of the as-prepared La-doped SnO2 nanorod array product was carried out to estimate the sensing performances. The representative N2 adsorption and desorption isotherm and the corresponding BJH pore size distribution plot of the SnO2 nanorod array are show in Fig. 6. The isotherm of the SnO2 nanorod array product shown in Fig. 6a exhibits a hysteresis loop at the p/p0 ranges of 0.40–0.95, which is associated with the filling and emptying of the SnO2 nanoarray by capillary condensation. It implies that the SnO2 nanoarray sample exhibits a larger pore volume between the nanorods. The pore size distribution of the SnO2 nanoarray sample (Fig. 6b) shows that a broad peak appears in the pore size region of 9–100 nm and its top value is located at 22 nm, indicating thinner nanorods of the SnO2 nanoarray, which could make a capacious pore space and a large effective surface area. In fact, the specific surface area of the SnO2 nanoarray was calculated to be 23.621 m2 g−1 using the BET method, indicating an enlargement of the active surface among the nanorods of the SnO2 nanoarray. So, it can be concluded that a large number of mass transport channels and a large surface area of the La–SnO2 nanoarray contribute to high sensitivity and a rapid response.


image file: c5ra27270j-f6.tif
Fig. 6 (a) A typical nitrogen adsorption–desorption isotherm and (b) BJH pore size distribution plots.

3.2. Gas sensing properties

In order to reveal the enhanced sensing performance of the La-doped SnO2 nanoarray, we took the pristine and La-doped SnO2 nanoarray products as sensing materials, and investigated the application of the SnO2 nanoarrays as a gas sensor.

Gas-sensing experiments were performed at different operating temperatures to find out the optimum operating conditions. Fig. 7 shows the relationship between the different operating temperatures and the responses of the sensors to 200 ppm acetone. The response increases and reaches its maximum at a certain temperature, and then decreases rapidly with the increase of the operating temperature. This behaviour can be accounted for by the kinetics and mechanism of the gas adsorption and desorption on the surface of SnO2.56 An n-type metal oxide can adsorb oxygen from the atmosphere both in the O2− and in O species. The adsorption of O is the most interesting process in sensors, because this oxygen ion is more reactive and thus makes the material more sensitive to the presence of reducing gases. At a relatively low surface temperature, the sensor preferentially adsorbs O2− and the sensitivity of the material is consequently very small. As the temperature increases, the dominant process becomes the adsorption of O, and then the response increases too. If the temperature increases too much, progressive adsorption of all oxygen ionic species previously adsorbed occurs and the response decreases. As shown in Fig. 7, it is obvious that the response of the sensors vary with the operating temperature. The optimum operating condition for pristine SnO2, 1 at%, 3 at% and 5 at% La-doped SnO2 was obtained at a temperature of 310, 300, 290 and 290 °C, according to a response of the sensors of 37, 43, 48 and 69, respectively. This result demonstrates that the 3 at% La-doped SnO2 nanoarray sensor has a lower optimum temperature and the highest response. The reason could be attributed to the excellent catalytic effect of La doping to enhance the chemical reactivity of adsorbed oxygen and gas molecules. Thus, the optimized operating temperature is determined to be 290 °C in the present work.


image file: c5ra27270j-f7.tif
Fig. 7 Gas response depending on the operating temperature of the La-doped SnO2 layered nanorod arrays.

In order to explore the selectivity and the optimal doping level, we performed experiments using the SnO2 nanoarrays with different lanthanum doping contents exposed to 200 ppm of seven tested VOC gases, including acetone, isopropanol, ammonia, toluene, methanal, gasoline and alcohol, and the results are shown in Fig. 8. It shows that all the sensors exhibited a good response to acetone, isopropanol and alcohol, in agreement with previous reports.27,57 Moreover, Fig. 8 also shows an effective sensitivity enhancement to acetone, isopropanol, alcohol and methanal after doping with a certain content of lanthanum. In particular, the improvement of the response to acetone is very significant. It is obvious that the response of the pristine SnO2 nanoarray towards acetone is no greater than 22, while the 3 at% La-doped SnO2 nanoarray sensor achieves the highest response and the amplitude is about 69, which is more than 3 times larger than that of the pristine SnO2 nanoarray. However, the highest sensitivity of the 1 and 5 at% La-doped SnO2 nanoarray sensors toward 200 ppm of acetone is only 32 and 40.5, respectively. Obviously, the gas sensor based on 3 at% La-doped SnO2 shows good selectivity for acetone. Too much La dopant may form a La2Sn2O7 phase in SnO2 metal oxide, which deteriorates the surface of the metal oxide and increases the crystallite size, leading to a decrease in its response.57 As for the 1 at% La-doped SnO2 nanoarray, the relatively lower response is attributed to the lower catalytic activity and larger crystallite size due to the lower level of the La dopant. Therefore, the response of the 1 and 5 at% La-doped SnO2 sensor is lower than that of the 3 at% La-doped SnO2 nanoarrays. This result indicates that La doping is beneficial to enhance the response of the SnO2 nanoarrays for acetone, and 3 at% La doping is an optimal doping level for getting the highest response in our La-doped SnO2 nanoarray system.


image file: c5ra27270j-f8.tif
Fig. 8 Bar chart showing the response of the La-doped layered SnO2 nanorod arrays to different gases at 290 °C.

A reproducible characteristic and rapid response and recovery to a target gas is demanded for practical application. The dynamic response and recovery behaviours of the La-doped layered SnO2 nanorod arrays were investigated with sensors being orderly exposed to different concentrations of acetone at the optimum operating temperature of 290 °C and the results are displayed in Fig. 9. It is evident that the curves descend or ascend when vapor is in or out, revealing the semiconductor characteristic of the sensors. Fig. 9 shows that the response amplitude of the sensors gradually increases with the gas concentration increasing from 5, 10, to 200 ppm. Noticeably, the sensors present a considerable response to a low acetone concentration of 5 ppm. The highest response runs up to 5.6 for the 3 at% La-doped SnO2 nanoarray sensor at the operating temperature of 290 °C, while the responses of other nanoarray sensors also reach 3.5, 4.1 and 4.5, respectively. This result suggests that the sensor based on a La-doped SnO2 nanoarray is favourable to detect acetone at a low concentration. Moreover, it can be seen from Fig. 9 that the response and recovery characteristics are almost reproducible as well as the rapid response and recovery, indicating stable and repeatable characteristics while maintaining a fast response and recovery state. Particularly, the response and recovery characteristics of the La-doped SnO2 nanoarrays are significantly improved after doping with La.


image file: c5ra27270j-f9.tif
Fig. 9 Dynamic response and recovery behaviours of the layered SnO2 nanorod arrays exposed to different concentrations of acetone at 290 °C. (a) Undoped. (b) 1 at%. (c) 3 at% and (d) 5 at%.

The gas sensing response and recovery time is an important consideration to evaluate the performance of a gas sensor. They are defined as the time required to achieve 90% of the response variation when the gas goes in and out. The 90% response time for gas exposure (t90%(air-to-gas)) and that for recovery (t90%(gas-to-air)) were calculated from the response-time data shown in Fig. 10, which is the response transient of the sensor to 200 ppm of acetone at 290 °C. In the pristine SnO2 nanoarrays sensor, the response time in the sensing of acetone reaches 48 s, while the recovery time is 56 s. However, after doping with La, both the t90%(air-to-gas) and t90%(gas-to-air) are obviously shortened compared with the pristine SnO2 nanoarray sensor. In the La-doped SnO2 nanoarray sensors, the response time in the sensing of acetone ranged from 6 s to 12 s, while the recovery time is about 20 s. It is worth noting that this result is greatly different to the results of the response and recovery becoming slower after doping with La as reported by S. L. Shi and Gaik Tin Ang.35,57 The fast response may arise from the following reasons. On the one hand, the distinct construction of layered SnO2 nanorod arrays provides a huge number of gas transport channels and an enlargement of the active specific surface area, which is helpful to accelerate the diffusion and mass transport of the gas molecules. It could be conducive to decreasing the chemical activation energy and accelerating the chemical reaction rate. On the other hand, due to their excellent catalytic properties, La dopants can also serve as sensitizers because they are able to increase the amount of active sites on the surface, which may accelerate the chemical reaction rate on the surface of the nanorods. Therefore, the La doped SnO2 nanorod array is a promising approach for enhancing the response properties to acetone.


image file: c5ra27270j-f10.tif
Fig. 10 Enlarged response and recovery transient times examined for pristine and La-doped SnO2 nanorod arrays to 200 ppm of acetone. (a) Response time. (b) Recovery time.

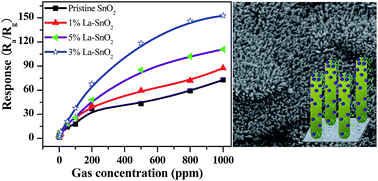
Curves of sensitivity as a function of acetone concentration at an operating temperature of 290 °C are summarized in Fig. 11. It can be observed from Fig. 11 that the response of the sensors increase with the increase of gas concentration. For the concentration of acetone at 1, 5, 10, 50, 100, 200, 500, 800 and 1000 ppm, the highest response of the SnO2 (3.0 at% La-doped SnO2 nanoarray) sensor is 3.4, 5.6, 8.7, 20.9, 37, 68, 118, 146 and 152.8, respectively. The response rapidly increases with the acetone concentration increasing up to 500 ppm. Above 500 ppm, the response still increases with the increase in acetone concentration, however, less rapidly. When the acetone concentration reaches 800–1000 ppm, the response increases slightly, which indicates that the sensors become more or less saturated. It is noteworthy that the sensor fabricated in our work exhibits better sensing performances for acetone gas compared with those recently reported in the literature.40,57–60


image file: c5ra27270j-f11.tif
Fig. 11 Gas response of a 3 at% La-doped SnO2 layered nanorod array to different acetone concentrations at 290 °C.

In practical application, the long-term stability of gas sensors is critical, for which we must determine the reliability of gas sensors and their length of service. To verify the stability of the 3 at% La-doped SnO2 layered nanorod array sensor, the gas response evolution was measured by repeating the response measurement for a number of times under different concentrations (50, 100, 200, 500, 800, and 1000 ppm of acetone gas at 290 °C) for two months. The response of the 3 at% La-doped SnO2 sensor towards acetone was measured on the 10th, 20th, 30th, 40th, 50th and 60th day after the first measurement and the result is shown in Fig. 12. The 60 days-later response is slightly changed to ±12.2%, ±9.8%, ±8.6%, ±10.2%, ±10.4% and 12.7% for 50, 100, 200, 500, 800 and 1000 ppm of acetone gas, respectively, illustrating good stability and reliability of the sensor material for commercial application.


image file: c5ra27270j-f12.tif
Fig. 12 Stability of 3 at% La-doped SnO2 nanorod arrays to 50, 100, 200, 500, 800 and 1000 ppm of acetone gas at 290 °C over two months.

3.3. Sensing mechanism

As an n-type metal oxide semiconductor, the gas-sensing mechanism of tin dioxide (SnO2) is that the change of resistance is mainly caused by the adsorption and desorption of gas molecules on the surface.61 When the SnO2 nanoarray sensor is exposed in ambient air, oxygen molecules are chemisorbed and capture electrons from the conduction band of SnO2, which causes a depletion region on the surface of SnO2. Following this, these oxygen molecules form O2, O and O2−, and then these oxygen species are absorbed on the surface of the SnO2 semiconductor at an elevated temperature. Therefore, more electrons are transferred to the absorbed oxygen from SnO2, resulting in an obvious decrease of the carrier concentration within SnO2 nanorods. Consequently, the carrier mobility decreases vastly. This temperature dependent process of oxygen ionosorption can be described by the following equations:62
 
O2(gas) ↔ O2(ads) (4)
 
O2(ads) + e ↔ O2(ads) (5)
 
O2(ads) + e ↔ 2O(ads) (6)

When the surface of the SnO2 nanoarray sensor is exposed to reductive gases (e.g., acetone), a surface reaction happens, the tested gas molecules are oxidized by the adsorbed oxygen species, reducing the coverage of oxygen ions and simultaneously the depleted electrons are fed back into the SnO2 conductance band, resulting in a narrowed depletion layer and therefore the sensor resistance is decreased. When gas is out, the sensor will be exposed to air again and thus refreshed by air. The sensitivity is based on the surface reaction that takes place between the VOC molecules and the oxygen ions. As a reducing gas, acetone can react with the adsorbed oxygen by thermal oxidation and release the electrons into the SnO2 conduction band, which leads to a decrease of the sensor resistance and generating electrical signals. The schema of the intermediate processes and phases during the thermal oxidation of acetone can be described as follows:63

 
CH3COCH3 → CH3COCH*2 → (CH3CHO, CH3) → H2C2O → H2CO → CO → CO2 (7)

In this work, the response of the La-doped SnO2 sensors towards acetone was largely promoted by the La dopant. The mechanism could be explored from the following aspects. On the one hand, the positive effect of La doping on acetone sensitivity can be explained by the thermal decomposition of acetone as in the above description under lanthanum catalysis. It is well known that the catalytic activity properties of semiconductor metal oxides are strongly related to their acid/base characteristics.33 SnO2 is a predominantly acidic oxide (isoelectronic point, iep = 4–7), while lanthanum is a basic alkalescent.64 When lanthanum was added to SnO2, La3+ is grouped into a low negativity cation which can enhance the sensitivity. La-doped SnO2 has become the preferred choice due to the electronegativity of the cation present in the system (and thereby automatically related to the acid/base characteristics). The selectivity of the surface reaction was influenced by the acid–base properties of oxide surface. According to eqn (7), the dehydrogenation route goes through an acetaldehyde (CH3CHO) intermediate when the surface is basic.33 It should be noted that the basic surface not only enhances the catalytic activity for the dehydrogenation of acetone gas to CH3CHO, but also shows a strong ability for the consecutive oxidation of CH3CHO to CO2.65 Therefore, the La dopant can accelerate the dehydrogenation and consecutive oxidation of hydrocarbons, resulting in an enhancement of acetone sensitivity. On the other hand, the positive effect of doped La on acetone sensitivity can also be attributed to the growth of the SnO2 crystal inhibited by La doping, which leads to a decrease of the SnO2 crystallite size. The sensitivity of the SnO2 sensor is known to be dependent on the crystallite size due to the small grains with a large specific surface area being conducive to promoting the sensitivity of the sensors. From the results of XRD, SEM and BET, there are some significant observations. Therefore, the role of lanthanum in SnO2 has the following summarized effects: (i) as an effective grain growth inhibitor, doped-La restrains the growth of the SnO2 nanorods to result in a high surface area, which enhances acetone sensitivity, and (ii) the basic properties of doped lanthanum prompts the surface dehydrogenation and consecutive oxidation of the hydrocarbons that could improve the acetone selectivity and sensitivity of La-doped SnO2 layered nanorod arrays.

4. Conclusions

In summary, different levels of La-doped layered SnO2 nanoarrays were fabricated by a facile hydrothermal growth route in the absence of substrates and without any surfactants. The La-doped layered SnO2 nanoarrays showed a unique nanostructure combined together by two layers of rutile SnO2 nanorods with a diameter of 10 nm and length of several hundred nanometers. As a sensing material, the results of the gas sensing performance to acetone indicated that the gas sensing properties of the La-doped layered SnO2 nanoarrays could be greatly improved by La doping. The 3.0 at% La-doped SnO2 sensor exhibited excellent sensitivity, good selectivity and stability, and rapid response and recovery compared with the pristine and other La-doped SnO2 sensors. The greatly improved response was attributed to the unique nanostructure of the double layers of the nanorod array, the higher specific surface area and the excellent catalytic properties of the La dopant that is able to increase the amount of active sites on the surface of semiconducting oxides. The La-doped SnO2 nanoarray gas sensor can be used as a promising material for acetone detection, which may have great potential for the development of a metal–oxide semiconductor for environmental monitoring.

Acknowledgements

This work was supported by the National Natural Science Foundation of China (no. 61161008, 61564009) and the Natural Science Foundation of Yunan Province (2009CD015).

References

  1. J. Y. Liu, Z. Guo, F. L. Meng, Y. Jia and J. H. Liu, J. Phys. Chem. C, 2008, 112, 6119 CAS.
  2. T. Kawano, H. C. Chiamori, M. Suter, Q. Zhou, B. D. Sosnowchik and L. Lin, Nano Lett., 2007, 7, 3686 CrossRef CAS PubMed.
  3. Y. Liu, E. Koep and M. L. Liu, Chem. Mater., 2005, 17, 3997 CrossRef CAS.
  4. C. Peng, J. J. Guo, M. R. Liu, Y. X. Zheng, T. T. Huang and D. J. Wu, RSC Adv., 2014, 4, 64093 RSC.
  5. M. W. K. Nomani, D. Kersey, J. James, D. Diwan, T. Vogt, R. A. Web and G. Koley, Sens. Actuators, B, 2011, 160, 251 CrossRef CAS.
  6. Y. Shimizu, T. Hyodo and M. Egashira, Sens. Actuators, B, 2007, 121, 219 CrossRef CAS.
  7. H. Gómez-Pozos, J. L. González-Vidal, G. A. Torres, M. L. Olvera and L. Castáneda, Sensors, 2014, 14, 403 CrossRef PubMed.
  8. N. Barsan, D. Koziej and U. Weimar, Sens. Actuators, B, 2007, 121, 18 CrossRef CAS.
  9. M. Law, H. Kind, B. Messer, F. Kim and P. D. Yang, Angew. Chem., Int. Ed., 2002, 41, 2405 CrossRef CAS.
  10. B. Wang, L. F. Zhu, Y. H. Yang, N. S. Xu and G. W. Yang, J. Phys. Chem. C, 2008, 112, 6643 CAS.
  11. J. Pan, R. J. Ganesan, H. Shen and S. J Mathur, J. Phys. Chem. C, 2010, 114, 8245 CAS.
  12. L. L. Fields and J. P. Zheng, Appl. Phys. Lett., 2006, 88, 263102 CrossRef.
  13. L. M. Yu, X. H. Fan, L. J. Qi, L. H. Ma and W. Yan, Appl. Surf. Sci., 2011, 257, 3140 CrossRef CAS.
  14. H. Huang, Y. C. Lee, O. K. Tan, W. Zhou, N. Peng and Q. Zhang, Nanotechnology, 2009, 20, 115501 CrossRef PubMed.
  15. L. Shi and H. L. Lin, Langmuir, 2011, 27, 3977 CrossRef CAS PubMed.
  16. Z. J. Wang, S. Y. Liu, T. T. Jiang, X. R. Xu, J. Zhang, C. H. An and C. Wang, RSC Adv., 2015, 5, 64582 RSC.
  17. F. Gyge, M. Hubner, C. Feldmann, N. Barsan and U. Weimar, Chem. Mater., 2010, 22, 4821 CrossRef.
  18. L. L. Wang, X. J. Luo, X. J. Zheng, R. Wang and T. Zhang, RSC Adv., 2013, 3, 9723 RSC.
  19. Q. Wang, L. S. Zhang, J. F. Wu, W. D. Wang, W. G. Song and W. Wang, J. Phys. Chem. C, 2010, 114, 22671 CAS.
  20. H. Wang, Q. Q. Liang, W. J. Wang, Y. R. An, J. H. Li and L. Guo, Cryst. Growth Des., 2011, 11, 2942 CAS.
  21. L. Y. Jiang, X. L. Wu, Y. G. Guo and L. J. Wan, J. Phys. Chem. C, 2009, 113, 14213 CAS.
  22. H. R. Kim, K. I. Choia, J. H. Lee and S. A. Akbar, Sens. Actuators, B, 2009, 136, 138 CrossRef CAS.
  23. X. M. Wang, F. Z. Sun, Y. Q. Duan, Z. P. Yin, W. Luo, Y. A. Huang and J. K. Chen, J. Mater. Chem. C, 2015, 3, 11397 RSC.
  24. C. M. Chang, M. H. S. Hon and I. C. Leu, RSC Adv., 2012, 2, 2469 RSC.
  25. Y. Zhang, J. Q. Xu, Q. Xiang, H. Li, Q. Y. Pan and P. C. Xu, J. Phys. Chem. C, 2009, 113, 3430 CAS.
  26. J. B. Sun, P. Sun, D. L. Zhang, J. Xu, X. S. Liang, F. M. Liu and G. Y. Lu, RSC Adv., 2014, 4, 43429 RSC.
  27. L. Luo, Q. P. Jiang, G. H. Qin, K. Zhao, G. F. Du, H. Wang and H. Y. Zhao, Sens. Actuators, B, 2015, 218, 205 CrossRef CAS.
  28. W. Q. Li, S. Y. Ma, Y. F. Li, X. B. Li, C. Y. Wang, X. H. Yang, L. Cheng, Y. Z. Mao, J. Luo, D. J. Genzang, G. X. Wan and X. L. Xu, J. Alloys Compd., 2014, 605, 80 CrossRef CAS.
  29. L. Cheng, S. Y. Ma, X. B. Li, J. Luo, W. Q. Li, F. M. Li, Y. Z. Mao, T. T. Wang and Y. F. Li, Sens. Actuators, B, 2014, 200, 181 CrossRef CAS.
  30. N. van Hieu, H. R. Kim, B. K. Ju and J. H. Lee, Sens. Actuators, B, 2008, 133, 228 CrossRef.
  31. Y. Qu, H. Wang, H. Chen, J. Xiao, Z. D. Lin and K. Dai, RSC Adv., 2015, 5, 16446–16449 RSC.
  32. S. Habibzadeh, A. A. Khodadadi and Y. Mortazavi, Sens. Actuators, B, 2010, 144, 131 CrossRef CAS.
  33. I. T. Weber, A. Valentini, L. F. D. Probst, E. Longo and E. R. Leite, Mater. Lett., 2008, 62, 1677 CrossRef CAS.
  34. G. Z. Zhang, S. P. Zhang, L. Yang, Z. J. Zou, D. W. Zeng and C. S. Xie, Sens. Actuators, B, 2013, 188, 137 CrossRef CAS.
  35. S. L. Shi, Y. G. Liu, Y. J. Chen, J. Y. Zhang, Y. G. Wang and T. H. Wang, Sens. Actuators, B, 2009, 140, 426 CrossRef CAS.
  36. X. B. Li, S. Y. Ma, F. M. Li, Y. Chen, Q. Q. Zhang, X. H. Yang, C. Y. Wang and J. Zhu, Mater. Lett., 2013, 100, 119 CrossRef CAS.
  37. D. Chen, J. Xu, Z. Xie and G. Z. Shen, ACS Appl. Mater. Interfaces, 2011, 3, 2112 CAS.
  38. J. R. Huang, K. Yu, C. P. Gu, M. H. Zhai, Y. J. Wu, M. Yang and J. H. Liu, Sens. Actuators, B, 2010, 147, 467 CrossRef CAS.
  39. P. Song, Q. Wang and Z. X. Yang, Sens. Actuators, B, 2012, 173, 839 CrossRef CAS.
  40. X. L. Xu, Y. Chen, S. Y. Ma, W. Q. Li and Y. Z. Mao, Sens. Actuators, B, 2015, 213, 222 CrossRef CAS.
  41. X. B. Li, X. W. Wang, Q. Shen, J. Zheng, W. H. Liu, H. Zhao, F. Yang and H. Q. Yang, ACS Appl. Mater. Interfaces, 2013, 8, 3033 Search PubMed.
  42. X. Wang, W. Liu, H. Yang, X. Li, N. Li, R. Shi, H. Zhao and J. Yua, Acta Mater., 2011, 59, 1291 CrossRef CAS.
  43. Y. L. Wang, M. Guo, M. Zhang and X. D. Wang, CrystEngComm, 2010, 12, 4024 RSC.
  44. K. Zhao, G. F. Du, L. Luo, G. H. Qin, Q. P. Jiang, Y. J. Liu and H. Y. Zhao, CrystEngComm, 2015, 17, 2030 RSC.
  45. I. T. Weber, A. P. Maciel, P. N. Lisboa-Filho, E. Longo, E. R. Leite, C. O. Paiva-Santos, Y. Maniette and W. H. Schreiner, Nano Lett., 2002, 2, 969 CrossRef CAS.
  46. X. Ya, G. Z. Zhang, S. P. Zhang, D. W. Zeng and C. S. Xie, Mater. Res. Bull., 2014, 52, 56 CrossRef.
  47. A. M. Ruiz, A. Cornet and J. R. Morante, Sens. Actuators, B, 2004, 100, 256 CrossRef CAS.
  48. J. Oviedo and M. J. Gillan, Surf. Sci., 2000, 463, 93 CrossRef CAS.
  49. S. T. Fukuda and A. Kasuya, J. Appl. Phys., 2000, 87, 1318 CrossRef.
  50. A. Sharma, D. Prakash and K. D. Verma, J. Optoelectron. Adv. Mater., 2009, 11, 331 CAS.
  51. A. Azam, A. S. Ahmed, S. S. Habib and A. H. Naqvi, J. Alloys Compd., 2012, 523, 83 CrossRef CAS.
  52. P. S. Raghupathi, J. George and C. S Menon, Indian J. Pure Appl. Phys., 2005, 43, 620 CAS.
  53. Z. F. Dai, L. C Jia, G. T. Duan, Y. Li, H. W. Zhang, J. J Wang, J. L. Hu and W. P. Cai, Chem.–Eur. J., 2013, 19, 13387 CrossRef CAS PubMed.
  54. M. Chen, X. Wang and Y. H. Yu, Appl. Surf. Sci., 2000, 158, 134 CrossRef CAS.
  55. M. Chen, Z. Wang, D. Han, F. Gu and G. Guo, J. Phys. Chem. C, 2011, 115, 12763 CAS.
  56. N. Yamazoe, J. Fuchigama, M. Kishikawa and T. Seiyama, Surf. Sci., 1979, 86, 335 CrossRef CAS.
  57. G. T. Ang, G. H. Toh, M. Z. A. Bakar, A. Z. Abdullah and M. R. Othman, Process Saf. Environ. Prot., 2011, 89, 186 CrossRef CAS.
  58. L. P. Chikhale, J. Y. Patil, A. V. Rajgure, F. I. Shaikh, I. S. Mulla and S. S. Suryavanshi, Ceram. Int., 2014, 40, 2179 CrossRef CAS.
  59. F. Liu, X. F. Chu, Y. P. Dong, W. B. Zhang, W. Q Sun and L. M Shen, Sens. Actuators, B, 2013, 188, 469 CrossRef CAS.
  60. Y. Zeng, T. Zhang, M. X. Yuan, M. H. Kang, G. Y. Lu, R. Wang, H. T. Fan, Y. He and H. B. Yang, Sens. Actuators, B, 2009, 143, 93 CrossRef.
  61. M. Batzill and U. Diebold, Phys. Chem. Chem. Phys., 2007, 9, 2307 RSC.
  62. Y. Tian, J. C. Li, H. Xiong and J. N. Dai, Appl. Surf. Sci., 2012, 258, 8431 CrossRef CAS.
  63. K. W. Kim, P. S. Cho, S. J. Kim, J. H. Lee, C. Y. Kang, J. S. Kim and S. J. Yoon, Sens. Actuators, B, 2007, 123, 318 CrossRef CAS.
  64. J. S. Reed, Principles of Ceramics Processing, John Wiley & Sons, Inc, New York USA, 1995 Search PubMed.
  65. T. Jinkawa, G. Sakai, J. Tamaki, N. Miura and N. Yamazoe, J. Mol. Catal. A: Chem., 2000, 155, 193 CrossRef CAS.

Footnote

Fan Gao and Guohui Qin contributed equally to this work.

This journal is © The Royal Society of Chemistry 2016
Click here to see how this site uses Cookies. View our privacy policy here.