
Biosorption of cadmium by a lipid extraction residue of lipid-rich microalgae†
Heshan Zhenga,
Wanqian Guo*a,
Shuo Lia,
Qinglian Wua,
Renli Yina,
Xiaochi Fenga,
Juanshan Dua,
Nanqi Rena and
Jo-Shu Chang*ab
aState Key Laboratory of Urban Water Resource and Environment, Harbin Institute of Technology, 73 Huanghe Road, Harbin, Heilongjiang 150090, P. R. China. E-mail: hitgwq@yeah.net
bDepartment of Chemical Engineering, National Cheng Kung University, Tainan, Taiwan. E-mail: changjs@mail.ncku.edu.tw
First published on 4th February 2016
Abstract
The present study investigates the performances and mechanisms of biosorption of cadmium (Cd) ions using a lipid extraction residue from three strains of lipid production microalgae. The adsorption performance was determined by batch biosorption experiments and kinetic modeling. The algae cell in the whole growth period and lipid extraction residue both exhibited desirable adsorption performance. The lipid extraction residue from the strain of Coelastrum sp. PTE-15 had the highest capacity of Cd sorption, which was 32.8 mg g−1. FTIR data suggested that the functional groups acting as binding sites on the microalgae surface which participate in biosorption were carboxylic, hydroxyl, and amino. The biosorption properties and maximum adsorption capacity of the lipid extraction residue from three microalgal strains were determined by equilibrium modeling. The adsorption process followed the Langmuir isotherm model with a high value of correlation coefficients (≥0.99) and biosorption capacity being estimated to be 36.1 mg g−1.
1. Introduction
Heavy metals are widely used for numerous industrial applications and productions, e.g. electroplating, semiconductor and battery industries.1 Due to high toxicity and non-biodegradability, the waste streams seriously damage and disrupt the physiological processes of animals and plants.2 Even trace amounts in industrial effluents can lead to serious threats because of their high bioaccumulation property in the human body and food chain.3 Because of the high toxicity and detrimental effects on ecosystems and the health hazards, cadmium (Cd) is classed as one of the ‘‘Big Three’’ metals in the biosorption field.4 It can be accumulated in the body through the food chain. Long period accumulation of Cd can lead to a serious osteoporosis-like bone disease.2 Developing high-performance treatment technology especially adequate for aquatic environment has received significant attention for decades.5 Compared with the existing treatment technologies such as precipitation, membrane filtration and ion-exchange, absorption technique is being studied and applied widely since it has advantages of non-pollution, cost-effective and easy to operate.6,7Recently, using biomaterials for biosorption is widely recognized as a promising and environmentally benign technology for the treatment of waste streams containing heavy metals in real environmental applications, including microbial biomass, industrial wastes, agricultural wastes, natural residue and other biomass materials.7–9 Intractable and considerable concerns in biosorption are developing efficient, effective, and economic biomaterials biosorbents for industrial-scale applications.10 Studies revealed that various biomass materials such as fungi, bacteria, algae, rice straw, wheat bran and their derivatives have highly effective capacities on Cd adsorption.11–14 Among these bio-organisms and derivatives, the abundant and eco-friendly algal biomass has proved to have significant performance of heavy metals asdsorption.6 Especially, with increasing amount of lipid biodiesel production from microalgae which cultured using nutrient-rich wastewater, the algal biomass becomes more available.15 With the process of lipid extraction, large quantities of microalgal residue was generated. Due to microalgal residue contains abundant functional groups, this biowaste may be used as an effective biosorbent for heavy metal removal. Therefore, using lipid-extraction residue for heavy metal biosorption is a promising and valuable research area that simultaneously develop a kind of cost-effective biosorbent and enable the reuse of biowaste.
The purpose of this study was to investigate the properties of Cd adsorption by lipid extraction residue (LER). To further reduce the randomness of experimental results and ensure the feasibility of this new biosorbent, three different lipid-producting algal species were investigated simultaneously, and the adsorption capacity was compared with algal organisms collected in vigorous growth phase (VGP) and lipid accumulation phase (LAP). The microalgae was harvested from pure cultivation, firstly broke cell wall and extracted lipid by homogenizer crushing. The performances of biosorption were analyzed by kinetics experiments. And the changes of micro morphology were characterized through scanning electron microscope (SEM). Finally, Fourier transform infrared spectroscopy (FTIR) was utilized to analyze the functional groups responsible for adsorbing heavy metals to explain the interaction between Cd and binding sites.
2. Methods and materials
2.1 Preparation of biosorbent material
Three microalgae species CHA-01, TAI-03 and PTE-15 used in this study were isolated from freshwater in southern Taiwan and identified as Chlorella sp. CHA-01, Chlamydomonas sp. TAI-03, Coelastrum sp. PTE-15. The microalgae strains were grown on nitrogen-deficient BG-11 (ref. 16) (1/2N in BG-11 medium) for pre-culture and rapid lipid accumulation. The detailed composition of medium was shown in ESI.†The cultivation was conducted at 27 ± 1 °C for 7 days to harvest vigorous growth period algal organisms and 15 days to harvest lipid-accumulation algal biomass, under illumination by LED lamps at a light intensity of 200 μmol m−2 s−1, which was measured with a Li-250 Light Meter with a Li-200SA pyranometer sensor (Li-COR, Inc., Lincoln, Nebraska, USA). After cultivation, the microalgae was harvested by centrifugation (10![[thin space (1/6-em)]](https://www.rsc.org/images/entities/char_2009.gif) 000 rpm, 10 min) and washing with double-deionized water. Then the appropriate amount of algal biomass was freeze-dried by lyophilization (FDU-2100, EYELA Co., Japan) and ground to obtain uniform sized particles. The concentrated microalgae cells were quantified and re-suspended in double-deionized water. To harvest enough microalgal lipid residue for further biosorption experiments, high pressure homogenizer crushing method was adopted. The lipid extraction residue used for biosorption was disrupted via homogenizer (Sunway Scientific Co., Taiwan) at 4 °C. Due to the level of breaking difficulty, different pressure parameters were used. The algae Chlorella sp. CHA-01, Chlamydomonas sp. TAI-03 were disrupted at 20 Kpsi for two cycles, Coelastrum sp. PTE-15 was disrupted at 40 Kpsi for three cycles. Then the residue was centrifuged at 10000 rpm, washed several times with hexane and distilled water to remove lipid content, finally freeze-dried by lyophilization.
000 rpm, 10 min) and washing with double-deionized water. Then the appropriate amount of algal biomass was freeze-dried by lyophilization (FDU-2100, EYELA Co., Japan) and ground to obtain uniform sized particles. The concentrated microalgae cells were quantified and re-suspended in double-deionized water. To harvest enough microalgal lipid residue for further biosorption experiments, high pressure homogenizer crushing method was adopted. The lipid extraction residue used for biosorption was disrupted via homogenizer (Sunway Scientific Co., Taiwan) at 4 °C. Due to the level of breaking difficulty, different pressure parameters were used. The algae Chlorella sp. CHA-01, Chlamydomonas sp. TAI-03 were disrupted at 20 Kpsi for two cycles, Coelastrum sp. PTE-15 was disrupted at 40 Kpsi for three cycles. Then the residue was centrifuged at 10000 rpm, washed several times with hexane and distilled water to remove lipid content, finally freeze-dried by lyophilization.
2.2 Experimental design of adsorption procedure
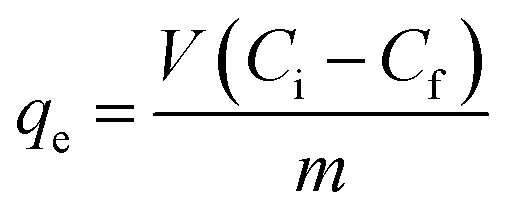
The measurement method of Cd concentration was the same as described by Chen et al.,17 using a Polarized Zeeman Atomic Absorption Spectrometer (AAS; Model Z-6100, Hitachi Co., Japan). The filtered samples (0.22 μm) were analysed by inductively coupled plasma-optical emission spectrometry (ICP-OES) (JY Ultima 2000, Horiba, Kyoto, Japan). Mass capacity of biosorption (qe) was calculated from the following equation:
 | (1) |
2.3 Data analysis
 | (2) |
 | (3) |
 | (4) |
 | (5) |
2.4 Measurement methods
Nitrate level was measured according to the OD220 using a UV/VIS spectrophotometer (model U-2001, Hitachi, Tokyo, Japan). Samples collected from medium were filtered through 0.22 um pore-size filter and diluted with deionized water.The lipid content was determined using gas chromatography as fatty acid methyl esters (FAMEs).18 After microalgae harvest by centrifugation, a gas chromatograph (GC-2014, Shimadzu, Kyoto, Japan) equipped with a flame ionization detector (FID) and a 100 m long capillary column (SPTM-2560 capillary GC column, Sigma-Aldrich, USA) was utilized for FAMEs analysis. The flow rate of carrier gas was 20 cm s−1, the injector and detector were both set at 260 °C. The column temperature was initially set at 140 °C for 5 min and programmed to 240 °C at 4 °C min−1, and held at 240 °C for 20 min. The contents of each FAMEs were determined accordingly by comparing to standard compounds.
2.5 Characterization of the adsorbents
The functional groups are the chemical groups of which participate in Cd2+ adsorption on the surface of microalgal cells. Qualitative analysis and identification of the main functional groups were conducted on a Jasco-680 (Japan) spectrometer at a resolution of 4 cm−1 through wavenumber range of 400–4000 cm−1. Vibration bands were reported as wavenumber (cm−1).The surface morphology and microstructure of microalgal biosorbent were observed using SEM. Before preparation of specimens for SEM observation, the dehydrated samples were dried and sputter coated with gold.
3. Results and discussion
3.1 Performance and kinetics of biosorption
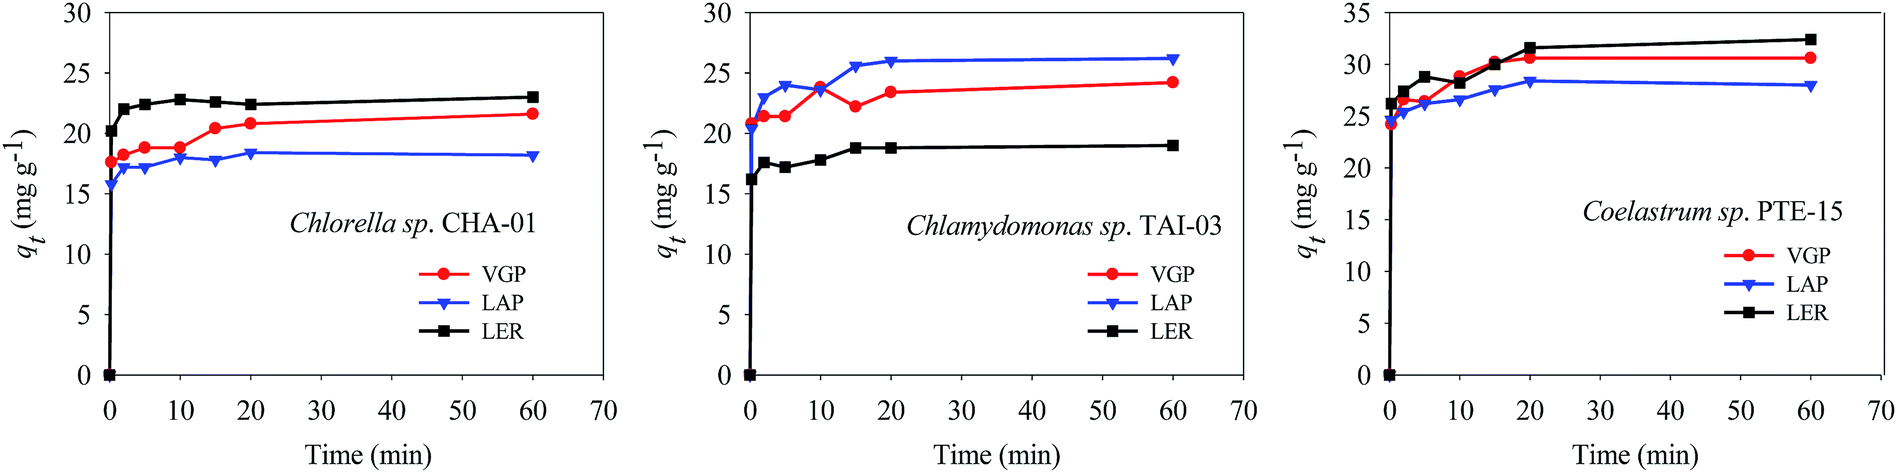 | ||
| Fig. 1 Time profile curves of the biosorption of Cd2+ by three microalgae. | ||
Two species in the case of lipid extraction residue have higher adsorption capability than the unbroken algae, suggesting that the components of intracellular cell wall can also play important roles in heavy metal binding.20 The biomass from strain of Coelastrum sp. PTE-15 exhibited the highest adsorption capacity. Cd2+ sorption on the cells of PTE-15 in VGP and LAP are 31.8 and 28.2 mg g−1 biomass, respectively. Especially the lipid extraction residue of PTE-15 has the highest sorption capability of 32.8 mg Cd2+ g−1 biomass. The results revealed that LER of Coelastrum sp. PTE-15 could be used as an effective biosorbent to remove Cd from aqueous solution.
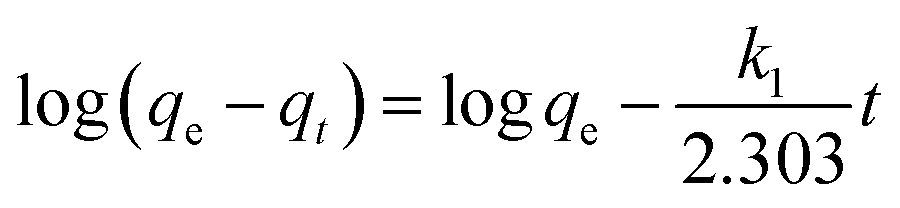
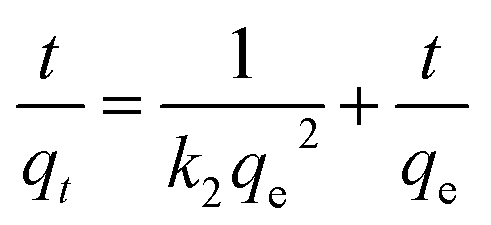
The parameters of these two kinetic models were calculated and summarized in Table 1. The results showed that pseudo-second-order adsorption kinetic model provided better fits than pseudo-first-order adsorption kinetic model. The adsorption by all microalgal absorbents in the whole time range followed the pseudo-second order equation with a highly linear correlation coefficient (R2 > 0.999). The theoretical maximum adsorption capacity inferred from pseudo-second order equation was closer to the detected experimental value. The pseudo-second order kinetic model is commonly used to describe adsorption kinetics under non-equilibrium conditions, which was based on the premise that the sorption rate was controlled by chemical sorption.13 This process of chemical sorption involves ion exchange or complex formation.21
| Adsorbent | qe,exp/(mg g−1) | Lagergren first order kinetics | Pseudo-second order kinetic equation | ||||
|---|---|---|---|---|---|---|---|
| qe cal/(mg g−1) | k1/min−1 | R2 | qe cal (mg g−1) | k2/(g mg−1 min−1) | R2 | ||
| CHA-01 (VGP) | 21.2 | 3.368 | 0.033 | 0.296 | 21.692 | 0.076 | 0.999 |
| TAI-03 (VGP) | 24.3 | 4.362 | 0.067 | 0.697 | 24.272 | 0.098 | 0.999 |
| PTE-15 (VGP) | 31.2 | 6.554 | 0.038 | 0.467 | 30.769 | 0.102 | 1 |
| CHA-01 (LAP) | 18.3 | 2.160 | 0.056 | 0.537 | 18.248 | 0.477 | 1 |
| TAI-03 (LAP) | 26.1 | 3.716 | 0.034 | 0.280 | 26.316 | 0.105 | 1 |
| PTE-15 (LAP) | 28.2 | 4.023 | 0.057 | 0.625 | 28.090 | 0.198 | 1 |
| CHA-01 (LER) | 22.9 | 1.132 | 0.017 | 0.042 | 22.989 | 0.305 | 1 |
| TAI-03 (LER) | 19.4 | 3.554 | 0.033 | 0.402 | 19.048 | 0.198 | 1 |
| PTE-15 (LER) | 32.6 | 7.858 | 0.056 | 0.737 | 32.573 | 0.051 | 0.999 |
Therefore, it could be presumed from these results that Cd2+ adsorption on microalgal biomass was controlled by valence forces as ion exchange until the surface active sites were occupied.
3.2 Characterization of the biosorbent and biosorption
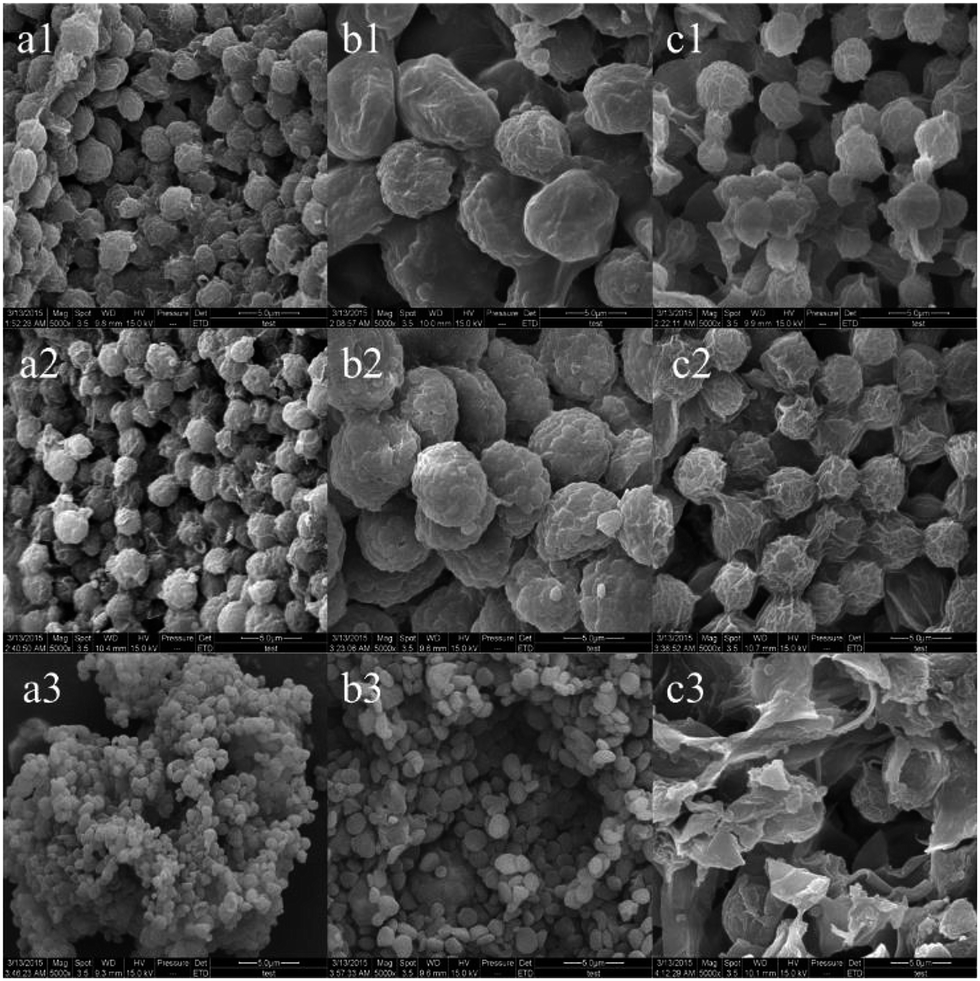 | ||
| Fig. 2 SEM micrographs of three microalgae strain CHA-01 (a1–a3: VGP, LAP, LER), TAI-03 (b1–b3: VGP, LAP, LER) and PTE-15 (c1–c3: VGP, LAP, LER). | ||
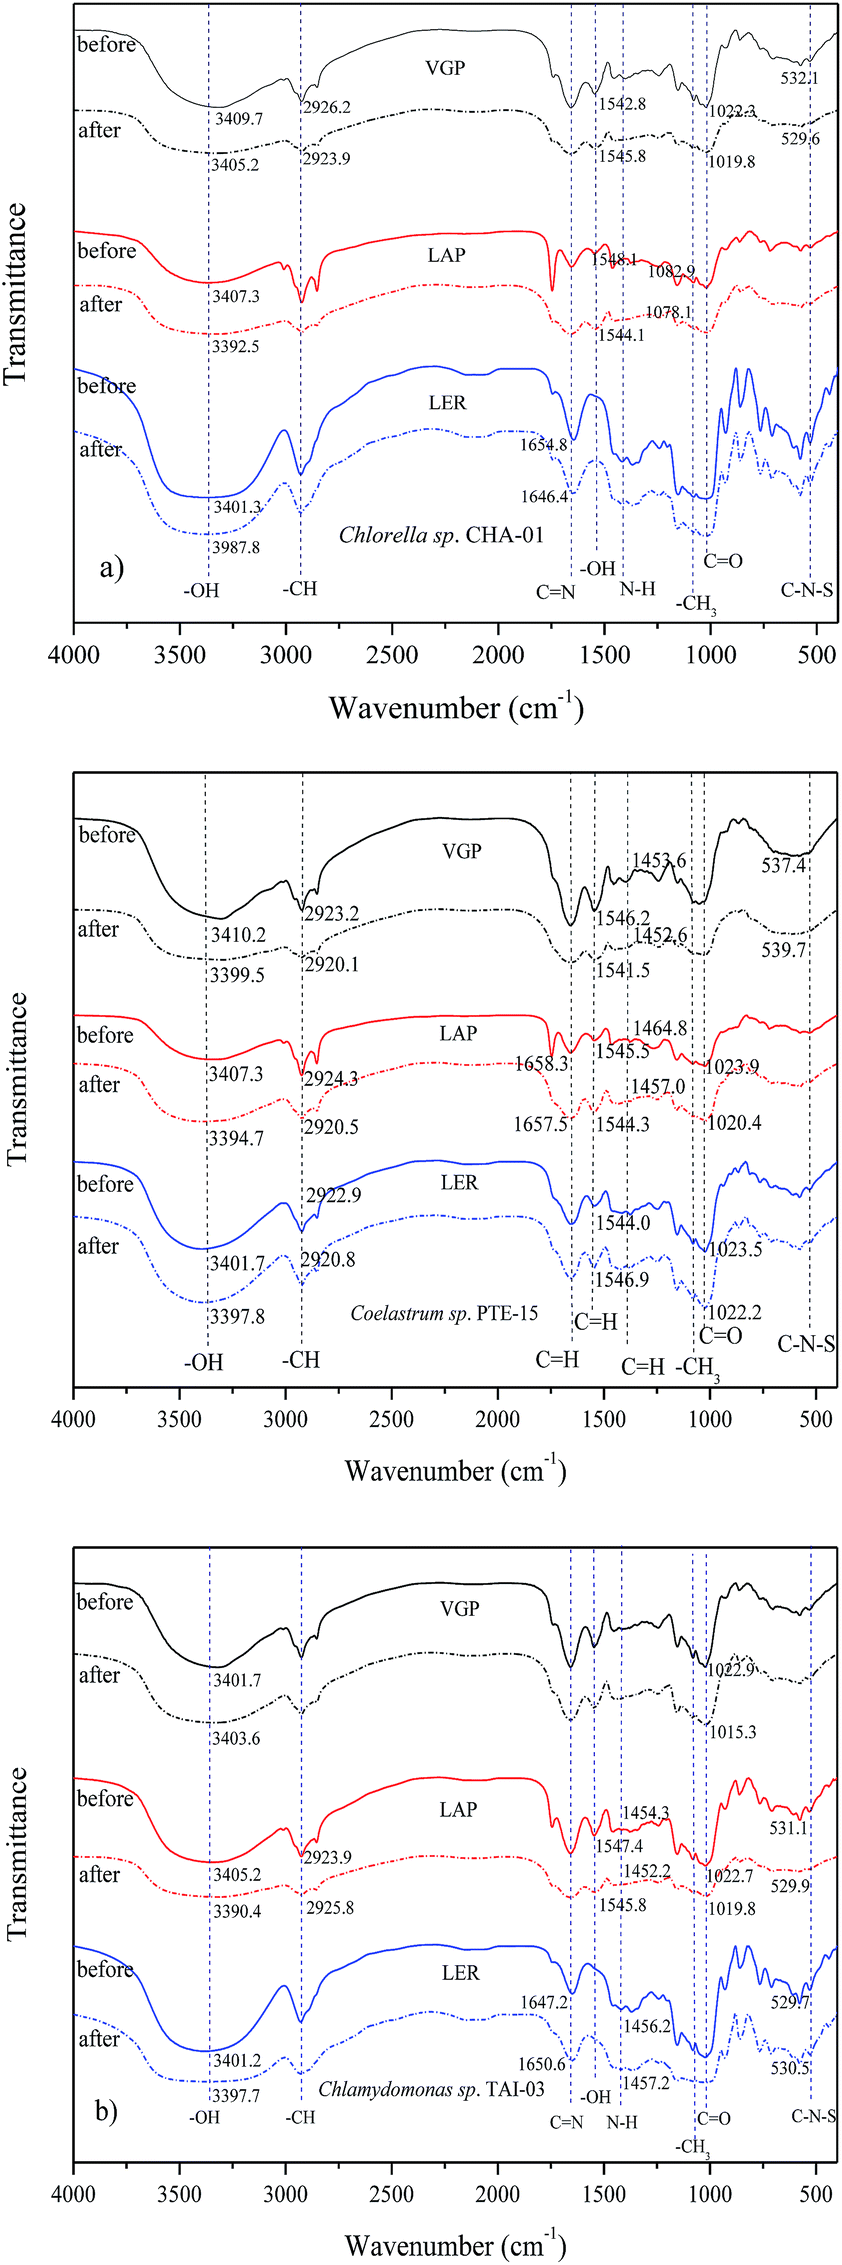 | ||
| Fig. 3 FTIR spectrum of microalgal biomass before and after Cd loading. | ||
The main shifts of functional groups detected in the absorption bands are hydroxyl, carboxylic acid, amine and amino. These groups are widely exist in algal structure.22 The peaks appear in the region 3402, 2925, 1652, 1538, 1452, 1028, 524 cm−1 represent –OH stretch, –CH stretch stretching vibration, C![[double bond, length as m-dash]](https://www.rsc.org/images/entities/char_e001.gif) N stretch, quinine –OH bounds, N–H bending, C–OH stretching vibrations and C–N–S scissoring.23 The shifts in the above peaks were also widely found in all biosorbents in this experiment, suggesting that the hydroxyl, carboxyl, amino and amine groups mainly act as the binding of Cd to microalgae. The adsorption proceed due to metal cations could be attracted by the negative charge of functional groups which located in the alginate of the microalgal cell wall.24 Some previous studies also indicated that biosorption process was accomplished by chelation and formation of ionic bridges between heavy metal and functional groups.25,26
N stretch, quinine –OH bounds, N–H bending, C–OH stretching vibrations and C–N–S scissoring.23 The shifts in the above peaks were also widely found in all biosorbents in this experiment, suggesting that the hydroxyl, carboxyl, amino and amine groups mainly act as the binding of Cd to microalgae. The adsorption proceed due to metal cations could be attracted by the negative charge of functional groups which located in the alginate of the microalgal cell wall.24 Some previous studies also indicated that biosorption process was accomplished by chelation and formation of ionic bridges between heavy metal and functional groups.25,26
3.3 Equilibrium modeling
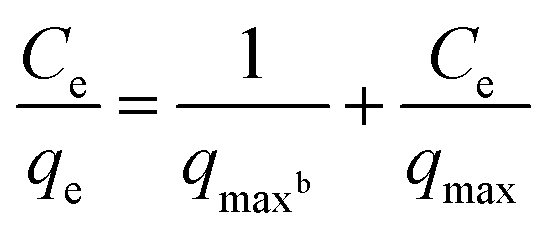
The adsorption isotherm is rather important for explaining the adsorption process at equilibrium conditions by describing the relationship between sorption capacity with equilibrium concentration.27 Besides, it can also express the mechanism of adsorption on a heterogeneous surface.21 The equilibrium data obtained from biosorption of Cd2+ onto different microalgal biomass were analyzed by using Langmuir and Freundlich isotherm models. The experimental results are presented in Fig. 4. The detailed parameters of Langmuir and Freundlich, such as correlation coefficient (R2) are presented in Table 2.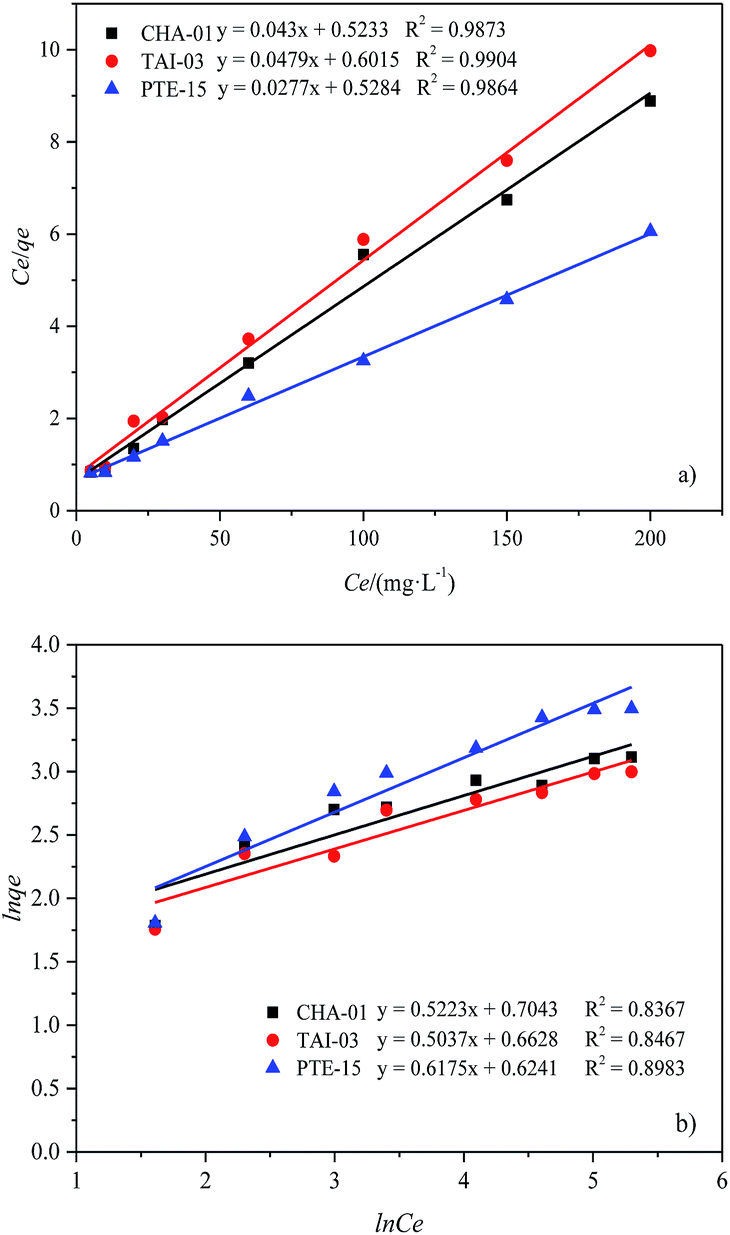 | ||
| Fig. 4 Langmuir (a) and Freundlich (b) isotherm plot and fitted models of Cd2+ biosorption by LER of the three microalgae stains. | ||
| Adsorbent | Langmuir | Freundlich | ||||
|---|---|---|---|---|---|---|
| qmax (mg g−1) | b (L mg−1) | R2 | k (L mg−1) | n | R2 | |
| CHA-01 | 25.510 | 0.240 | 0.995 | 2.018 | 1.832 | 0.847 |
| TAI-03 | 23.256 | 0.206 | 0.987 | 2.022 | 1.915 | 0.837 |
| PTE-15 | 36.101 | 0.178 | 0.986 | 1.867 | 1.619 | 0.898 |
As shown in Table 2, the R2 derived from the Langmuir equations are all greater than 0.98, indicating that the experimental results were fitted with the Langmuir isotherm model better than the Freundlich isotherm. The Freundlich isotherm is purely empirical based on sorption on heterogeneous surface.28 While the Langmuir isotherm model assumes that monolayer adsorption takes place at the specific homogeneous sites on a surface. It also assumes that no further adsorption can take place once the molecule of adsorbate occupies a site.29,30 The extremely high correlation coefficients of the linearized Langmuir model suggested that possibly the predominant sorption step in this sorption process is a single surface reaction with constant activation energy.31 For the Langmuir models, the maximal biosorption capacity of adsorbent (qmax) is a crucial indicator of the adsorption characteristic of algal adsorbent. The residue of PTE-15 had the highest Cd2+ adsorption capacity of 36.101 mg g−1, which can be used as an effective biosorbent for the removal of Cd.
3.4 Comparison of Cd2+ biosorption with different biosorbents
Table 3 presents the comparison of biosorption capacity of microalgal residue for Cd2+ ions with that of various biosorbents reported in literature.13,32–39 The biosorption capacity of microalgal residue for Cd2+ was found to be comparable and moderately higher than that of the majority of other biosorbents. The cost effective microalgal lipid extraction residue exhibited the potential for application in treatment of aqueous solutions containing Cd2+ ion.| Biosorbent | qmax (mg g−1) | Ref. |
|---|---|---|
| Green algae (Ulva lactuca) | 29.2 | 32 |
| Red algae (Ceramium virgatum) | 39.7 | 33 |
| Macro algae (Hypnea valentiae) | 17 | 34 |
| Algal waste (Gelidium) | 9.7 | 35 |
| Marine algae (Gelidium) | 18.0 | 35 |
| Fungus (Mucor rouxii) | 20.3 | 36 |
| Macrofungus (Lactarius scrobiculatus) | 53.1 | 37 |
| Fungal by-products (Botrytis cinerea) | 18.6 | 38 |
| Moss (Hylocomium splendens) | 32.5 | 39 |
| Rice straw | 13.9 | 13 |
| Algal residue (Coelastrum sp.) | 32.8 | Present study |
4. Conclusions
The experimental data were well described by the pseudo-second-order model and the Langmuir model for the adsorption experiments of kinetic modeling and biosorption isotherms, which revealed that ion exchange was the main biosorption mechanism. Abundant of homogeneous binding sites such as hydroxyl, carboxyl, amino and amine which involved in Cd adsorption were extensively existed in cell wall of Coelastrum sp. PTE-15. Due to intracellular components of cell wall released after homogenizer crushing and more binding sites could be contacted with Cd2+, lipid extraction residue sometimes exhibited higher biosoption capacity than microalgal organisms. Therefore, these results suggest that lipid extraction residue from strain of Coelastrum sp. PTE-15 has a promising application as a cost-effective biosorbent material for cleaning up aqueous solution and industrial wastewater contaminated with heavy metal Cd2+.Acknowledgements
This research was supported by the Harbin Institute of Technology Fund for young top-notch talent teachers (AUGA5710052514). The authors also gratefully acknowledge the financial support from the State Key Laboratory of Urban Water Resource and Environment (Grant no. 2014TS06), the Department of Education Fund for Doctoral Tutor (20122302110054) and the National Key Technology Support Program (2014BAD02B03).References
- J. Fan, T. Onal Okyay and D. Frigi Rodrigues, J. Hazard. Mater., 2014, 279, 236–243 CrossRef CAS PubMed
.
- Y. J. Tu, C. F. You and C. K. Chang, J. Hazard. Mater., 2012, 235–236, 116–122 CrossRef CAS PubMed
- J. Matusik and A. Wścisło, Appl. Clay Sci., 2014, 100, 50–59 CrossRef CAS
- B. Volesky, Water Res., 2007, 41, 4017–4029 CrossRef CAS PubMed
- M. I. Inyang, B. Gao, Y. Yao, Y. Xue, A. Zimmerman, A. Mosa, P. Pullammanappallil, Y. S. Ok and X. Cao, Crit. Rev. Environ. Sci. Technol., 2016, 46, 406–433 Search PubMed
- J. He and J. P. Chen, Bioresour. Technol., 2014, 160, 67–78 CrossRef CAS PubMed
- F. Googerdchian, A. Moheb and R. Emadi, Chem. Eng. J., 2012, 200, 471–479 CrossRef
- S. L. Guo, X. Q. Zhao, Y. Tang, C. Wan, M. A. Alam, S. H. Ho, F. W. Bai and J. S. Chang, J. Biotechnol., 2013, 163, 61–68 CrossRef CAS PubMed
- M. Fomina and G. M. Gadd, Bioresour. Technol., 2014, 160, 3–14 CrossRef CAS PubMed
- J. Wang and C. Chen, Biotechnol. Adv., 2009, 27, 195–226 CrossRef CAS PubMed
- D. Sud, G. Mahajan and M. P. Kaur, Bioresour. Technol., 2008, 99, 6017–6027 CrossRef CAS PubMed
- T. A. Davis, B. Volesky and A. Mucci, Water Res., 2003, 37, 4311–4330 CrossRef CAS PubMed
- Y. Ding, D. Jing, H. Gong, L. Zhou and X. Yang, Bioresour. Technol., 2012, 114, 20–25 CrossRef CAS PubMed
- Y.-F. Zhou and R. J. Haynes, Crit. Rev. Environ. Sci. Technol., 2010, 40, 909–977 CrossRef CAS
- C. Y. Chen, K. L. Yeh, R. Aisyah, D. J. Lee and J. S. Chang, Bioresour. Technol., 2011, 102, 71–81 CrossRef CAS PubMed
- R. Rippka, R. Y. Stanier, J. Deruelles, M. Herdman and J. B. Waterbury, Microbiology, 1979, 111, 1–61 Search PubMed
- C. Y. Chen, H. W. Chang, P. C. Kao, J. L. Pan and J. S. Chang, Bioresour. Technol., 2012, 105, 74–80 CrossRef CAS PubMed
- S. H. Ho, C. N. Chen, Y. Y. Lai, W. B. Lu and J. S. Chang, Bioresour. Technol., 2014, 163, 128–135 CrossRef CAS PubMed
- A. R. Khataee, F. Vafaei and M. Jannatkhah, Int. Biodeterior. Biodegrad., 2013, 83, 33–40 CrossRef CAS
- F.-C. A. Kafantaris and D. M. Borrok, Chem. Geol., 2014, 366, 42–51 CrossRef CAS
- U. A. Guler and M. Sarioglu, J. Environ. Chem. Eng., 2013, 1, 369–377 CrossRef CAS
- X. Han, Y. S. Wong, M. H. Wong and N. F. Tam, J. Hazard. Mater., 2007, 146, 65–72 CrossRef CAS PubMed
- V. K. Gupta and A. Rastogi, J. Hazard. Mater., 2008, 152, 407–414 CrossRef CAS PubMed
- M. Hashim, Chem. Eng. J., 2004, 97, 249–255 CrossRef CAS
- O. Raize, Y. Argaman and S. Yannai, Biotechnol. Bioeng., 2004, 87, 451–458 CrossRef CAS PubMed
- E. Fourest and B. Volesky, Environ. Sci. Technol., 1996, 30, 277–282 CrossRef CAS
- L. M. Peruchi, A. H. Fostier and S. Rath, Chemosphere, 2015, 119, 310–317 CrossRef CAS PubMed
- P. Figueira, C. B. Lopes, A. L. Daniel-da-Silva, E. Pereira, A. C. Duarte and T. Trindade, Water Res., 2011, 45, 5773–5784 CrossRef CAS PubMed
- H. Javadian, M. Ahmadi, M. Ghiasvand, S. Kahrizi and R. Katal, J. Taiwan Inst. Chem. Eng., 2013, 44, 977–989 CrossRef CAS
- W. Chen, L. Wang, M. Zhuo, Y. Liu, Y. Wang and Y. Li, J. Hazard. Mater., 2014, 279, 546–553 CrossRef CAS PubMed
- J. Wilson, J. Yoeza Naimani Philip and J. Epiphan Gabriel Mdoe, Open J. Org. Polym. Mater., 2014, 04, 29–36 CrossRef CAS
- A. Sari and M. Tuzen, J. Hazard. Mater., 2008, 152, 302–308 CrossRef CAS PubMed
- A. Sari and M. Tuzen, J. Hazard. Mater., 2008, 157, 448–454 CrossRef CAS PubMed
- A. Rathinam, B. Maharshi, S. K. Janardhanan, R. R. Jonnalagadda and B. U. Nair, Bioresour. Technol., 2010, 101, 1466–1470 CrossRef CAS PubMed
- V. J. Vilar, C. M. Botelho and R. A. Boaventura, Water Res., 2006, 40, 291–302 CrossRef CAS PubMed
- G. Yan and T. Viraraghavan, Water Res., 2003, 37, 4486–4496 CrossRef CAS PubMed
- R. A. Anayurt, A. Sari and M. Tuzen, Chem. Eng. J., 2009, 151, 255–261 CrossRef CAS
- T. Akar and S. Tunali, Miner. Eng., 2005, 18, 1099–1109 CrossRef CAS
- A. Sari, D. Mendil, M. Tuzen and M. Soylak, Chem. Eng. J., 2008, 144, 1–9 CrossRef CAS
Footnote |
| † Electronic supplementary information (ESI) available. See DOI: 10.1039/c5ra27264e |
| This journal is © The Royal Society of Chemistry 2016 |