
Effect of humic acid on the sulfamethazine adsorption by functionalized multi-walled carbon nanotubes in aqueous solution: mechanistic study†
Quanquan Yanga,
Xiaogang Lia,
Guangcai Chen*a,
Jianfeng Zhanga and
Baoshan Xingb
aResearch Institute of Subtropical Forestry, Chinese Academy of Forestry, Fuyang, Zhejiang 311400, China. E-mail: guangcaichen@sohu.com; Fax: +86-571-63141304; Tel: +86-571-63105079
bStockbridge School of Agriculture, University of Massachusetts, Amherst, MA 01003, USA
First published on 29th January 2016
Abstract
Adsorption of humic acid (HA) and its effect on sulfamethazine (SMZ) adsorption by three types of multi-walled carbon nanotubes (MWCNTs) were investigated. The adsorption isotherms of HA and SMZ were well depicted by the Langmuir model (R2 > 0.99). HA adsorption onto MWCNTs increased as pH decreased and ionic strength increased, and decreased with increasing surface oxygen content of MWCNTs, implying that electrostatic and hydrophobic interactions were the main adsorption mechanisms. The presence of HA inhibited SMZ adsorption onto MWCNTs via competitive interactions, molecular sieving, and pore blockage. HA adsorbed on the MWCNTs surfaces also altered the electrostatic and hydrophobic interactions between SMZ and MWCNTs, decreasing the adsorption of SMZ. The results of micro-Fourier transform infrared spectroscopy suggested that π–π and hydrogen-bonding interactions of MWCNTs with SMZ and HA, and/or between SMZ and HA also play an important role in the adsorption process. The current findings shed light on evaluating the potential utilization of MWCNTs in antibiotics removal or analysis.
1. Introduction
Antibiotics, an emerging group of environmental contaminant, are widely applied to prevent and treat disease in humans and farm animals. However, most of them are not totally absorbed and metabolized by humans or animals, and 50–90% are inevitably discharged into the environment via feces and urine.1,2 Sulfamethazine (SMZ), one of the major sulfonamide antibiotics, is widely used for treating infectious diseases and promoting the growth of farm animals. It is reported that SMZ concentrations in feedlot manure are up to 9990 μg kg−1 on a dry matter basis.2 SMZ and other sulfonamides reach up to 900 mg kg−1 in manure.3 SMZ residues are also widely detected in surface water,4 groundwater,5 and drinking water,6 with concentrations ranging from ng L−1 to μg L−1. It has been suggested that SMZ may be carcinogenic, as thyroid tumors developed in rats and mice fed with 2.4–4.8 ppm SMZ over 24 months.7 Therefore, continued research into the fate, distribution, biodegradation, and removal of SMZ is both important and necessary.Many technologies, such as chemical oxidation/reduction, adsorption, and biological treatment, have been used for the removal of toxic pollutants, and the adsorption is considered to be one of most effective methods because convenience, highly efficient, and ease of operation.8 Carbon nanotubes (CNTs) with a large specific surface area and pore volume8,9 which can serve as excellent adsorbent, enable CNTs the potential application in contaminants removal or analysis.10,11
Previous researches have investigated the adsorption of antibiotics onto CNTs and revealed various adsorption mechanisms. For example, hydrophobic interactions and non-electrostatic π–π dispersion interactions are the main adsorption mechanisms responsible for the adsorption of tetracycline by CNTs.12 However, electrostatic interactions play a key role in the adsorption of ciprofloxacin and norfloxacin onto CNTs.19,20 The adsorption of ciprofloxacin onto four types of CNTs increased as the pH increased from 0 to 7, then decreased as the pH increased from 7 to 14.13 Norfloxacin adsorption onto CNTs showed a similar trend with increasing pH,14 which was ascribed to changes in the electrostatic interactions between CNTs and contaminants due to the increase in pH. In general, antibiotics have multiple pKa values and can exist as positive, zwitterionic, and negative species depending on solution pH. The contribution of different species to adsorption follows the order zwitterionic > positive > negative.15 Zhang et al. calculated that neutral sulfamethoxazole contributes >80% to the overall adsorption.16 Furthermore, adsorption of sulfamethoxazole onto CNTs is controlled by various mechanisms, including hydrophobic interactions, electrostatic interactions, hydrogen bonds, and π–π interactions.16–18 Previous studies have shown that coexisting cations and anions also affect the adsorption of antibiotics by CNTs.17,19
Despite the great potential application, the toxicity of CNTs to organisms and their risks to environment raised lots of attention,20–22 which must be considered before using CNTs in contaminant adsorption or removal. Several pretreatment methods for CNTs are believed to be effective in alleviating or even avoiding the toxicity of CNTs. Purification of CNTs can reduce the cytotoxicity through releasing the metallic impurities containing in CNTs which are toxic to cell.23 Surface functionalization with carboxylic acid (–COOH) or ammonium can reduce the toxicity although increasing the biocompatibility and dispersibility of CNTs.24 It was observed that functionalized CNTs even shown no toxicity in vitro to cells and in vivo in mice.25 Natural organic matter (NOM) is suggested to reduce the toxicity of CNTs to bacteria through coating,26 or show no toxicity to Daphnia magna through stabilizing the CNTs in solution.27 Thus, understanding the interaction between NOM and CNTs is essential for reducing or avoiding toxicity of CNTs while using them for toxicants removal. In addition, the presence of NOM can also affect the adsorption of contaminant by CNTs.
However, research on the effect of natural organic matter (NOM) on the adsorption of antibiotics onto CNTs is limited. NOM is ubiquitous in the environment, and antibiotic is an emerging group of environmental contaminant; they can coexist in both water and soil environments. Understanding the effect of NOM on the adsorption of antibiotics by CNTs is crucial for assessing the fate of antibiotics in the environment. In general, competitive interactions and pore blockage are considered to be the two major mechanisms by which NOM inhibits the adsorption of organic contaminants by CNTs.28,29 Although the presence of NOM could increase the total adsorption sites on CNT surfaces owing to better dispersion of CNTs, adsorption reduces significantly because of a decrease in the number of available sites for contaminants due to competition and blockage.30 Furthermore, humic acid (HA) adsorbed onto CNT surfaces introduces polar moieties and lowers the point of zero charge, which decreases adsorption via hydrophobicity and electrostatic interactions.29,31 Therefore, it is important to examine the effect of NOM on the interface interactions between antibiotics and CNTs in solution.
In this study, we selected HA and SMZ as the model NOM and antibiotic, respectively. Three multi-walled carbon nanotubes (MWCNTs) with different surface oxygen contents were chosen as the adsorbents. The objectives of this study were to: (i) examine the effect of solution pH and ionic strength on the adsorption of HA by MWCNTs; (ii) elucidate the effect of HA on the adsorption of SMZ by MWCNTs; and (iii) provide spectroscopic evidence of the adsorption mechanisms using micro-Fourier transform infrared (μ-FTIR) spectroscopy.
2. Materials and methods
2.1. Materials
The three adsorbents were pristine, carboxylated, and hydroxylated MWCNTs (P-MWCNT, C-MWCNT, and H-MWCNT) with outer diameters of 10–20 nm. The MWCNTs were synthesized by chemical vapor deposition of methane in hydrogen at 700 °C using Ni as the catalyst (Chengdu Organic Chemistry Co. Ltd, Chinese Academy of Sciences). The surface carbon and oxygen elemental composition of the MWCNTs was determined by X-ray photoelectron spectroscopy (Thermo ESCALAB 250Xi, UK). The zeta potential versus solution pH was recorded using a zeta potential analyzer (Nano-Z, Malvern Instruments, UK). The μ-FTIR spectroscopic spectra of the three MWCNTs were measured using a FTIR spectrophotometer (Nicolet 6700, Thermo Nicolet).SMZ (purity > 99%) and HA were purchased from Sigma-Aldrich Trading Co. Ltd (Shanghai, China). The molecular structure and physicochemical properties of SMZ are listed in Table S1.† Elemental composition and relative carbon contributions of HA are presented in Table S2.† All other chemicals and solvents were of analytical reagent grade or better.
2.2. Adsorption experiments
All experiments were carried out in 40 mL glass vials sealed with Teflon-lined screw caps. The vials were filled with 5 mg of MWCNTs and 25 mL of background solution containing 0.02 M NaNO3 and 200 mg L−1 NaN3. The reaction solutions with various SMZ and HA concentrations were suspended in a shaker (HZQ-F160, Huamei Biochemistry Instrument, Soochow) with a rotation speed of 150 rpm at 298 K in the dark. According to preliminary adsorption kinetics experiments, the adsorption reached equilibrium within 72 h (Fig. S1†). The suspension solutions were filtered using a 0.45 μm hydrophilic membrane and the SMZ and HA concentrations in the supernatants were determined. Each treatment was carried out in triplicate.2.3. Analysis
Supernatants were centrifuged for 10 min at 1000g and then filtered through a 0.45 μm hydrophilic membrane before HA or SMZ concentration determination. HA has both hydrophilic and hydrophobic moieties owing to its complex structure and wide range of molecular weight.32 HA with different structures usually selectively adsorb onto CNTs,33 which may make the single-wavelength method inaccurate for the determination of HA concentration in equilibrium solution. To eliminate this possible inaccuracy, the HA absorbance spectrum in the initial (equilibrium) solution was obtained using a 1800 PC ultraviolet-visible (UV) spectrophotometer (Shanghai Mapada Instrument Co. Ltd). The results showed no difference in the HA adsorption peak before and after adsorption (Fig. S3†). HA concentrations in the range 4 to 40 mg L−1 linearly correlated with UV absorbance (R2 > 0.99; Fig. S4†) at 254 nm in a 1 cm quartz cell.34 This indicated that using a spectrophotometer at 254 nm was reliable for determining HA concentration.The SMZ concentration in the supernatants was determined using HPLC equipped with a Waters 484 UV detector at 263 nm and a reverse-phase C18 column (Waters, 5 μm, 3.9 mm × 150 mm). The mobile phase was methanol and water with a volume ratio of 70![[thin space (1/6-em)]](https://www.rsc.org/images/entities/char_2009.gif) :30. The injection volume was 30 μL and the flow rate was 1 mL min−1. The retention time was 1.5 min.
:30. The injection volume was 30 μL and the flow rate was 1 mL min−1. The retention time was 1.5 min.
2.4. Data analysis
The equilibrium adsorption data for HA and SMZ fitted the Langmuir (eqn (1)) and Freundlich (eqn (2)) models:
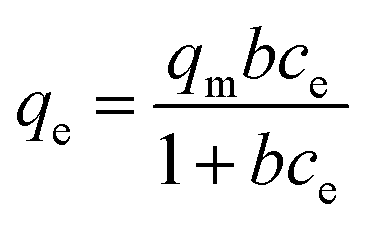 | (1) |
| Qe = kFce1/n | (2) |
3. Results and discussion
3.1. Characterization of MWCNTs
The specific surface areas of P-MWCNT, C-MWCNT, and H-MWCNT were similar due to the same outer diameter (Table S3,†).35 The C 1s (∼294–282 eV) and O 1s (∼537–528 eV) peaks of the MWCNTs deconvoluted from X-ray photoelectron spectroscopy data revealed the functional groups (Fig. 1). The three MWCNTs showed the same main peaks at 284.4 and 285.5 eV assigned to sp2 C![[double bond, length as m-dash]](https://www.rsc.org/images/entities/char_e001.gif) C (attributed to the graphitic structure) and sp3 C–C (attributed to defects in the nanotube structure), respectively.36 Small peaks for O–COO (290.9 eV) and CO (288.2 eV) were attributed to carbon atoms attached to different oxygen-containing moieties.37 For O 1s, the peaks at 533.6 eV were C–O–C, C–O–OH, and C–OH; the peaks at 532.5 eV were CO and O–CO; the peaks at 531.3 eV were isolated –OH, CO, and O–CO; the peaks at 530.7 eV were physically adsorbed O or carbonates.36
C (attributed to the graphitic structure) and sp3 C–C (attributed to defects in the nanotube structure), respectively.36 Small peaks for O–COO (290.9 eV) and CO (288.2 eV) were attributed to carbon atoms attached to different oxygen-containing moieties.37 For O 1s, the peaks at 533.6 eV were C–O–C, C–O–OH, and C–OH; the peaks at 532.5 eV were CO and O–CO; the peaks at 531.3 eV were isolated –OH, CO, and O–CO; the peaks at 530.7 eV were physically adsorbed O or carbonates.36
 | ||
| Fig. 1 The C 1s and O 1s X-ray photoelectron spectroscopy spectra of P-MWCNT, C-MWCNT, and H-MWCNT. | ||
The μ-FTIR spectra also confirmed the different oxygen functional groups (Fig. S5†). The peaks at 1192 cm−1 and 1027 cm−1 (P-MWCNT), 1200 cm−1 and 1064 cm−1 (C-MWCNT), and 1207 cm−1 and 1062 cm−1 (H-MWCNT) were assigned to the C–O stretching vibration.35,38,39 The peaks at 1706 cm−1 (C-MWCNT) and 1705 cm−1 (H-MWCNT) were assigned to the CO stretching vibration of COOH. The peaks in the region ∼3820–3420 cm−1 corresponded to OH groups (Fig. S5†). These oxygen-containing functional groups are hydrophilic, and thus decrease the hydrophobicity of the MWCNT surface.
The zeta potential of the MWCNTs decreased with increasing solution pH from 1 to 13 (Fig. S6†). The point of zero charge of P-MWCNT, C-MWCNT, and H-MWCNT was 1.7, 2.5, and 4.5, respectively. The zeta potential also reduced with increasing surface oxygen content at the same solution pH, which was ascribed to deprotonation of carboxylic groups, making the MWCNT surface more negatively charged.35
3.2. Adsorption of HA onto MWCNT
The HA adsorption isotherms of the three different MWCNTs fitted the Langmuir and Freundlich models (Fig. 2a, Table 1). The Langmuir model fitted the adsorption data better than the Freundlich model with a higher R2 value (Table 1). The maximum HA adsorption capacities of the three MWCNTs followed the order: P-MWCNT > C-MWCNT > H-MWCNT (Table 1), which suggests that an increase in surface oxygen content decreases the adsorption of HA onto MWCNTs (Table S2†). Previous studies have shown that π–π, hydrophobic, and electrostatic interactions are the predominant mechanisms for the adsorption of organic matter.34,40 As the number of hydrophilic oxygen-containing functional groups increases, the aromatic content of MWCNTs decreased, which could weaken the π–π interactions between HA and MWCNTs.41 These functional groups create a polar region, and reduce the hydrophobicity of the MWCNT surface,20 which could decrease the HA adsorption by MWCNTs. In addition, HA contains many functional groups that are easily negatively charged, and MWCNTs with high oxygen content are more negatively charged, making adsorption more difficult due to electrostatic repulsion between HA and the negatively charged MWCNT surface.41 | ||
| Fig. 2 Adsorption of HA by P-MWCNT (□), C-MWCNT (○), and H-MWCNT (Δ). (a) Adsorption isotherms (temperature: 298 K; initial pH: 7.0 ± 0.1). The solid line is the Freundlich model isotherm and the dotted line is the Langmuir model isotherm. (b) Effect of pH on adsorption (initial HA concentrations 40 mg L−1; temperature: 298 K). | ||
| Carbons | Langmuir | Freundlich | ||||
|---|---|---|---|---|---|---|
| qmaxa | ba | R2 | kFa | n−1 | R2 | |
| a qmax: mg g−1; b: L mg−1; kF: (mg(1−(1/n)) g−1 L(1/n)). | ||||||
| P-MWCNT | 171.6 ± 3.6 | 0.170 ± 0.014 | 0.995 | 19.2 ± 4.2 | 0.430 ± 0.053 | 0.943 |
| C-MWCNT | 152.8 ± 1.4 | 0.192 ± 0.007 | 0.998 | 16.2 ± 3.2 | 0.457 ± 0.048 | 0.959 |
| H-MWCNT | 135.5 ± 2.6 | 0.118 ± 0.008 | 0.996 | 15.4 ± 2.4 | 0.444 ± 0.039 | 0.971 |
The HA adsorption steeply decreased as solution pH increased (Fig. 2b). Generally, solution pH is an important factor affecting the adsorption of HA by CNTs, which can affect the interaction between functional groups of CNTs and HA, and the humic acids molecules structure.42,43 HA has negative charges under the solution pH of experimental conditions.10,44 The surface of the MWCNTs positively charged at low solution pH, but negatively charged at high solution pH (Fig. S6†). Thus, the adsorption of HA onto the MWCNTs occurred easily at low pH through electrostatic attractions, and then became difficult due to the electrostatic repulsion between the negative charges of MWCNTs and HA at high pH.45 In addition, at high solution pH, the deprotonation of acidic functional groups in HA, such as carboxyl and phenolic groups, could increase the hydrophilicity, which may suppress adsorption of HA by MWCNTs through hydrophobic interactions.46 Hydrogen-bonding interactions between HA and MWCNTs, which was confirmed by the μ-FTIR spectra (Section 3.4), decreased with increasing solution pH. As pH increases, HA molecules become less coiled and less compact because of electrostatic repulsions,47 resulting in HA occupying more sites on MWCNT surface. Therefore, the effect of solution pH on the adsorption process was the result of a combination of aforementioned mechanisms.
As the ionic strength increased from 0.01 to 0.1 M, the HA adsorption increased by 15–20%, 22–53%, and 43–96% for P-MWCNT, C-MWCNT, and H-MWCNT, respectively (Fig. 3). This implies that electrostatic interactions were the main adsorption mechanism. An increase in ionic strength can screen the surface charge of MWCNTs,48 thus reducing the electrostatic repulsion between the MWCNTs and HA and increasing the adsorption of HA onto the MWCNTs. The increase was strongly and positively correlated with the oxygen content of the MWCNTs due to the larger charge screening effects on these MWCNTs with higher oxygen content. The ionic strength can also alter macromolecular configurations of HA, which in turn affects the adsorption of HA onto MWCNTs. The molecular configurations of HA became more coiled and compact with increasing ionic strength,44,49 leading to more HA molecules occupying the same surface sites of MWCNTs.50 At higher ionic strengths, the double layer compression of MWCNT–HA agglomerates can be enhanced, and the adsorption capacity also increases.33
 | ||
| Fig. 3 Effect of ionic strength (initial pH: 7.0 ± 0.1; temperature: 298 K). (a) Adsorption of HA by P-MWCNT (□ ■), C-MWCNT (○●), and H-MWCNT (Δ ▲) at ionic strengths of 0.01 (□ ○ Δ) and 0.1 M (■ ● ▲) NaNO3. (b) Ratio of adsorption capacity of 0.1 M and 0.01 M NaNO3. | ||
The results suggested that MWCNTs surface oxygen contents and solution properties (pH and ionic strength) can affect the adsorption process of both HA and SMZ onto MWCNTs. The main mechanisms were ascribed to the hydrophobic and electrostatic interactions which dominated the adsorption behavior. The hydrophobic interaction decreased with the increase of surface oxygen contents due to the introduction of O-containing functional group in MWCNTs surface. The electrostatic interactions between MWCNTs and HA/SMZ were affected by the ionization level of functional groups of MWCNTs, HA, and SMZ, which was dependent on solution pH. Salt ions can also affect the electrostatic interaction between MWCNTs and HA/SMZ through the charge shielding effect.
3.3. Effect of HA on the adsorption of SMZ onto MWCNTs
The effect of HA on the adsorption of SMZ onto MWCNTs was investigated (Fig. 4, Table 2). The adsorption of SMZ was nonlinear and fitted the Langmuir model well (R2 > 0.99). The presence of HA suppressed the adsorption of SMZ onto the MWCNTs, and the degree of inhibition increased with increasing HA concentration (Fig. 4). The SMZ adsorption onto the three MWCNTs decreased by 8.3–11.9% at 10 mg L−1 HA, and 13.8–19.4% at 30 mg L−1 HA. This result can be explained by the direct competition for adsorption sites between HA and SMZ,28 which made the adsorption of SMZ onto the MWCNT surface more difficult. Fig. S7a† shown that 68.3–61.5% HA was precipitated by 5 mM Ca2+, and recovery percentage of SMZ (Fig. S7b†) suggests that the adsorption of SMZ onto HA was small and can be ignored in this study, indicating that SMZ is directly adsorbed onto the surface of MWCNTs.51 In addition, HA adsorbed onto MWCNTs increases the negative charge density on the surface of MWCNTs,25 increasing the electrostatic repulsion between SMZ and HA-coated MWCNTs, thus decreasing SMZ adsorption. Molecular sieving and pore blockage caused by HA can also suppress SMZ adsorption.52 HA can improve the dispersion of MWCNTs, leading to the formation of a stable MWCNT suspension in aqueous solution.46,53 However, the suspension of MWCNTs is largely based on continuing sonication. In this study, HA may not have increased the number of available adsorption sites on the MWCNT surfaces for SMZ due to the lack of sonication.28 On the other hand, the increase in the number of available adsorption sites could have been offset by the adsorption of HA. In sum, the addition of HA reduced the adsorption of SMZ onto the MWCNTs in this study. | ||
| Fig. 4 Adsorption isotherms of SMZ without and with HA for P-MWCNT (a), C-MWCNT (b), and H-MWCNT (c) (temperature: 298 K; initial pH: 7.0 ± 0.1). The solid line is the Freundlich model isotherm and the dotted line is the Langmuir model isotherm. | ||
| Carbons | Batcha | Langmuir | Freundlich | ||||
|---|---|---|---|---|---|---|---|
| qmaxb | bb | R2 | kFb | n−1 | R2 | ||
| a Batch A, B and C indicated without HA, with 10 mg L−1 HA and with 30 mg L−1 HA, respective.b qmax: mg g−1; b: L mg−1; kF: (mg(1−(1/n)) g−1 L(1/n)). | |||||||
| P-MWCNT | A | 61.6 ± 0.9 | 0.138 ± 0.009 | 0.997 | 15.50 ± 2.29 | 0.311 ± 0.039 | 0.941 |
| B | 56.5 ± 1.6 | 0.062 ± 0.006 | 0.994 | 8.39 ± 1.15 | 0.405 ± 0.035 | 0.973 | |
| C | 53.1 ± 1.0 | 0.046 ± 0.002 | 0.998 | 5.97 ± 1.01 | 0.453 ± 0.043 | 0.968 | |
| C-MWCNT | A | 52.2 ± 0.7 | 0.154 ± 0.009 | 0.997 | 14.18 ± 2.13 | 0.295 ± 0.040 | 0.933 |
| B | 46.0 ± 0.5 | 0.110 ± 0.004 | 0.999 | 10.29 ± 1.69 | 0.331 ± 0.043 | 0.937 | |
| C | 42.1 ± 0.7 | 0.068 ± 0.004 | 0.998 | 6.63 ± 1.05 | 0.394 ± 0.040 | 0.961 | |
| H-MWCNT | A | 34.7 ± 0.7 | 0.122 ± 0.010 | 0.993 | 8.53 ± 1.11 | 0.311 ± 0.033 | 0.953 |
| B | 30.6 ± 1.0 | 0.062 ± 0.006 | 0.992 | 4.74 ± 0.86 | 0.392 ± 0.033 | 0.948 | |
| C | 27.0 ± 0.6 | 0.050 ± 0.003 | 0.997 | 3.39 ± 0.52 | 0.431 ± 0.038 | 0.971 | |
Solubilization effects may reduce SMZ adsorption onto CNTs by increasing the mobility and desorption of chemicals from CNTs, and always act simultaneously with competition effects.54 To explore the contribution of solubilization in the present study, the solubility of SMZ at pH 2 to 11 was also examined. Fig. 5 shows that the solubility of SMZ decreased with increasing solution pH, reaching a minimum value at pH 6, and then increased with increasing solution pH. The fluctuation range of SMZ solubility in the presence of 10 and 30 mg L−1 HA was <0.05 compared with that in background solution, which implied that solubilization effects were insignificant (Fig. S8†).
 | ||
| Fig. 5 SMZ solubility as a function of solution pH in the absence and presence of HA at 10 and 30 mg L−1. | ||
The effect of HA concentration on the adsorption of SMZ onto MWCNTs at different pHs was investigated (Fig. 6). In the presence of HA, SMZ adsorption was inhibited at low solution pH, while adsorption was enhanced at pH > 9. The suppression effect increased with increasing HA concentration in solution. SMZ, an ionizable compound, has two pKa values of 2.28 and 7.42 (Table S2†). The speciation of SMZ depended on solution pH (Fig. S9†).55,56 Previous studies have found that electrostatic interactions also depend strongly on solution pH,40 while π–π interactions are independent of solution pH.57 Our previous study suggested that SMZ adsorption onto MWCNTs is governed by electrostatic and π–π interactions.19
 | ||
| Fig. 6 Adsorption of SMZ onto P-MWCNT (a), C-MWCNT (b), and H-MWCNT (c) as a function of pH in the absence and presence of HA at 10 and 30 mg L−1 (initial concentration of SMZ 20 mg L−1; temperature: 298 K). | ||
At low solution pH, the adsorption of SMZ onto MWCNTs was high; however, the electrostatic repulsions and competitive interactions increased with the addition of HA, suppressing SMZ adsorption onto the MWCNTs. At solution pH > 9, HA has high solubility and high mobility, which weaken the competition effect. And at this pH region, the SMZ adsorption was inherently lower. SMZ is negatively charged, and adsorption is accompanied by proton exchange, a major driving force is strong negative charge-assisted H-bonding [(−)CAHB interaction between SMZ and acidic surface groups of MWCNTs.58,59 Humic acid molecules containing acid functional groups,29 which may enhance the H-bonding interaction, promote the adsorption of SMZ onto the MWCNTs. Considering the significantly different effects of HA on the SMZ adsorption by MWCNTs at different solution pH, more attention should be paid to solution chemistry during SMZ removal or analysis by MWCNTs.
3.4. μ-FTIR analysis
The μ-FTIR spectra of the MWCNTs, MWCNT–SMZ, MWCNT–HA, and MWCNT–SMZ–HA were recorded to reveal the mechanisms of SMZ and HA adsorption onto the MWCNTs (Fig. 7). Some additional peaks appeared at ∼1640–1580 cm−1 in the MWCNT–SMZ spectrum (Fig. 7b) compared with the free MWCNTs (Fig. 7a). The peaks at 1636 cm−1, 1630 cm−1, and 1635 cm−1 were assigned to the CN stretching vibration of SMZ,60 indicating that the SMZ was adsorbed onto the MWCNT surface. After SMZ was adsorbed onto the MWCNTs, the peaks corresponding to the CC stretching vibration and the C–C skeletal vibration of the benzene ring shifted from 1514 cm−1 and 1392 cm−1 to 1509 cm−1 and 1390 cm−1 for P-MWCNT, from 1506 cm−1 and 1387 cm−1 to 1510 cm−1 and 1389 cm−1 for C-MWCNT, and from 1552 cm−1 and 1382 cm−1 to 1527 cm−1 and 1394 cm−1 for H-MWCNT, respectively.61 The MWCNT–HA spectrum (Fig. 7c) showed that the CC and C–C vibrations of the benzene ring have a similar shift after the adsorption of HA: the CC stretching vibration shifted from 1514 cm−1 to 1553 cm−1 for P-MWCNT, from 1506 cm−1 to 1557 cm−1 for C-MWCNT, and from 1552 cm−1 to 1562 cm−1 for H-MWCNT; and the C–C skeletal vibration shifted from 1392 cm−1 to 1365 cm−1, from 1387 cm−1 to 1384 cm−1, and from 1382 cm−1 to 1380 cm−1 for P-MWCNT, C-MWCNT, and H-MWCNT, respectively. All of these shifts suggest that π–π interactions play an important role in the adsorption of SMZ and HA onto MWCNTs.62 The MWCNT–SMZ–HA spectrum (Fig. 7d) showed that the co-adsorption of SMZ and HA onto the MWCNTs induced more significant changes in the μ-FTIR spectrum of MWCNTs.
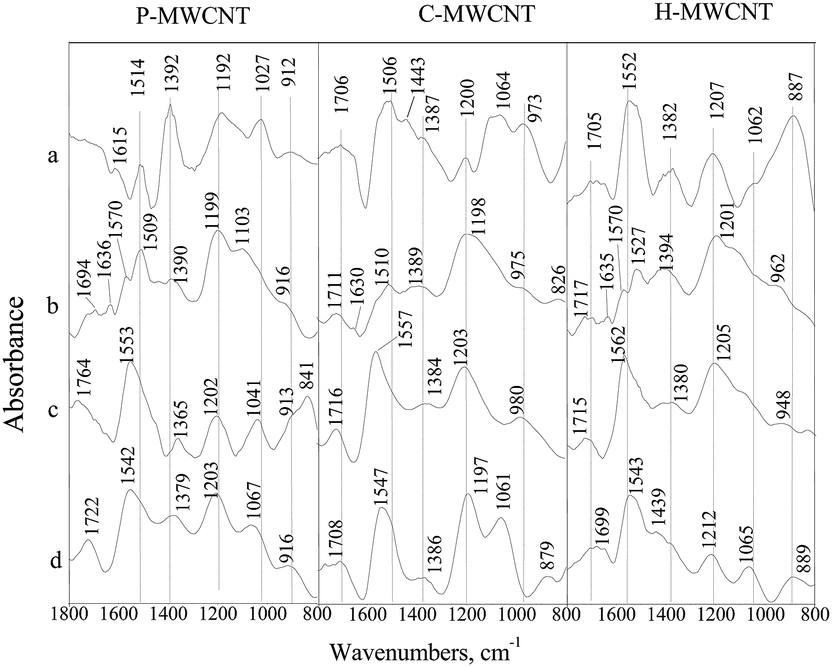 | ||
| Fig. 7 The μ-FTIR spectra of MWCNTs (a), SMZ adsorbed onto MWCNTs (b), HA adsorbed onto MWCNTs (c), and SMZ–HA complexes on MWCNTs (d). | ||
For P-MWCNT, the C–O stretching vibration peak at 1192 cm−1 was shifted to 1199 cm−1 (MWCNT–SMZ), 1202 cm−1 (MWCNT–HA), and 1203 cm−1 (MWCNT–SMZ–HA), which can be attributed to the interactions between C–O and the benzene ring. For C-MWCNT, the CO stretching vibrations peak at 1706 cm−1 and the C–O stretching vibration peak at 1200 cm−1 were shifted to 1711 cm−1 and 1198 cm−1 (MWCNT–SMZ), 1716 cm−1 and 1203 cm−1 (MWCNT–HA), and 1708 cm−1 and 1197 cm−1 (MWCNT–SMZ–HA), respectively. For H-MWCNT, the stretching vibrations of CO and C–O were shifted from 1705 cm−1 and 1207 cm−1 to 1717 cm−1 and 1201 cm−1 (MWCNT–SMZ), 1715 cm−1 and 1205 cm−1 (MWCNT–HA), and 1699 cm−1 and 1212 cm−1 (MWCNT–SMZ–HA), respectively. All of these band shifts verify that SMZ, HA, and SMZ and HA were partly adsorbed onto the MWCNTs by hydrogen bonding via the CO or –COO– groups.39
4. Conclusion
The adsorption of SMZ and HA onto MWCNTs decreased as the surface oxygen content increased, due to weakening of the π–π and hydrophobic interactions of MWCNTs with SMZ or HA. The HA adsorption onto MWCNTs also depended on solution pH and ionic strength, suggesting that electrostatic interactions play a key role in the adsorption of HA onto MWCNTs. This work confirmed that the presence of HA suppresses SMZ adsorption onto MWCNTs at a wide pH range, which can be ascribed to competitive interactions, molecular sieving, and pore blockage. The μ-FTIR spectra validated that π–π and hydrogen-bonding interactions are the main mechanisms for the adsorption of SMZ and HA onto MWCNTs. The current findings shed light on evaluating the potential utilization of MWCNTs in antibiotics removal or analysis.Acknowledgements
This work was funded by the National natural Science Foundation of China (21207157), and USDA-AFRI Hatch program (MAS 00475).References
- S. T. Kurwadkar, C. D. Adams, M. T. Meyer and D. W. Kolpin, J. Agric. Food Chem., 2007, 55, 1370 CrossRef CAS PubMed.
- M. O. Aust, F. Godlinski, G. R. Travis, X. Hao, T. A. McAllister, P. Leinweber and S. Thiele-Bruhn, Environ. Pollut., 2008, 156, 1243 CrossRef CAS PubMed.
- M. Teixido, C. Hurtado, J. J. Pignatello, J. L. Beltran, M. Granados and J. Peccia, Environ. Sci. Technol., 2013, 47, 6197 CAS.
- F. Tamtam, F. Mercier, B. Le Bot, J. Eurin, Q. Tuc Dinh, M. Clément and M. Chevreuil, Sci. Total Environ., 2008, 393, 84 CrossRef CAS PubMed.
- G. Hamscher, H. T. Pawelzick, H. Höper and H. Nau, Environ. Toxicol. Chem., 2005, 24, 861 CrossRef CAS PubMed.
- A. J. Watkinson, E. J. Murby, D. W. Kolpin and S. D. Costanzo, Sci. Total Environ., 2009, 407, 2711 CrossRef CAS PubMed.
- W. Lertpaitoonpan, S. K. Ong and T. B. Moorman, Chemosphere, 2009, 76, 558 CrossRef CAS PubMed.
- J. G. Yu, X. H. Zhao, H. Yang, X. H. Chen, Q. Yang, L. Y. Yu, J. H. Jiang and X. Q. Chen, Sci. Total Environ., 2014, 482–483, 241 CrossRef CAS PubMed.
- K. Yang and B. Xing, Environ. Pollut., 2007, 145, 529 CrossRef CAS PubMed.
- X. Tian, T. Li, K. Yang, Y. Xu, H. Lu and D. Lin, Chemosphere, 2012, 89, 1316 CrossRef CAS PubMed.
- A. Deb, B. Mohanty, P. Ilaiyaraja, K. Sivasubramanian and B. Venkatraman, J. Radioanal. Nucl. Chem., 2012, 295, 1161 CrossRef.
- L. Zhang, X. Song, X. Liu, L. Yang, F. Pan and J. Lv, Chem. Eng. J., 2011, 178, 26 CrossRef CAS.
- H. Li, D. Zhang, X. Han and B. Xing, Chemosphere, 2014, 95, 150 CrossRef CAS PubMed.
- Z. Wang, X. Yu, B. Pan and B. Xing, Environ. Sci. Technol., 2009, 44, 978 CrossRef PubMed.
- X. Yu, L. Zhang, M. Liang and W. Sun, Chem. Eng. J., 2015, 279, 363 CrossRef CAS.
- Z. Di, P. Bo, Z. Huang, N. Ping and X. Baoshan, Environ. Sci. Technol., 2010, 44, 3806 CrossRef PubMed.
- D. Zhang, B. Pan, M. Wu, B. Wang, H. Zhang, H. Peng, D. Wu and P. Ning, Environ. Pollut., 2011, 159, 2616 CrossRef CAS PubMed.
- D. Wu, B. Pan, M. Wu, H. Peng, D. Zhang and B. Xing, Sci. Total Environ., 2012, 427–428, 247 CrossRef CAS PubMed.
- Q. Yang, G. Chen, J. Zhang and H. Li, RSC Adv., 2015, 5, 25541 RSC.
- W. L. Sun, J. Xia, S. Li and F. Sun, Chem. Eng. J., 2012, 200–202, 627 CrossRef CAS.
- E. Navarro, A. Baun, R. Behra, N. B. Hartmann, J. Filser, A. J. Miao, A. Quigg, P. H. Santschi and L. Sigg, Ecotoxicology, 2008, 17, 372 CrossRef CAS PubMed.
- Q. Mu, G. Jiang, L. Chen, H. Zhou, D. Fourches, A. Tropsha and B. Yan, Chem. Rev., 2014, 114, 7740 CrossRef CAS PubMed.
- R. J. Toh, A. Ambrosi and M. Pumera, Chemistry, 2012, 18, 115936 Search PubMed.
- S. Y. Madani, A. Mandel and A. M. Seifalian, Nano Rev., 2013, 4, 21521 Search PubMed.
- Z. Liu, S. Tabakman, K. Welsher and H. Dai, Nano Res., 2009, 2, 85120 Search PubMed.
- R. Su, Y. Jin, Y. Liu, M. Tong and H. Kim, Colloids Surf., B, 2013, 104(4), 133–139 CrossRef CAS PubMed.
- K. T. Kim, A. J. Edgington, S. J. Klaine, J. W. Cho and S. D. Kim, Environ. Sci. Technol., 2009, 43, 8979 CrossRef CAS PubMed.
- F. Wang, J. Yao, C. Yu, H. Chen, Z. Yi and M. M. F. Choi, ACS Sustainable Chem. Eng., 2014, 2, 1219 CrossRef CAS.
- T. Huffer, S. Schroth and T. C. Schmidt, Chemosphere, 2015, 119, 1169 CrossRef PubMed.
- S. Zhang, T. Shao and T. Karanfil, Water Res., 2011, 45, 1378 CrossRef CAS PubMed.
- D. Lin, X. Tian, T. Li, Z. Zhang, X. He and B. Xing, Environ. Pollut., 2012, 167, 138 CrossRef CAS PubMed.
- W. Wu, H. Sun, L. Wang, K. Li and L. Wang, J. Hazard. Mater., 2010, 174, 635 CrossRef CAS PubMed.
- H. Hyung and J.-H. Kim, Environ. Sci. Technol., 2008, 42, 4416 CrossRef CAS PubMed.
- X. Wang, L. Shu, Y. Wang, B. Xu, Y. Bai, S. Tao and B. Xing, Environ. Sci. Technol., 2011, 45, 9276 CrossRef CAS PubMed.
- G. C. Chen, X. Q. Shan, Y. Zhou, X. Shen, H. Huang and S. Khan, J. Hazard. Mater., 2009, 169, 912 CrossRef CAS PubMed.
- V. Datsyuk, M. Kalyva, K. Papagelis, J. Parthenios, D. Tasis, A. Siokou, I. Kallitsis and C. Galiotis, Carbon, 2008, 46, 833 CrossRef CAS.
- G. C. Chen, X. Q. Shan, Y. S. Wang, B. Wen, Z. G. Pei, Y. N. Xie, T. Liu and J. J. Pignatello, Water Res., 2009, 43, 2409 CrossRef CAS PubMed.
- A. Deb, P. Ilaiyaraja, D. Ponraju and B. Venkatraman, J. Radioanal. Nucl. Chem., 2012, 291, 877 CrossRef CAS.
- G. C. Chen, X. Q. Shan, Z. G. Pei, H. Wang, L. R. Zheng, J. Zhang and Y. N. Xie, J. Hazard. Mater., 2011, 188, 156 CrossRef CAS PubMed.
- K. Yang and B. Xing, Environ. Pollut., 2009, 157, 1095 CrossRef CAS PubMed.
- B. Smith, J. Yang, J. L. Bitter, W. P. Ball and D. H. Fairbrother, Environ. Sci. Technol., 2012, 46, 12839 CrossRef CAS PubMed.
- S. P. Moussavi, M. H. Ehrampoush, A. H. Mahvi, M. Ahmadian and S. Rahimi, Asian J. Chem., 2013, 25, 5319 CAS.
- S. P. Moussavi, M. H. Ehrampoush, A. H. Mahvi, S. Rahimi and M. Ahmadian, Asian J. Chem., 2014, 26, 821 CAS.
- K. Ghosh and M. Schnitzer, Soil Sci., 1980, 129, 266 CrossRef CAS.
- G. Sheng, J. Li, D. Shao, J. Hu, C. Chen, Y. Chen and X. Wang, J. Hazard. Mater., 2010, 178, 333 CrossRef CAS PubMed.
- D. Lin, T. Li, K. Yang and F. Wu, J. Hazard. Mater., 2012, 241–242, 404 CrossRef CAS PubMed.
- F. Wang, J. Yao, H. Chen, Z. Yi and B. Xing, Environ. Pollut., 2013, 180, 1 CrossRef CAS PubMed.
- D. Lin, N. Liu, K. Yang, L. Zhu, Y. Xu and B. Xing, Carbon, 2009, 47, 2875 CrossRef CAS.
- C. Lu and F. Su, Sep. Purif. Technol., 2007, 58, 113 CrossRef CAS.
- J. E. Kilduff, T. Karanfil and W. J. Weber, Environ. Sci. Technol., 1996, 30, 1344 CrossRef CAS.
- F. F. Liu, J. Zhao, S. Wang, P. Du and B. Xing, Environ. Sci. Technol., 2014, 48, 13197 CrossRef CAS PubMed.
- L. Hou, D. Zhu, X. Wang, L. Wang, C. Zhang and W. Chen, Environ. Toxicol. Chem., 2013, 32, 493 CrossRef CAS PubMed.
- D. Zhang, B. Pan, R. L. Cook and B. Xing, Environ. Pollut., 2015, 196, 292 CrossRef CAS PubMed.
- J. Zhao, Z. Wang, H. Mashayekhi, P. Mayer, B. Chefetz and B. Xing, Environ. Sci. Technol., 2012, 46, 5369 CrossRef CAS PubMed.
- L. Zhang, T. Xu, X. Liu, Y. Zhang and H. Jin, J. Hazard. Mater., 2011, 197, 389 CrossRef CAS PubMed.
- L. Zhang, X. Song, X. Liu, L. Yang, F. Pan and J. Lv, Chem. Eng. J., 2011, 178, 26 CrossRef CAS.
- W. Chen, L. Duan and D. Zhu, Environ. Sci. Technol., 2007, 41, 8295 CrossRef CAS PubMed.
- M. Teixidó, J. J. Pignatello, J. L. Beltrán, M. Granados and J. Peccia, Environ. Sci. Technol., 2011, 45, 10020 CrossRef PubMed.
- X. Li, B. Gamiz, Y. Wang, J. J. Pignatello and B. Xing, Environ. Sci. Technol., 2015, 49, 1409 CrossRef CAS PubMed.
- A. M. Mansour, J. Coord. Chem., 2013, 66, 1118 CrossRef CAS.
- V. Udayakumar, S. Periandy and S. Ramalingam, Spectrochim. Acta, Part A, 2011, 79, 920 CrossRef CAS PubMed.
- J. Wang, Z. Chen and B. Chen, Environ. Sci. Technol., 2014, 48, 4817 CrossRef CAS PubMed.
Footnote |
| † Electronic supplementary information (ESI) available. See DOI: 10.1039/c5ra26913j |
| This journal is © The Royal Society of Chemistry 2016 |