Ni nanoparticles highly dispersed on ZrO2 and modified with La2O3 for CO methanation

Jing Siab, Guilong Liuab, Jingge Liuab, Lin Zhaoab, Shuangshuang Liab, Yi Guanab and Yuan Liu*ab
aTianjin Key Laboratory of Applied Catalysis Science and Technology, School of Chemical Engineering, Tianjin University, Tianjin 300072, China. E-mail: yuanliu@tju.edu.cn; Tel: +86 22 87401675
bCollaborative Innovation Center of Chemical Science and Engineering (Tianjin), Tianjin 300072, China

Received 16th December 2015 , Accepted 21st January 2016

First published on 25th January 2016


Abstract

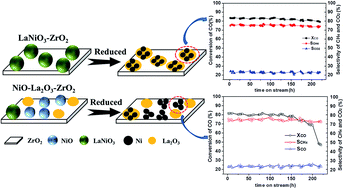
To improve the anti-sintering and anti-carbon deposition ability of the supported metallic nano catalysts, a new scheme for designing and preparing catalysts for CO methanation is presented in this work. In the scheme, a series of xLaNiO3/ZrO2 (x = 15%, 20%, 25%) catalysts were prepared according to the citrate complexing method. The catalysts were characterized by using BET, XRD, H2-chemisorption, H2-TPR, and TEM technologies. After reduction, the LaNiO3/ZrO2 catalyst precursor preferred to form Ni nanoparticles highly dispersed on ZrO2 and modified with La2O3. Compared with the catalyst prepared by the traditional impregnation method, the Ni/La2O3–ZrO2 derived from LaNiO3/ZrO2 showed a higher dispersion of Ni on ZrO2 and exhibited higher CO conversion and CH4 selectivity. Meanwhile, the LaNiO3/ZrO2 catalyst showed excellent stability owing to the significant improvement in both anti-carbon deposition and anti-sintering. The catalyst prepared according to this scheme intensified the interaction between Ni and La2O3, thus favoring the synergistic effect of La2O3 and Ni, which led to the high dispersion of Ni nanoparticles as well as the very good anti-sintering and anti-carbon deposition ability.

1. Introduction

Natural gas (mainly CH4) is a clean fuel, however, in China the reserve of natural gas is rather low. And due to the gradually increasing demand for natural gas, conversion of syngas to synthetic natural gas (SNG) via the methanation reaction has attracted much attention in the last decades.

During the production of synthetic natural gas from CO methanation, the following reaction occurs:

 
CO + 3H2 → CH4 + H2O ΔH°298 K = −206 kJ mol−1 (1)
 
CO + H2O → CO2 + H2 ΔH°298 K = −41.2 kJ mol−1 (2)
 
CH4 → C + 2H2 ΔH°298 K = +74.8 kJ mol−1 (3)

The CO methanation reaction (eqn (1)) and the water gas shift reaction (WGSR, eqn (2)) are both thermodynamically favorable, and usually the heat of the reaction can hardly be removed. Consequently a hot spot is easily formed and sintering of the catalysts is serious.1 Moreover, when the reaction temperature is high, the product CH4 will be dissociated on the active component as shown in eqn (3),2 which will result in the formation of a carbon deposition on the surface of the catalyst. The carbon will cover the active sites on the surface of the catalysts, leading to their deactivation. Therefore, developing an anti-sintering and/or anti-carbon deposition catalyst for the CO methanation reaction would be of great importance.

Currently, the catalysts reported for CO methanation include noble metal based catalysts and base metal catalysts, and the latter include mainly Fe, Co or Ni-based catalysts. Noble metal based catalysts such as Ru- and Rh-based catalysts are considered to be most active for syngas methanation.3–5 However the high cost and limited reserves restrict their large-scale industrial applications. Fe-based catalysts show lower activity and poor selectivity to CH4, and the stability of the catalysts is usually poor due to the serious carbon deposition on the surface of the catalysts.6 Co-based catalysts are not dominant for the selectivity of CH4, even though they can be used under harsh reaction conditions.7,8 Due to the relative low price, good activity and excellent selectivity to CH4, Ni based catalysts become one of the most promising catalysts.9,10

Great efforts have been made to resolve the problem of sintering and carbon deposition of the Ni catalysts. The sintering of Ni nanoparticles in the catalysts may be suppressed by loading Ni nanoparticles on carriers with large specific surface or limiting the size of Ni nanoparticles within ordered mesoporous structures, or by adding oxide promoters as the barrier of Ni nanoparticles, as reported in literatures.11–14 The interaction between the carriers or oxide promoters and active components can confine metal and inhibit the migration of Ni nanoparticles. Carbon deposition can be reduced by adding promoters, such as La2O3, which can help eliminate carbon deposition on the surface of metal.13,15 In addition, adding another metal to form alloy also can refrain the carbon deposition.16 Interestingly, Y. Li et al. reported that microstructured catalysts like open-cell metal foam can reduce the “hotspot” formation owing to its high thermal conductivity, and the sintering and carbon deposition were inhibited during the syngas methanation.17–19

Perovskite-type oxides (PTO) are generally written as ABO3, where A sites are usually occupied by rare-earth, alkaline-earth, or other large ions, while the B sites are filled with transition-metal cations.15,20 PTOs are extensively used as catalysts extensively for oxidation/reduction reactions, such as methane catalytic combustion, carbon dioxide reforming of methane, partial oxidation of methane and so on.21,22

LaNiO3 with perovskite structure has been used as the precursors for preparing Ni nano catalysts. D. Lima et al.23 found that highly dispersed Ni on La2O3 can be obtained by the reduction of LaNiO3, and the resulted Ni/La2O3 catalyst is highly resistant to carbon deposition for SRE reaction. J. Gao et al.20 found that after treatment under the reaction conditions of CO2 methanation, LaNiO3 perovskite would be transferred to highly dispersed Ni nanoparticles supported on La2O2CO3, and the catalysts showed high catalytic activity for CO2 methanation.

However, there is a defect for Ni/La2O3 catalyst by using LaNiO3 as the precursor. Usually the surface area of LaNiO3 is rather small, so after long time reaction, active species of nickel would be sintered inevitably. Meanwhile, the loading amount of Ni cannot be adjusted. An effective way for improving the surface of PTOs is to load PTOs on a support which has a high specific surface area. As for methanation reaction, ZrO2 is a good choice for the support. Takenaka et al.24 found that Ni/ZrO2 has the best catalytic performance compared with that of Ni/MgO, Ni/Al2O3, Ni/SiO2 and Ni/TiO2 for CO methanation. L. G. Appel et al.25 pointed out that the methanation of CO can occur on ZrO2, which is related to the presence of acid sites on ZrO2 surface. The acid sites on ZrO2 can adsorb CO and then adsorbed CO reacts with H2 spillover from Ni.26

Based on the above considerations, a new scheme for the preparation of LaNiO3/ZrO2 is proposed in this work, and the LaNiO3/ZrO2 catalyst is firstly used for CO methanation. The design process has the following advantages: (1) ZrO2 is a promising support for Ni, and ZrO2 possesses a high specific surface area, thus the sintering of Ni nanoparticle on the support would be restricted; (2) after the reduction of LaNiO3/ZrO2, Ni would mix with La2O3 nanoparticles uniformly and highly disperse on ZrO2 for that La3+ and Ni3+ are evenly distributed at atomic level in the precursor of LaNiO3. The uniform mixing of Ni and La2O3 favors the interaction between Ni and La2O3; (3) La2O3 can act as a barrier between the neighbouring Ni nanoparticles and inhibits the sintering of Ni nanoparticles; (4) La2O3 can react with CO2 to form La2O2CO3, which help eliminate carbon deposition. Moreover the interaction between Ni and La2O3 will reinforce the ability of carbon elimination.

2. Experimental section

2.1. Catalysts preparation

The support of ZrO2 was prepared according to the precipitation method as reported in the literature.27 The aqueous solution of 0.3 M ZrOCl2 was added to a 0.3 M aqueous NH4OH under stirring at a drop pace of 1 mL min−1 until the pH of the solution was 9–10. The hydrous zirconia, after staying in its mother solution for 24 h, was filtered and washed with deionized water until no Cl could be detected by AgNO3. The obtained filter cake was dried at 110 °C overnight and finally calcined at 700 °C for 5 h.

LaNiO3/ZrO2 was prepared according to the incipient wetness impregnation method combined with citrate complexing method. Stoichiometric lanthanum and nickel nitrate at La/Ni molar ratio of 1[thin space (1/6-em)]:[thin space (1/6-em)]1 were dissolved in deionized water. Then, citric acid and ethylene glycol were added into the solution with the molar ratio of the total metal ion/citric acid/ethylene glycol = 1[thin space (1/6-em)]:[thin space (1/6-em)]1.2[thin space (1/6-em)]:[thin space (1/6-em)]0.48 under stirring. The obtained aqueous solution was impregnated on ZrO2 support. After staying overnight, the resulting sample was dried at 80 °C for 6 h and 120 °C for 12 h. The dried samples were calcined at 350 °C and 700 °C for 2 and 5 h, respectively, at a heating rate of 2 °C min−1. And xLaNiO3/ZrO2 (x = 15%, 20% and 25%) were obtained. The synthesized xLaNiO3/ZrO2 (x = 15%, 20% and 25%) were respectively named as xLN-Z (x = 15, 20, 25). Meanwhile, unsupported LaNiO3 was prepared according to the citrate complexing method.

For comparison, NiO–La2O3/ZrO2 was prepared by incipient-wetness impregnation method. Unlike the preparation method of xLaNiO3/ZrO2, no citric acid and ethylene glycol in the impregnation solution were used. In NiO–La2O3/ZrO2, the content of Ni and La were same as that in 20% LaNiO3/ZrO2 catalyst. The obtained NiO–La2O3/ZrO2 was labeled as 20L-N-Z-imp.

2.2. Characterization of catalysts

Nitrogen adsorption and desorption isotherms were tested on a Trwastar 3000 micromeritics apparatus at −196 °C. The samples were out gassed at 300 °C for 4 h under vacuum before starting N2 adsorption. The specific surface areas were calculated according the BET method, the pore size distributions and pore volume were derived from the BJH method using the desorption branch of the isotherms.

X-ray diffraction (XRD) patterns of the catalysts were recorded on a Bruker D8-Focus X-ray diffractometer with Ni-filtered Cu Kα radiation (λ = 0.15406 nm). The scanning range (2θ) was between 20 to 55° at a scanning speed of 5° min−1. The Scherrer equation was used to calculate the crystal size of the samples from the X-ray patterns.

Transmission electron microscopy (TEM) experiments were conducted on a FEI (PHILIPS) Tecnai-G2F20 instrument equipped with Field Electronic Emitter. After ultrasonic dispersion of the catalysts in absolute ethanol, the samples were deposited on copper grids with a holey carbon film support.

Temperature programmed reduction (TPR) tests were carried out on a Thermo-Finnigan instrument. In each run, 50 mg of the catalyst was loaded into a quartz tube reactor and pretreated in N2 at 200 °C for 1 h to remove the air in the reactor. Then, the catalyst was heated from room temperature to 850 °C with a heating rate of 10 °C min−1 in 5% H2/Ar with a flow rate of 50 mL min−1.

H2 chemisorption test were conducted on the same instrument as H2-TPR. 100 mg of the sample were in situ reduced at 600 °C for 1 h in H2 (60 mL min−1), and then flushed by Ar (60 mL min−1) at 600 °C for 1 h. After the temperature was cooled to 30 °C, 50 mL of H2 pulses were injected into the Ar stream until the effluent area of consecution pulses was constant. Ni dispersion and the average nickel crystallite diameter were calculated based on the assumption of spherical crystallites of uniform size.28

Thermogravimetric analysis (TG) was conducted on a DTG-50/50H thermal analyser to obtain the amount of carbon deposited on the spent catalysts. During TG tests, 10 mg of the sample was used and heated from 20 to 800 °C with a ramping rate of 10 °C min−1 in air atmosphere.

2.3. Catalytic performance

Catalytic performance tests were carried out on a continuous-flow fixed tubular quartz micro-reactor with an 8 mm inside diameter at atmospheric pressure. In each test, 200 mg of catalyst was pre-reduced at 600 °C for 2 h under H2. The reaction feed stream is composed of 20% CO, 60% H2 and 20% N2 in volume, where N2 was used as the internal standard gas to analyze the composition of the off-gases. The reaction temperature was monitored by a K-type thermocouple placed in the catalyst bed and controlled by a temperature controller. The effluent gases were analyzed using an on-line gas chromatograph (GC) of SP-3420 with a TCD detector. The catalytic performance of catalyst is evaluated by CO conversion (XCO) and CH4 selectivity (SCH4), which are defined as the following formulas:
 
image file: c5ra26888e-t1.tif(4)
 
image file: c5ra26888e-t2.tif(5)
 
image file: c5ra26888e-t3.tif(6)
here, [CO]in is the moles of CO in the feed stream, [CO]out is the moles of CO in the effluent gas; [CH4]out is the moles of CH4 in the effluent gas.

3. Results and discussion

3.1. Catalyst characterizations

3.1.1. N2 adsorption–desorption. The N2 adsorption–desorption isotherms and the corresponding pore size distribution (the inset picture) of the catalysts are shown in Fig. 1. The N2 adsorption–desorption isotherm of the samples exhibit typical IV adsorption stripping curve with a H2-type hysteresis loop, suggesting the existence of mesopores. All of the pores in the samples were formed by particles packing, and not in parallel arranged structure.
image file: c5ra26888e-f1.tif
Fig. 1 N2 adsorption–desorption isotherms of (a) BJH pore size distributions and (b) of ZrO2 and xLN-Z.

With the increasing loading amount of LaNiO3, the onset of the hysteresis loop moved to the higher relative pressure, and the hysteresis loops become small, meaning that the loaded LaNiO3 entered into the pores of ZrO2.

The BET surface area of the ZrO2 is 90.1 m2 g−1 (listed in Table 1). After loading LaNiO3, the specific surface areas decrease from 90.1 m2 g−1 of ZrO2 support to 59.5 m2 g−1 of 25LN-Z, which should be due to the blockage of the meso-pores of ZrO2 by the perovskite-type oxide.

Table 1 Physical properties of ZrO2 and xLN-Z
Sample SBET (m2 g−1) Pore size (nm) VBJH (cm3 g−1) DZrO2a (nm) Dperovskitea (nm)
a Calculated from XRD results with Scherrer formula: D = /(β[thin space (1/6-em)]cos[thin space (1/6-em)]θ).
ZrO2 90.1 29.32 0.257 16.3
15LN-Z 83.3 17.18 0.192 15.4 13.3
20LN-Z 62.7 17.06 0.157 16.3 13.9
25LN-Z 59.5 16.91 0.153 15.7 15.1


The most frequency pore sizes and the pore volumes were determined from the desorption isotherms, and the results are listed in Table 1. The pore volumes and the pore sizes decrease after loading the perovskite-type oxide of LaNiO3 compared with that of ZrO2, which indicate that subsequently impregnated LaNiO3 entered into the pores of ZrO2. Meanwhile, the sizes of LaNiO3 calculated by XRD are about 15 nm, which is smaller than the pore size of ZrO2 (29.32 nm). Thus, the LaNiO3 would be dispersed on the surface of ZrO2 support.

3.1.2. XRD. The XRD patterns of xLN-Z (x = 15, 20, 25), 20L-N-Z-imp and ZrO2 are presented in Fig. 2. For ZrO2, the main crystal phase in all the samples is monoclinic ZrO2 (m-ZrO2). For xLN-Z (x = 15, 20, 25) in Fig. 2a, a new diffraction peak at 2θ ≈ 33° appears, and the new diffraction peaks are attributed to the perovskite structure LaNiO3. With the increasing of the loading amount of LaNiO3, the diffraction intensity of LaNiO3 increases. For 20L-N-Z-imp, another two diffraction peaks at 2θ ≈ 37.2 and 43.3° can be observed in Fig. 2a, and the two diffraction peaks are assigned to NiO. Namely, pure LaNiO3 with perovskite structure was loaded on ZrO2 in xLN-Z, which agrees with the catalyst designing scheme, while NiO was formed in the 20L-N-Z-imp.
image file: c5ra26888e-f2.tif
Fig. 2 XRD patterns of xLN-Z, 20L-N-Z-imp and ZrO2: (a) the fresh catalysts; (b) catalysts after reduction; (c) catalysts after reaction (△) m-ZrO2; (●) Ni; (♠) LaNiO3; (◆) NiO.

The XRD patterns of reduced catalysts are shown in Fig. 2b. After reduction, the diffraction peak for each sample attributed to perovskite structure disappear and a very faint diffraction peak corresponding to Ni at 2θ ≈ 44.48° can be observed in the enlarged XRD patterns, suggesting the high dispersion of Ni on ZrO2. The atomic ratio of La/Ni in LaNiO3 equals to 1, so the reduction of nickel ions from LaNiO3 occurred concomitantly with the formation of La2O3. However, the diffraction peaks of La2O3 cannot be seen after reduction, which should be attributed to the highly dispersed La2O3 on ZrO2. The similar situation was also reported by Sun et al., who found that diffraction peaks of La2O3 in the XRD patterns could be seen only when the loading amount of La2O3 on ZrO2 was higher than 14 wt%.29 The XRD results of the reduced catalysts suggest that Ni nanoparticles were highly dispersed on ZrO2 and modified with La2O3.

Meanwhile, after the reduction of xLN-Z, La2O3 would mix with Ni nanoparticles uniformly for that La3+ and Ni3+ are evenly distributed at atomic level in the precursor of LaNiO3/ZrO2. In this way, La2O3 can act as barriers to prevent Ni nanoparticles contacting each other, and the sintering of Ni nanoparticles could be restricted. Besides, La2O3 can react with CO2 to form La2O2CO3, which help eliminate carbon deposition.20 Therefore, the uniform distribution of Ni and La2O3 favors to improve the anti-coking and anti-sintering ability of the catalysts.

Fig. 2c shows the XRD patterns of the sample after reaction. The diffraction patterns of ZrO2 have little change compared with the fresh samples, indicating that ZrO2 is stable in the reaction process. After reaction, diffraction peaks corresponding to Ni at 2θ ≈ 44.48° are still much weak, meaning that Ni is stable under the reaction process. While for 20L-N-Z-imp, the diffraction peak of Ni seems a little sharper than 20LN-Z, meaning that the sintering of Ni occurred and the anti-sintering ability of xLN-Z is much better.

3.1.3. H2 chemisorption. H2 chemisorption of xLN-Z and 20L-N-Z-imp after reduction and after reaction are listed in Table 2. For xLN-Z (x = 15, 20, 25) after reduction, the H2 uptake increases with the increasing of the loading amount of LaNiO3. The highest dispersion of Ni nanoparticles can be seen in 20LN-Z, and for 25LN-Z the crystal size of LaNiO3 is bigger (see Table 1) which would contribute to the lower dispersion of Ni. Compared with xLN-Z, the adsorption amount of hydrogen and dispersion of Ni in 20LN-Z-imp are obviously lower, indicating that nickel catalyst prepared from LaNiO3/ZrO2 is more conducive to high dispersion of nickel.
Table 2 H2 chemisorption results of the catalysts of xLN-Z (x = 15, 20, 25) and 20L-N-Z-imp
Sample After reduction After reaction
H2 uptake (μmol g−1) Ni dispersiona (%) H2 uptake (μmol g−1) Ni dispersiona (%)
a Based on H2 uptake using the equation: D = Ni atoms on the surface/total Ni atoms.
15LN-Z 31.6 10.1 29.2 9.5
20LN-Z 45.9 11.0 41.8 10.3
25LN-Z 47.1 9.3 42.5 8.4
20L-N-Z-imp 27.4 6.5 16.1 3.8


After reaction, the uptake of hydrogen and dispersion of Ni on LN-Z only change a little, meaning that sintering of Ni nanoparticles does not occur and that the anti-sintering ability is excellent. While for 20L-N-Z-imp, the uptake of hydrogen and dispersion of Ni decrease significantly after reaction, indicating the severer sintering of Ni nanoparticles. The result of H2 chemisorption is consistent with the XRD results of above.

3.1.4. TPR. The reducibility analysis of the catalyst precursor was carried out by using TPR technique, and the H2-TPR profiles of the samples are presented in Fig. 3. No reduction peak of ZrO2 can be seen, meaning that ZrO2 is stable enough and all the reduction peaks showed are contributed to the reduction of nickel ions.
image file: c5ra26888e-f3.tif
Fig. 3 TPR profiles of xLN-Z (x = 15, 20, 25), LaNiO3, 20L-N-Z-imp and ZrO2.

It's seen that H2-TPR profiles of xLN-Z (x = 15, 20, 25) exhibit two main reduction peaks, which appear at around 380 and 585 °C. The reduction profiles of xLN-Z are similar with that of LaNiO3, indicating that perovskite-type oxide of LaNiO3 had been loaded on ZrO2 successfully, which is consistent with the XRD results and supports the catalyst designing scheme.

Studies on the reduction of LaNiO3 are many,30–32 according to the studies, the first peak is contributed to the reduction of Ni3+ to Ni2+, forming La2Ni2O5, and the second peak is corresponding to the reduction of Ni2+ to Ni0. The two reduction steps can be expressed in the following formulas, respectively:

 
2LaNiO3 + H2 → La2Ni2O5 + H2O (7)
 
La2Ni2O5 + H2 → La2O3 + 2Ni + H2O (8)

H2 consumptions are calculated and listed in Table 3. The H2 consumptions of low temperature peaks derived from the TPR results are close to the total theoretic H2 consumptions of Ni3+ → Ni2+, and the H2 consumptions of high temperature peaks derived from the TPR results are close to the theoretic H2 consumptions of Ni2+ → Ni0. This supports the attributions of the TPR peaks above.

Table 3 H2 consumption (μmol mg−1) for xLN-Z and 20L-N-Z-imp
Samples Experimental values Theoretical values
TL TH Ni3+ → Ni2+ Ni2+ → Ni0
15LN-Z 12.6 25.9 15.5 31.0
20LN-Z 16.0 32.4 20.1 41.7
25LN-Z 22.5 46.3 25.3 50.7
20L-N-Z-imp 43.3 3.2 41.7


Compared with pure LaNiO3, the two reduction peaks of xLN-Z (x = 15, 20, 25) shift to higher temperatures. The reason is that the LaNiO3 particles are highly dispersed on ZrO2 and the strong interaction between LaNiO3 and ZrO2 restrains the reduction of LaNiO3. With the increasing content of LaNiO3, the particles size of LaNiO3 increases and the interaction between LaNiO3 and ZrO2 is weakened, leading to the lower reduction temperature.

For 20L-N-Z-imp, one main hydrogen consumption peak is located at around 440 °C, and another small hydrogen consumption peak is observed at around 600 °C. From the XRD result of 20L-N-Z-imp, both NiO and LaNiO3 phases are existed. So the first reduction peak at 450 °C is attributed to the reduction of NiO to Ni0 and Ni3+ in LaNiO3 to Ni2+. The small peak at around 600 °C is contributed to the reduction of Ni2+ in La2Ni2O5 to Ni0, see eqn (8).

3.1.5. TEM. The TEM images of 20L-N-Z and 20L-N-Z-imp after reduction are shown in Fig. 4. The particle size of ZrO2 is about 15 nm (see Fig. 4a and b), which is in according with the XRD results above. In order to obtain the feature of reduced catalyst of 20LN-Z, high resolution TEM micrograph (HRTEM) and Fast Fourier Transform (FFT) were investigated (Fig. 4a, a′ and a′′). In the Fig. 4a′, the lattice distance of 1.76 Å is assigned to Ni (100) and the size of the Ni on ZrO2 is about 5 nm. Around the Ni nanoparticles, the lattice distance of 2.84 Å is the lattice fringes of support ZrO2 (111). The analysis result suggests that Ni is highly dispersed on ZrO2. Lattice fringes corresponding to La2O3 could not be observed, suggesting La2O3 is in amorphous state.
image file: c5ra26888e-f4.tif
Fig. 4 TEM micrographs of the catalysts after H2 reduction (a and a′) 20LN-Z; (b) 20L-N-Z-imp; (a′′) EDS line scanning of selected area for 20LN-Z.

image file: c5ra26888e-f5.tif
Fig. 5 The variation of (a) CO conversion, (b) CH4 selectivity, (c) CH4 yield with the reaction temperature at GSHV = 15[thin space (1/6-em)]000 mL g−1 h−1, in the gas mixture of H2/CO/N2 = 3/1/1.

The line scanning profiles (Fig. 4a′′) of two particles present the element distributions of O, Zr, La and Ni. The signal of La is weak, therefore the signal of La was enlarged and shown in Fig. 4a′′. Seen from the species dispersion on the abscissa in the insets of Fig. 4a′′, nickel dispersed mainly in the area between 25 to 35 nm, lanthanum mainly between 15 to 45 nm, zirconium and oxygen between 15 to 50 nm. This means that the nickel nanoparticle is supported on lanthanum oxide and the lanthanum oxide is spread on zirconia.

It is known that La2O3 tends to interact with ZrO2 as stated by H. Sun et al.29 and the interaction between La2O3 and ZrO2 would pull La2O3 to spread on ZrO2 surface. Meanwhile, both metal nickel nanoparticle and La2O3 came from a LaNiO3 grain, hence metal nickel nanoparticle is on La2O3 and surrounded by La2O3. This situation is not observed in Fig. 4a′, for that La2O3 is in amorphous state, and no lattice corresponding to La2O3 exists.

3.1.6. Structure evolution of catalysts before and after reduction. From XRD, TPR and TEM analysis for the catalysts of LN-Z, the structure variation of the catalysts can be described as the Scheme 1a. In the preparation, citric acid and ethylene glycol were added to the impregnation liquid, and during the complexing at 80 °C, all the metal ions entered into the macromolecular complex, that is, all the metal ions were homogeneously dispersed, leading to the formation of LaNiO3 perovskite after calcination (see Fig. 2). In the catalyst precursor of LaNiO3/ZrO2, Ni3+ and La3+ are uniformly dispersed at the atomic level in the crystalline of LaNiO3. In the reduction process Ni would be separated out from the lattice of LaNiO3 to form Ni nanoparticles, which should be well dispersed in La2O3 matrix and loaded on ZrO2 (see Fig. 4). In this way, Ni nanoparticles contact with La2O3 closely and isolated by La2O3 spatially, which favors the interaction between Ni and La2O3. The interaction between Ni and La2O3 will inhibit the sintering of Ni nanoparticles and eliminate carbon deposition, contributing to the good stability for CO methanation.
image file: c5ra26888e-s1.tif
Scheme 1 The structural evolution of xLN-Z (a) and 20L-N-Z-imp (b).

In contrast, the structure evolution of 20L-N-Z-imp can be described in Scheme 1b. Without the citric acid and ethylene glycol in the impregnation solution, Ni3+ and La3+ are not uniformly dispersed at the molecular level in the dried samples. After calcination, NiO and La2O3 were formed and unevenly dispersed on ZrO2, besides a few grains of LaNiO3 perovskite generated (see Fig. 2). During reduction, the Ni will release from NiO and couldn't be well contact with La2O3, which will not favor the interaction between Ni and La2O3. So Ni nanoparticles are easier to sintering during the reaction process.

From the analysis of structural evolution of the two catalysts, the catalyst LaNiO3/ZrO2 fabricated by citrate complexing method is more beneficial to form highly dispersed Ni nanoparticles than the catalysts prepared by traditional impregnation method.

3.2. Catalytic performance for CO methanation

The variation of CO conversion, CH4 selectivity and CH4 yield with temperature for LaNiO3/ZrO2 and 20L-N-Z-imp are shown in Fig. 5. Completely CO conversion can be obtained over 20LN-Z and 25LN-Z in the temperature range of 260 to 400 °C, suggesting that the catalysts are much active, see Fig. 5a. As the reaction temperature is higher than 400 °C, CO conversion decreases with the increase of the reaction temperature, for that CO methanation is a strong exothermic reaction, and in high temperature CO methanation reaction would be suppressed.
image file: c5ra26888e-f6.tif
Fig. 6 Conversion of CO, selectivity to CH4 and CO2 over 2LN-Z (a); 20L-N-Z-imp (b) vs. reaction time on stream at 550 °C, GHSV of 15[thin space (1/6-em)]000 mL g−1 h−1 and in H2/CO/N2 = 3/1/1.

From Fig. 5b and c the highest CH4 selectivity and CH4 yield are obtained at 350 °C. The decrease of the selectivity and the yield of methane is attributed to the occurrence of WGSR at high temperature, seen eqn (2), resulting in the lower methane selectivity, methane yield and more CO2.

For the catalysts 20LN-Z and 20L-N-Z-imp, the contents of loaded active metal are identical (4.9 wt%). The temperature for the maximum conversion of CO over catalyst of 20L-N-Z-imp is 350 °C, where the CO conversion is 96% and CH4 selectivity is 78%. While over 20LN-Z, 100% of CO conversion and 89% of CH4 selectivity were obtained at 260 °C. So 20LN-Z is much better. The higher activity of 20LN-Z is attributed to the higher dispersion of Ni nanoparticles derived from perovskite structure. Seen from Table 2, the Ni dispersion (11%) in the reduced 20LN-Z is much higher than that in 20L-N-Z-imp (6.5%). The higher selectivity to methane over 20LN-Z suggests that 20LN-Z does not favor the WGSR reaction, which is of interest and further research is needed.

In addition, the effect of LaNiO3 loading in LaNiO3–ZrO2 on the catalytic performance for CO methanation was investigated. 20LN-Z is the most active catalyst among the three catalysts with 100% CO conversion and 89.5% CH4 selectivity at 260 °C, and the catalytic performance remains almost constant in the temperature range from 260 °C to 400 °C. While the performance of 15LN-Z is relatively poor with CO conversion of 100% at 270 °C and the corresponding CH4 yield is 86.9%, which should be attributed to the lower loading amount of the active component nickel (3.6%). The activity of 25LN-Z is comparable with that of 20LN-Z, due to that the active component of nickel is dispersed more highly in 20LN-Z. Seen from Table 2, the Ni dispersion in 25LN-Z is about 9.3%, being lower than that of 20LN-Z (11%).

3.3. Stability test

The catalyst is very stable at low temperature. In order to accelerate the deactivation of the catalyst and shorten the test time, the stability tests of catalysts 20LN-Z and 20L-N-Z-imp were carried out at a high temperature of 550 °C and the results are summarized in Fig. 6. Seen from Fig. 6a, 20LN-Z catalyst maintains its good activity and selectivity during the 220 hours stability test, meaning that no obvious deactivation of 20LN-Z occurred. While, 20L-N-Z-imp catalyst only remain stable in the initial 120 hours and then deactivation occurs. Namely, the prepared 20LN-Z is more stable and showed excellent stability for CO methanation.

During the reaction of CO methanation, the stability of the catalyst is subject to carbon deposition on the active metallic nickel and sintering of nickel significantly. Carbon deposition will cover active sites on the surface of the catalyst, leading to the deactivation of catalysts. Sintering will lead to the formation of large metal particles, lowering the overall surface area and activity. The excellent stability of LaNiO3/ZrO2 is closely associated with the synergistic effect of Ni and La2O3. The synergistic effect between Ni and La2O3 will suppress the sintering of Ni nanoparticles. In addition, La2O3 can react with CO2 to form La2O2CO3 which help eliminate carbon deposition,15 and the synergistic effect between Ni and La2O3 will reinforce the ability of carbon elimination.

3.4. Characterization of the used catalysts

XRD analysis of 20LN-Z and 20L-N-Z-imp after long time test is shown in Fig. 7. For all the samples, only diffraction peak of m-ZrO2 could be seen and the m-ZrO2 is stable. It was reported that La2O3 can stabilize zirconia and can improve the anti-sintering ability of zirconia effectively.33,34 No obvious change can be seen for 20LN-Z after reduction and after stability test, suggesting that Ni nanoparticles were still highly dispersed on the ZrO2 after long time test at high temperature. However, for the used 20L-N-Z-imp, the intensity of Ni diffraction peak increases (the inset in Fig. 8), implying that Ni nanoparticles in 20L-N-Z-imp are sintered after long time reaction. The results of XRD suggest that the catalysts prepared by citric acid complexing method possess stronger ability for anti-sintering compared with the catalysts prepared by traditional impregnation method.
image file: c5ra26888e-f7.tif
Fig. 7 XRD patterns of ZrO2, the reduced and used catalysts. The catalysts were used for 220 hours at 550 °C with GHSV of 15[thin space (1/6-em)]000 mL g−1 h−1 in H2/CO/N2 = 3/1/1.

image file: c5ra26888e-f8.tif
Fig. 8 TG curves of the used catalysts: (a) 20LN-Z, (b) 20L-N-Z-imp. The catalysts were used under the same conditions as in Fig. 7.

To investigate the anti-coking ability of the prepared catalysts, TG analysis was taken out and the results are shown in Fig. 8. For used 20LN-Z, the initial weight loss before 300 °C is attributed to the removal of H2O and some physically adsorbed CO2 species or formate/carbonate species.35,36 And a weight gain about 0.7% is observed at around 600 °C, which is due to the oxidation of Ni to NiO. Except that, no obvious weight loss occurs, indicating that coking deposition on the surface of the catalyst is much small. While for 20L-N-Z-imp, obvious weight loss can be seen in the temperature range between 300 and 600 °C, which was attributed to the combustion of carbon deposited.11,37 Namely, the 20LN-Z possesses excellent anti-coking ability compared with 20L-N-Z-imp.

TEM images of the used catalysts 20LN-Z and 20L-N-Z-imp are shown in Fig. 9. For 20LN-Z, no carbon deposition can be observed even after 220 hours stability test (seen in Fig. 9a). In contrast, some amorphous carbons can be observed on the surface of the used 20L-N-Z-imp catalyst. The amorphous carbon deposited on the catalyst would wrap up the active sites of Ni, leading to deactivation of the catalyst. The TEM results are consistent with the TG results.


image file: c5ra26888e-f9.tif
Fig. 9 TEM micrographs of the used catalysts: (a) 20LN-Z; (b) 20L-N-Z-imp. The catalysts were used under the same conditions as in Fig. 7.

Carbon deposition is generally formed via disproportionation of carbon monoxide and/or decomposition of methane. The reactant CO can be absorbed on Ni active site, carbon species would be formed and absorbed on the surface of Ni, see the eqn (9). In addition, when the reaction temperature is too high, the produced CH4 adsorbed on Ni active sites will be dissociated to form carbon species and hydrogen, see the eqn (10). Those are the main reasons for carbon deposition on Ni active site in the CO methanation.

 
2CO + Ni → C–Ni + CO2 (9)
 
CH4 + Ni → C–Ni + 2H2 (10)

The better ability of anti-coking of the 20LN-Z catalyst may be attributed to the synergistic effect between Ni and La2O3. It is reported that La2O3 species generated from the reduction of LaNiO3 can reacted with CO2 to form a carbonate layer of La2O2CO3, see the eqn (11). And the carbonate species subsequently would react with surface carbon species on Ni sites, see the eqn (12), hence converting carbon species to CO.15

 
La2O3 + CO2 → La2O2CO3 (11)
 
C–Ni + La2O2CO3 → 2CO + Ni + La2O3 (12)

In the catalyst precursor 20LaNiO3/ZrO2, Ni3+ and La3+ are uniformly dispersed at the atomic level in the crystalline of LaNiO3, when treated with hydrogen Ni is released from LaNiO3 along with La2O3 and highly dispersed on ZrO2. In this way, lanthanum oxide has an intimate contact with Ni. In the reaction process, La2O3 converted to La2O2CO3 as eqn (11) shown. When carbon species deposited on Ni surface, La2O2CO3 around the Ni will quickly react with those carbon species, hence inhibiting the formation of carbon deposition, see the eqn (12). Therefore the synergistic effect between Ni and La2O3 contributed to the elimination of carbon deposition.

From XRD, TEM, and TGA analysis of the used catalysts, the good stability of 20LN-Z catalysts can be attributed to the much improved anti-coking and anti-sintering properties.

4. Conclusion

LaNiO3 with the perovskite structure was loaded on the surface of ZrO2 by using the citrate complexing method. After reduction, LaNiO3/ZrO2 favors the formation of the highly dispersed Ni nanoparticles supported on ZrO2 and modified by La2O3. The Ni/ZrO2–La2O3 catalyst reduced from LaNiO3–ZrO2 exhibited very good activity for CO methanation, due to the much high dispersion of Ni nanoparticles.

In the reduced catalysts of Ni/ZrO2–La2O3, nanoparticles Ni are surrounded by or loaded on La2O3, for that both of them come from the nano grains of LaNiO3. Compared with NiO–La2O3/ZrO2 prepared by traditional impregnation method, the LaNiO3/ZrO2 catalysts exhibited higher stability, for the higher ability of anti-sintering and anti-carbon deposition. The interaction between Ni and La2O3 will suppress the sintering of Ni nanoparticles as well as help eliminate the carbon deposited.

Acknowledgements

The financial support of this work by NSFC (No. 21376170, 21576192) is gratefully acknowledged.

References

  1. J. Sehested, S. Dahl, J. Jacobsen and J. R. Rostrup-Nielsen, J. Phys. Chem. B, 2005, 109, 2432–2438 CrossRef CAS PubMed.
  2. J. W. Snoeck, G. Froment and M. Fowles, J. Catal., 1997, 169, 250–262 CrossRef CAS.
  3. A. Beuls, C. Swalus, M. Jacquemin, G. Heyen, A. Karelovic and P. Ruiz, Appl. Catal., B, 2012, 113, 2–10 CrossRef.
  4. J. N. Park and E. W. McFarland, J. Catal., 2009, 266, 92–97 CrossRef CAS.
  5. C. Galletti, S. Specchia and V. Specchia, Chem. Eng. J., 2011, 167, 616–621 CrossRef CAS.
  6. A. L. Kustov, A. M. Frey, K. E. Larsen, T. Johannessen, J. K. Nørskov and C. H. Christensen, Appl. Catal., A, 2007, 320, 98–104 CrossRef CAS.
  7. A. N. Akin, M. Ataman, A. E. Aksoylu and Z. I. Önsan, React. Kinet. Catal. Lett., 2002, 76, 265–270 CrossRef CAS.
  8. R. Razzaq, C. Li, M. Usman, K. Suzuki and S. Zhang, Chem. Eng. J., 2015, 262, 1090–1098 CrossRef CAS.
  9. H. Tian, S. Li, L. Zeng, H. Ma and J. Gong, Front. Mater. Sci. China, 2015, 58, 9–15 CrossRef CAS.
  10. J. Zarfl, D. Ferri, T. J. Schildhauer, J. Wambach and A. Wokaun, Appl. Catal., A, 2015, 495, 104–114 CrossRef CAS.
  11. Q. Liu, J. Gao, F. Gu, X. Lu, Y. Liu, H. Li, Z. Zhong, B. Liu, G. Xu and F. Su, J. Catal., 2015, 326, 127–138 CrossRef CAS.
  12. X. Lu, F. Gu, Q. Liu, J. Gao, Y. Liu, H. Li, L. Jia, G. Xu, Z. Zhong and F. Su, Fuel Process. Technol., 2015, 135, 34 CrossRef CAS.
  13. B. Valle, B. Aramburu, A. Remiro, J. Bilbao and A. G. Gayubo, Appl. Catal., B, 2014, 147, 402–410 CrossRef CAS.
  14. C. Guo, Y. Wu, H. Qin and J. Zhang, Fuel Process. Technol., 2014, 124, 61–69 CrossRef CAS.
  15. K. Sutthiumporn, T. Maneerung, Y. Kathiraser and S. Kawi, Int. J. Hydrogen Energy, 2012, 37, 11195–11207 CrossRef CAS.
  16. D. Harshini, Y. Kwon, J. Han, S. P. Yoon, S. W. Nam and T.-H. Lim, Korean J. Chem. Eng., 2010, 27, 480–486 CrossRef CAS.
  17. Y. Li, Q. Zhang, R. Chai, G. Zhao, F. Cao, Y. Liu and Y. Lu, Appl. Catal., A, 2016, 510, 216–226 CrossRef CAS.
  18. Y. Li, Q. Zhang, R. Chai, G. Zhao, Y. Liu and Y. Lu, ChemCatChem, 2015, 7, 1427–1431 CrossRef CAS.
  19. Y. Li, Q. Zhang, R. Chai, G. Zhao, Y. Liu, Y. Lu and F. Cao, AIChE J., 2015, 61, 4323–4331 CrossRef CAS.
  20. J. Gao, L. S. Jia, W. P. Fang, Q. B. Li and H. Song, J. Fuel Chem. Technol., 2009, 37, 573–577 CrossRef CAS.
  21. Y. J. Su, K. L. Pan and M.-B. Chang, Int. J. Hydrogen Energy, 2014, 39, 4917–4925 CrossRef CAS.
  22. M. Morales, F. Espiell and M. Segarra, Int. J. Hydrogen Energy, 2014, 29, 6454–6461 CrossRef.
  23. S. M. de Lima, A. M. da Silva, L. O. O. da Costa, J. M. Assaf, G. Jacobs, B. H. Davis, L. V. Mattos and F. B. Noronha, Appl. Catal., A, 2010, 377, 181–190 CrossRef CAS.
  24. S. Takenaka, T. Shimizu and K. Otsuka, Int. J. Hydrogen Energy, 2004, 29, 1065–1073 CrossRef CAS.
  25. D. C. D. da Silva, S. Letichevsky, L. E. P. Borges and L. G. Appel, Int. J. Hydrogen Energy, 2012, 37, 8923–8928 CrossRef CAS.
  26. R. F. Wu, Y. Zhang, Y. Z. Wang, C. G. Gao and Y. X. Zhao, J. Fuel Chem. Technol., 2009, 37, 578–582 CrossRef CAS.
  27. G. Liu, Y. Geng, D. Pan, Y. Zhang, T. Niu and Y. Liu, Fuel Process. Technol., 2014, 128, 289–296 CrossRef CAS.
  28. J. Guo, Z. Hou, J. Gao and X. Zheng, Energy Fuels, 2008, 22, 1444–1448 CrossRef CAS.
  29. H. Sun, Y. Ding, J. Duan, Q. Zhang, Z. Wang, H. Lou and X. Zheng, Bioresour. Technol., 2010, 101, 953–958 CrossRef CAS PubMed.
  30. F. Liu, Y. Qu, Y. Yue, G. Liu and Y. Liu, RSC Adv., 2015, 5, 16837–16846 RSC.
  31. C. Guo, J. Zhang and X. Zhang, React. Kinet. Catal. Lett., 2008, 95, 89–97 CrossRef CAS.
  32. G. R. Moradi, M. Rahmanzadeh and F. Khosravian, J. CO2 Util., 2014, 6, 7–11 CrossRef CAS.
  33. P. Thangadurai, A. C. Bose and S. Ramasamy, J. Mater. Sci., 2005, 40, 3963–3968 CrossRef CAS.
  34. K. R. Reddy, T. Bhaskar and K. V. Chary, Langmuir, 2003, 19, 10795–10802 CrossRef CAS.
  35. V. M. Shinde and G. Madras, AIChE J., 2014, 60, 1027–1035 CrossRef CAS.
  36. R. Razzaq, C. Li, M. Usman, K. Suzuki and S. Zhang, Chem. Eng. J., 2015, 262, 1090–1098 CrossRef CAS.
  37. J. Gao, C. Jia, J. Li, F. Gu, G. Xu, Z. Zhong and F. Su, Ind. Eng. Chem. Res., 2012, 51, 10345–10353 CrossRef CAS.

This journal is © The Royal Society of Chemistry 2016