A phenazine-based near-infrared (NIR) chemodosimeter for cysteine obtained via a carbonyl-assisted cycloaddition process†
Yi Qu*a,
Xiao Zhangb,
Linlin Wanga,
Huiran Yangc,
Lin Yangb,
Jian Caoa and
Jianli Hua*b
aCollege of Chemistry and Chemical Engineering, Shanghai University of Engineering Science, 333 Longteng Road, Shanghai, 201620, PR China. E-mail: quyi@fudan.edu.cn; Fax: +86-21-67791216; Tel: +86-21-67791221
bKey Laboratory for Advanced Materials and Institute of Fine Chemicals, East China University of Science & Technology, 130 Meilong Road, Shanghai, 200237, PR China. E-mail: jlhua@ecust.edu.cn; Fax: +86-21-64252758; Tel: +86-21-64250940
cDepartment of Chemistry, Fudan University, 220 Handan Road, Shanghai, 200433, PR China
First published on 22nd February 2016
Abstract
A phenazine derivative with a succinimide endcap (PHS) was designed and synthesized for cysteine (Cys) with near-infrared (NIR) emission. Upon the addition of Cys, the color of the solution changed clearly from greenish black to orange, which was attributed to the disappeared absorbance at 616 nm. An enhanced NIR emission band at 670 nm was found in the fluorescence spectra and a corresponding excitation peak at 466 nm arose in the excitation spectra. Verified by the dynamic reaction, the cyanoacetic acid moiety should be susceptible to be attacked by the –SH group in a fast rate through Michael addition reaction. Being highly reactive to the amino group (–NH2), the NHS-active carbonyl site could target the amino acid and accelerate the process of nucleophilic attack from the –SH group. This cycloaddition mechanism of the α,β-unsaturated carbonyl NHS-ester was proved by 1H NMR titration. In addition to its good biocompatibility, PHS was successfully applied to the detection of Cys in Hela cell lines with NIR fluorescence signals.
Introduction
In recent years, progress in the development of small molecular sensors for small molecular biothiols has attracted considerable attention in the fields of supramolecular chemistry and biochemistry, due to fact that the small molecular biothiols have very important roles in the human body.1–3 Among them, cysteine (Cys) bears immense importance in many diseases, such as slowed growth in children, depigmentation of hair, edema, lethargy, liver damage, loss of muscle and fat, skin lesions, and weakness.4–9 Considering the different roles of the small molecular biothiols, precise detection with high sensitivity and good separating capacity is indispensable. Nowadays, different types of fluorescent sensors have been developed for high sensitivity of fluorescent signals with different advantages, such as good selectivity, higher photostability, lower cell toxicity.5,10–14 Among all of them, the chemodosimeter based on the chemical reaction between sensors and analyte is a very powerful strategy because of its highly specific reactivity.6,15 The selectivity of the chemodosimeter frequently is associated with the different configurations, the steric blocking effects of adjacent group and the activation energy of the reactions.16–18 For small molecular biothiols, it is a great challenge to develop such probes because of their similar structures and reaction. Therefore, much effort has been devoted to exploring new type of reaction between receptor and biothiols with higher reactive rate and selectivity. One of the most popular mechanisms is Michael addition reaction. The sensors reported can be classified into four reaction types, such as 1,1, 1,2, 1,3, 1,4 addition reactions based on different acceptors.15,19 Among them, the 1,4-addition reactions were always able to cause great optical signal variations contributed to great changes on conjugated systems.20 In the other hand, fluorophores with different emission and absorption wavelength have been developed for sensing biothiols, including BODIPY,21–23 coumarin,24 tetra-phenylethene,25,26 cyanine dyes,27 and so on. However, the phenazine-based dyes have seldom been considered in the sensing field of biothiols. Phenazine, as a well-known species of the ligand in the coordination complexes of platinum group metals (Ru, Re, Ir, Os etc.), shows a short emission wavelength in the visible region (<650 nm).28,29 Recently, tetraguanidino-functionalized phenazine, as the pure organic compound, shows the yellow to red emission and metal coordination capability with copper(I) and zinc(II) to output the turn off response.30 On demand of deeper penetration and lower phototoxicity, the exploring of near-infrared (NIR) emission dyes have attracted extensive attention. In our previous work, a new series of NIR fluorescent sensors for toxic anions were synthesized through conjugated the reduced phenazine with the strong electron-withdraw moieties.31,32 Based on this efficient design of NIR fluorophore, we developed a new phenazine-based chemodosimeter PHS in this work (Scheme 1). PHS can selective response to Cys and output the variable signals in NIR fluorescent emission (centered at about 670 nm), excitation spectra and colorimetric (greenish black to orange) channels. Compared to previous works, this probe reveals some valuable features: (1) a cyanoacetic moiety offers the α,β-unsaturated carbonyl structure to introduce the nucleophilic reaction center (α-site) and construct intramolecular charge transfer (ICT) process which output the NIR emission (the green moiety in Scheme 1); (2) the highly enantioselectivity of the net [4 + 3] cycloaddition33 was designed to afford 1,4-thiazepane which can optimize the selectivity of the sensor; (3) a NHS ester segment (the red segment in Scheme 1) was used to active the carboxylic acid for reacting with the –NH2 group of amino acids.Experimental
Materials and instruments
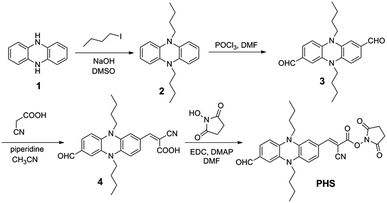
The synthesis routine of sensor PHS was showed in Scheme 2. All chemical reagents and solvents used in this paper were analytical grade and purchased from commercial suppliers. The compound 2 and 3 were prepared by our previous reports.31 1H NMR and 13C NMR spectra were recorded on the Bruker AV-400 spectrometer with chemical shifts reported in ppm (in CDCl3, TMS as internal standard) at room temperature. Mass spectra were measured on a Bruker micro TOF mass spectrometer and a Waters LCT Premier XE spectrometer. UV-vis absorption spectra were recorded on a Varian Cary 100 spectrophotometer. Fluorescence spectra were measured with an Edinburgh FS-5 Fluorescence spectrophotometer. Spectral-grade solvents were used for measurements of UV-vis absorption and fluorescence.Synthesis of compound 4
Compound 3 (300 mg, 0.85 mmol) and cyanoacetic acid (73 mg, 0.85 mmol) dissolved in 30 mL acetonitrile. And then 0.2 mL piperidine was added. The mixture was heated to 80 °C and stirred for 12 h. After the completion of the reaction, the mixture was allowed to cool to room temperature and then condensed under reduced pressure. The crude compound was purified by silica gel column chromatography with methylene dichloride/ethanol (5![[thin space (1/6-em)]](https://www.rsc.org/images/entities/char_2009.gif) :
:![[thin space (1/6-em)]](https://www.rsc.org/images/entities/char_2009.gif) 1, v/v) to give the dark red solid (110 mg, 30.5%). 1H NMR (400 MHz, DMSO-d6) δ (ppm): 9.57 (s, 1H), 7.75 (s, 1H), 7.19 (d, J = 8.7 Hz, 1H), 7.15 (s, 1H), 7.11 (d, J = 8.4 Hz, 1H), 6.66 (s, 1H), 6.46 (m, 2H), 3.45 (m, 4H), 1.58 (m, 4H), 1.42 (m, 4H), 0.96 (q, J = 7.3 Hz, 6H). 13C NMR (100 MHz, DMSO-d6) δ (ppm): 188.85, 169.21, 163.79, 148.20, 140.77, 138.38, 133.45, 132.97, 128.70, 128.14, 124.22, 117.98, 109.49, 109.16, 108.67, 107.03, 77.83, 58.62, 53.75, 18.18, 17.40, 12.54. MS (ESI, m/z): calcd for [M − H]+ C25H26N3O3+: 416.1974; found: 416.1980.
1, v/v) to give the dark red solid (110 mg, 30.5%). 1H NMR (400 MHz, DMSO-d6) δ (ppm): 9.57 (s, 1H), 7.75 (s, 1H), 7.19 (d, J = 8.7 Hz, 1H), 7.15 (s, 1H), 7.11 (d, J = 8.4 Hz, 1H), 6.66 (s, 1H), 6.46 (m, 2H), 3.45 (m, 4H), 1.58 (m, 4H), 1.42 (m, 4H), 0.96 (q, J = 7.3 Hz, 6H). 13C NMR (100 MHz, DMSO-d6) δ (ppm): 188.85, 169.21, 163.79, 148.20, 140.77, 138.38, 133.45, 132.97, 128.70, 128.14, 124.22, 117.98, 109.49, 109.16, 108.67, 107.03, 77.83, 58.62, 53.75, 18.18, 17.40, 12.54. MS (ESI, m/z): calcd for [M − H]+ C25H26N3O3+: 416.1974; found: 416.1980.
Synthesis of compound PHS
In a two-neck bottle, compound 4 (100 mg, 0.24 mmol), EDC·HCl (46 mg, 0.24 mmol) and DMAP (5.5 mg, 0.05 mmol) dissolved in 30 mL DMF. The solution was then cooled to 0 °C by an external ice bath and stirred for 15 min. Then, the ice bath was removed and the solution was stirring at room temperature for another 6 h. After the completion of the reaction, the DMF was removed under reduced pressure. Crude product was purified by silica gel column chromatography with methylene dichloride/ethanol (50![[thin space (1/6-em)]](https://www.rsc.org/images/entities/char_2009.gif) :
:![[thin space (1/6-em)]](https://www.rsc.org/images/entities/char_2009.gif) 1, v/v) to give the PHS (92 mg, 75.5%). 1H NMR (400 MHz, CDCl3) δ (ppm): 9.61 (s, 1H), 7.90 (s, 1H), 7.31 (d, J = 1.4 Hz, 1H), 7.17 (dd, J = 8.2, 1.4 Hz, 1H), 7.05 (dd, J = 8.4, 1.6 Hz, 1H), 6.80 (d, J = 1.3 Hz, 1H), 6.34 (d, J = 8.3 Hz, 1H), 6.25 (d, J = 8.5 Hz, 1H), 3.46 (m, 4H), 2.89 (s, 4H), 1.93 (dd, J = 12.5, 3.2 Hz, 2H), 1.50 (m, 4H), 1.04 (m, 6H). 13C NMR (100 MHz, CDCl3) δ (ppm): 189.57, 168.68, 160.09, 156.03, 143.73, 142.23, 135.11, 134.64, 134.03, 130.68, 130.26, 124.72, 115.66, 110.35, 110.11, 119.59, 109.29, 89.40, 46.19, 45.55, 29.67, 25.61, 20.01, 13.79. MS (ESI, m/z): calcd for [M + H]+ C29H31N4O5+: 515.2294; found: 515.2291.
1, v/v) to give the PHS (92 mg, 75.5%). 1H NMR (400 MHz, CDCl3) δ (ppm): 9.61 (s, 1H), 7.90 (s, 1H), 7.31 (d, J = 1.4 Hz, 1H), 7.17 (dd, J = 8.2, 1.4 Hz, 1H), 7.05 (dd, J = 8.4, 1.6 Hz, 1H), 6.80 (d, J = 1.3 Hz, 1H), 6.34 (d, J = 8.3 Hz, 1H), 6.25 (d, J = 8.5 Hz, 1H), 3.46 (m, 4H), 2.89 (s, 4H), 1.93 (dd, J = 12.5, 3.2 Hz, 2H), 1.50 (m, 4H), 1.04 (m, 6H). 13C NMR (100 MHz, CDCl3) δ (ppm): 189.57, 168.68, 160.09, 156.03, 143.73, 142.23, 135.11, 134.64, 134.03, 130.68, 130.26, 124.72, 115.66, 110.35, 110.11, 119.59, 109.29, 89.40, 46.19, 45.55, 29.67, 25.61, 20.01, 13.79. MS (ESI, m/z): calcd for [M + H]+ C29H31N4O5+: 515.2294; found: 515.2291.
Detection limited (DL) value
DL value was obtained through absorption, emission and excitation methods. The intensity data were normalized between the minimum intensity (zero free Cys) and the maximum intensity (16 μM free Cys). A linear regression curve was fitted to the several intermediate values. The point at which this line crossed the ordinate axis was taken as the detection limit.Live cell imaging
Hela cells were plated on 14 mm glass cover slips and allowed to adhere for 12 h. The cells were washed with PBS and then incubated solely with PHS in PBS (pH 7.4) for 15 min at 37 °C. On the other group, the cells were pre-treated with 1 mM NEM solution for 30 min. Then the PHS was added for another 15 min. Cell imaging was carried out after washing the cells with PBS.Cytotoxicity
The cytotoxicity was evaluated by performing methyl thiazolyl tetrazolium (MTT) assays on the Hela cells. At the first, Hela cell lines were seeded into a 96-well cell culture plate (1 × 10⁴ per well), and were cultured at 37 °C under 5% CO2 for 24 h. Then, the concentration-gradient of PHS (0–100 μM, diluted in RPMI 1640 medium) were added to the wells. These cell samples were subsequently incubated for another 24 h at 37 °C under 5% CO2. Furthermore, the MTT solution (5 mg mL−1) was added to each well and the 96-well plate was incubated for additional 4 h at 37 °C under 5% CO2. The optical density OD570 value (absorbance) of each well, with background subtraction at 690 nm, was measured by means of a Tecan Infinite M200 monochromator-based multifunction microplate reader. The inhibition of cell growth was calculated by the following formula: cell viability (%) = (mean of absorbance value of treatment group/mean absorbance value of control) × 100%.Results and discussion
Synthesis
Firstly, we synthesized the compound 4, the precursor of PHS, from aldehyde-containing phenazine, and cyanoacetic acid by Knoevenagel reaction. Through the reaction between compound 4 and NHS, the active site for amino group was introduced into 4, with a high yield of 75.5%. Then, the PHS was fully characterized by 1H NMR, 13C NMR and HRMS, as shown in the ESI (Fig. S1–S12†).Photophysical and dynamic properties
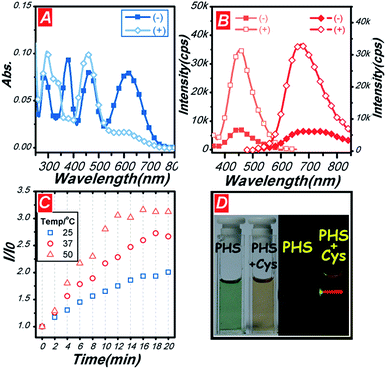
The photophysical properties of PHS were studied (Fig. 1). There were four absorption peaks at 300 nm, 378 nm, 452 nm, and 616 nm in DMSO/HEPES buffer solution (1/1, v/v, pH = 7.4). For the photo-excitation process, only the peak at 452 nm was found in the excitation spectrum with monitoring wavelength at 670 nm. As a result, we selected the excitation wavelength at 452 nm. Then, a NIR emission band around 700 nm was obtained in Fig. 1B. With the addition of Cys, the absorption, excitation and emission peaks showed obvious changes, which were caused by decreased intramolecular charge transfer (ICT) process.Furthermore, the reaction kinetics of PHS to PHS′ was studied to evaluate the sensing performance. The conversion time of the process was recorded at different reaction temperatures at 25 °C, 37 °C, and 50 °C (Fig. 1C). After reacting for 16 min at 25 °C, the conversion of PHS to PHS′ reached 48%. When reacting at 37 °C and 50 °C, the conversion of 65% and 79% was obtained after 16 min, respectively. The 37 °C and 16 min duration was considered an optimal balance among the sensitivity, cell imaging and convenience. Furthermore, distinct color and fluorescence changes can be found in Fig. 1D.
After 1 eq. of Cys addition, the color was transfer from greenish black to orange and the red emission was found under excitation at 532 nm continue wave (CW) laser.
Sensing mechanism
To validate the recognition mechanism of PHS to Cys, the 1H NMR titration experiments were performed (Fig. 2). When 2 eq. of Cys was added into the solution of PHS, the signal for the proton of Ar–CH![[double bond, length as m-dash]](https://www.rsc.org/images/entities/char_e001.gif) diminished, while two new peaks at 5.1 ppm and 4.2 ppm appeared, attributing to Ar–CHa–CHb– (marked by blue and pink circles in Fig. 2B and C). The change of the chemical shift to high field was caused by the decreased conjugation. Different from the spectrum of Cys (Fig. 2A), the NHS–OH signal was found at high field (arrows in Fig. 2B and C). The results verified that the sensing mechanism of PHS as the probe for Cys was due to the formation of NHS-ester assistant cycloaddition derivative.
diminished, while two new peaks at 5.1 ppm and 4.2 ppm appeared, attributing to Ar–CHa–CHb– (marked by blue and pink circles in Fig. 2B and C). The change of the chemical shift to high field was caused by the decreased conjugation. Different from the spectrum of Cys (Fig. 2A), the NHS–OH signal was found at high field (arrows in Fig. 2B and C). The results verified that the sensing mechanism of PHS as the probe for Cys was due to the formation of NHS-ester assistant cycloaddition derivative.
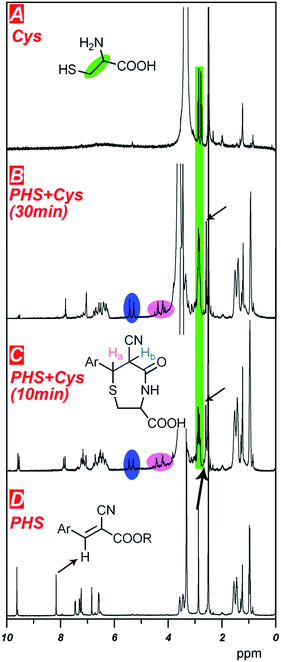 | ||
| Fig. 2 1H NMR titration of PHS with Cys (A) Cys; (B) PHS + Cys for 30 min; (C) PHS + Cys for 10 min; (D) PHS (solvent: DMSO-d6). | ||
Sensing properties
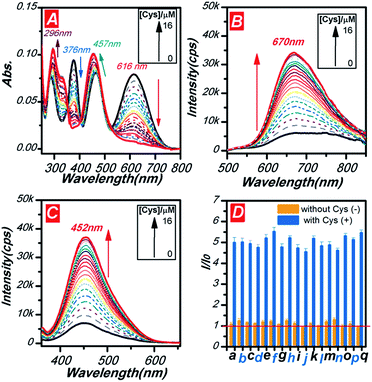
The sensitivity of PHS was performed through tuning the amount of Cys from 0 to 1.6 eq. in the solution of PHS (10 μM, DMSO/HEPES buffer solution (1/1, v/v, pH = 7.4)). As shown in Fig. 3A, as the amount of Cys increased, the absorbance at 378 nm and 616 nm decreased gradually with the rising peaks at 296 nm and 452 nm. With the band at 616 nm diminishing, the colour of the solution turned from greenish black to orange assigned to the absorbance at 452 nm. It should be noted that the ratio of the absorbance at these four peaks showed good concentration dependence. The ratiometric linear response was ranged from 0 to 6 μM in Fig. S13a† and a low detection limited (DL) value of 0.44 μM (at A616 nm) was obtained in Fig. S13b.† The PL spectra can also monitor the concentration of Cys with a high sensitivity of about 5-fold enhancement signals at 670 nm with 1 eq. of Cys added in the solution (Fig. 3B). The linear response was ranged from 0 to 6 μM monitoring at 670 nm. The DL value reached 0.37 μM (at I670 nm) in the fluorescent channel, which higher than the colorimetric channel (Fig. S14†).Moreover, there was one interesting phenomenon that the absorption decreased while the emission increased. The excitation spectra were used to explore how the “turn on” type response of fluorescence happened. When monitoring at 670 nm, the excitation spectra showed only one enhanced peak at 452 nm (Fig. 3C). According to the previous studies and the principles of photophysics, we proposed that: (1) the emission at around 670 nm was assigned to the aldehyde attached phenazine, which was also confirmed by our previous research;26 (2) the absorbance at 616 nm ascribed to another ICT structure of cyanoacetic acid conjugated phenazine; (3) an effective FRET process occurred due to the overlap of the absorption and emission spectra; (4) the conversion from PHS to PHS′ broke the ICT structure of cyanoacetic acid and triggered the NIR emission at 670 nm. The intensity related plot of PHS (Fig. S15†) also showed good linear response from 0 to 6 μM and a DL value as low as 0.39 μM (at I452 nm).
To determine the specificity of common amino acids, we subjected PHS (10 μM) to each of the other seventeen amino acids as shown in Fig. 3d (yellow bar). Then, 10 μM of Cys was added into these samples to evaluate the interference of other amino acids (blue bar in Fig. 3D). Almost no response was found in other amino acids and the deviations from their interference are less than 7% in the concomitant amino acids' test. These results indicated that PHS could be used in biological mixture for Cys detection.
Biosensing and MTT experiments
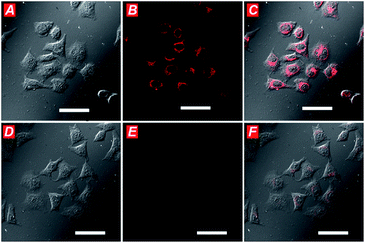
NIR emission probe is a powerful tool for evaluating the real time status of biological samples. The spectroscopic properties of PHS, as well as its specificity for Cys, seemed appropriate for cellular application, so we next studied the suitability of PHS for bioimaging of cellular Cys. Firstly, the cells were incubated with PHS (10 μM) for 15 min and then washed by PBS buffer.With the reaction between PHS and Cys, a large intracellular fluorescence enhancement was observed in the NIR channel ranging from 650 to 750 nm (Fig. 4A–C). While the N-ethylmaleimide (NEM) was used to scavenge the cellular Cys, no significant fluorescence increment was seen after treating with 10 μM PHS (Fig. 4D–F). Furthermore, the cytotoxicity of PHS in Hela cells was examined using the MTT (3-(4,5-dimethylthiazol-2-yl)-2,5-diphenyl-2H-tetrazolium bromide) assay. As shown in Fig. S16,† adverse effects of PHS on cell viability were minimal within the range of 0–20 μM (cell viability > 90%).
Conclusions
In summary, we have developed a new phenazine-based NIR fluorescent sensor for Cys, PHS, based on cyclization process which was activated by the NHS-ester moiety. PHS can detect Cys in aqueous solution with high sensitivity. The detection limits of PHS were lower than 0.44 μM, 0.37 μM and 0.39 μM in absorption, emission and excitation methods, respectively. Moreover, PHS emitted enhanced NIR fluorescence around 670 nm, which showed excellent rapid sensing in “turn on” mode. In addition, PHS also showed good selectivity and anti-interference ability towards other amino acids. We also confirmed that PHS could image the cellular Cys with low cytotoxicity. As a result, PHS can be anticipated as useful probing materials in the field of biosensing and bioimaging.Acknowledgements
This work was partially supported by the National Basic Research 973 Program (2013CB733700), NSFC/China (21172073, 21372082, 21572062 and 21404068), Dr Qu thanks the talent programs from Shanghai Education Commission (ZZGCD15029) and SUES. We are also grateful to Prof. Fuyou Li of the Fudan University and Prof. A. P. deSilva of Queen's University Belfast for intelligent discussions. The CLSM research is also indebted to Prof. Li's laboratory.Notes and references
- M. H. Lee, J. H. Han, P.-S. Kwon, S. Bhuniya, J. Y. Kim, J. L. Sessler, C. Kang and J. S. Kim, J. Am. Chem. Soc., 2012, 134, 1316–1322 CrossRef CAS PubMed.
- M. H. Lee, J. Y. Kim, J. H. Han, S. Bhuniya, J. L. Sessler, C. Kang and J. S. Kim, J. Am. Chem. Soc., 2012, 134, 12668–12674 CrossRef CAS PubMed.
- D. Yu, Q. Zhang, S. Ding and G. Feng, RSC Adv., 2014, 4, 46561–46567 RSC.
- S. Shahrokhian, Anal. Chem., 2001, 73, 5972–5978 CrossRef CAS PubMed.
- X. Xiong, L. Zheng, J. Yan, F. Ye, Y. Qian and F. Song, RSC Adv., 2015, 5, 53660–53664 RSC.
- A. Singh, A. Singh, N. Singh and D. O. Jang, RSC Adv., 2015, 5, 72084–72089 RSC.
- J. Liu, Y.-Q. Sun, H. Zhang, Y. Huo, Y. Shi, H. Shi and W. Guo, RSC Adv., 2014, 4, 64542–64550 RSC.
- J. K. Choi, G. Sargsyan, B. D. Johnson and M. Balaz, RSC Adv., 2015, 5, 15916–15922 RSC.
- Y. Kim, M. Choi, S. Seo, S. T. Manjare, S. Jon and D. G. Churchill, RSC Adv., 2014, 4, 64183–64186 RSC.
- X. Chen, Y. Zhou, X. Peng and J. Yoon, Chem. Soc. Rev., 2010, 39, 2120–2135 RSC.
- Y. Zhou and J. Yoon, Chem. Soc. Rev., 2012, 41, 52–67 RSC.
- H. S. Jung, X. Chen, J. S. Kim and J. Yoon, Chem. Soc. Rev., 2013, 42, 6019–6031 RSC.
- M. H. Lee, H. M. Jeon, J. H. Han, N. Park, C. Kang, J. L. Sessler and J. S. Kim, J. Am. Chem. Soc., 2014, 136, 8430–8437 CrossRef CAS PubMed.
- X. Lou, Y. Zhang, S. Li, D. Ou, Z. Wan, J. Qin and Z. Li, Polym. Chem., 2012, 3, 1446–1452 RSC.
- C. Yin, F. Huo, J. Zhang, R. Martinez-Manez, Y. Yang, H. Lv and S. Li, Chem. Soc. Rev., 2013, 42, 6032–6059 RSC.
- Z. Dai, L. Tian, Z. Ye, B. Song, R. Zhang and J. Yuan, Anal. Chem., 2013, 85, 11658–11664 CrossRef CAS PubMed.
- M. Zhang, M. Yu, F. Li, M. Zhu, M. Li, Y. Gao, L. Li, Z. Liu, J. Zhang, D. Zhang, T. Yi and C. Huang, J. Am. Chem. Soc., 2007, 129, 10322–10323 CrossRef CAS PubMed.
- L. Zhao, J. Peng, M. Chen, Y. Liu, L. Yao, W. Feng and F. Li, ACS Appl. Mater. Interfaces, 2014, 6, 11190–11197 CAS.
- J. Liu, Y.-Q. Sun, Y. Huo, H. Zhang, L. Wang, P. Zhang, D. Song, Y. Shi and W. Guo, J. Am. Chem. Soc., 2014, 136, 574–577 CrossRef CAS PubMed.
- F.-J. Huo, Y.-Q. Sun, J. Su, J.-B. Chao, H.-J. Zhi and C.-X. Yin, Org. Lett., 2009, 11, 4918–4921 CrossRef CAS PubMed.
- M. Isik, T. Ozdemir, I. S. Turan, S. Kolemen and E. U. Akkaya, Org. Lett., 2013, 15, 216–219 CrossRef CAS PubMed.
- F. Wang, L. Zhou, C. Zhao, R. Wang, Q. Fei, S. Luo, Z. Guo, H. Tian and W.-H. Zhu, Chem. Sci., 2015, 6, 2584–2589 RSC.
- F. Wang, J. An, L. Zhang and C. Zhao, RSC Adv., 2014, 4, 53437–53441 RSC.
- L. Yuan, W. Lin and Y. Yang, Chem. Commun., 2011, 47, 6275–6277 RSC.
- S. Chen, Y. Hong, J. Liu, N.-W. Tseng, Y. Liu, E. Zhao, J. W. Yip Lam and B. Z. Tang, J. Mater. Chem. B, 2014, 2, 3919–3923 RSC.
- J.-P. Xu, Z.-G. Song, Y. Fang, J. Mei, L. Jia, A. J. Qin, J. Z. Sun, J. Ji and B. Z. Tang, Analyst, 2010, 135, 3002–3007 RSC.
- Z. Guo, S. Nam, S. Park and J. Yoon, Chem. Sci., 2012, 3, 2760–2765 RSC.
- C. A. Puckett and J. K. Barton, J. Am. Chem. Soc., 2009, 131, 8738–8739 CrossRef CAS PubMed.
- C. A. Puckett and J. K. Barton, J. Am. Chem. Soc., 2007, 129, 46–47 CrossRef CAS PubMed.
- E. Bindewald, R. Lorenz, O. Hubner, D. Brox, D.-P. Herten, E. Kaifer and H.-J. Himmel, Dalton Trans., 2015, 44, 3467–3485 RSC.
- L. Yang, X. Li, J. Yang, Y. Qu and J. Hua, ACS Appl. Mater. Interfaces, 2013, 5, 1317–1326 CAS.
- L. Yang, X. Li, Y. Qu, W. Qu, X. Zhang, Y. Hang, H. Ågren and J. Hua, Sens. Actuators, B, 2014, 203, 833–847 CrossRef CAS.
- Y. Fukata, K. Asano and S. Matsubara, J. Am. Chem. Soc., 2015, 137, 5320–5323 CrossRef CAS PubMed.
Footnote |
| † Electronic supplementary information (ESI) available: Characterization data: 1H NMR, 13C NMR, MS, details of supplemental spectra. See DOI: 10.1039/c5ra26784f |
| This journal is © The Royal Society of Chemistry 2016 |


