Development of an advanced chemical oxidation wastewater treatment system for the batik industry in Malaysia

Archina Buthiyappan, Abdul Aziz Abdul Raman* and Wan Mohd Ashri Wan Daud
Department of Chemical Engineering, Faculty of Engineering, University of Malaya, 50603 Kuala Lumpur, Malaysia. E-mail: azizraman@um.edu.my; Fax: +60 3 79675319; Tel: +60 3 79675300

Received 15th December 2015 , Accepted 28th February 2016

First published on 1st March 2016


Abstract

The batik industry is operated as a cottage industry due to variation in the designs and demand of batik. Batik is considered an art. However, the batik industry consumes a large volume of water and produces a large amount of wastewater that contains grease, resin, surfactants, wax, suspended solids and dyes. Hence, this industry requires treatment systems, which are inexpensive, simple, safe to operate, energy efficient, do not require skilled workers and do not produce secondary pollutants. In this regard, AOPs characterized by the production of highly reactive radicals, which are able to degrade most of the recalcitrant organic pollutants, have been found to fulfil the requirement. The Fenton process is one of the low-cost, low-footprint, simple and less complicated AOPs that can be used to treat effluent that has a high COD. At the optimal conditions (room temperature, undiluted contaminants), 81.4% COD, 70.5% TOC and 99.6% color removal were obtained within an hour by the Fenton process. The samples were analyzed using FTIR, GC-MS and HPLC, which confirmed the superiority of the Fenton process. The GC/MS analysis revealed that the Fenton process successfully removed 71% of organic compounds. Sludge characterization by SEM and particle size distribution showed that the Fenton generated sludge achieved suitable disposal qualities.

1. Introduction

The batik industry is the biggest cottage industry in Malaysia with an annual turnover of around RM 160 million and it has been commercialized and it contributes positively to the economic growth of Malaysia.1 The batik-making business is normally a family business. The conventional batik making process is illustrated in Fig. 1. This industry consumes much water and produces wastewater rich in color (dyes), resin, grease, surfactants (sodium silicate), wax, and suspended solids.2 This wastewater is characterized by high colour content, chemical oxygen demand (COD), biological oxygen demand (BOD), total suspended solids (TSS), total dissolve solids (TDS) and recalcitrant contaminants. This industry has a high pollution potential because of its unregulated nature, spatial location, lack of in-house environmental control and nature of its emissions. In view of the harmful impacts of wastewater on the environment and society, the Malaysian government has imposed stringent limits on the quality of discharged wastewater.3 The conventional wastewater treatment processes for the textile industry are not capable of degrading many of the dyes present in industrial effluents.4–6 Therefore, considerable efforts are being made to find an effective and economically feasible wastewater treatment system with high efficiency to remove the recalcitrant compounds.
image file: c5ra26775g-f1.tif
Fig. 1 Processes involved in batik industry.

Among the treatment techniques that have been investigated to reduce the organic contaminants to a safe and acceptable state, Advanced Oxidation Processes (AOPs) have the potential to treat wastewater contaminated with toxic and biorefractory organic compounds. Fenton oxidations, photocatalysis, UV/H2O2, sonolysis and ozonation are the most commonly used AOPs techniques.7–16 In this context, Fenton oxidation has been proposed as a promising alternative technology for the batik wastewater treatment at room temperature and pressure, particularly for the degradation of non-biodegradable and toxic components to H2O, CO2 and inorganics.17–20 Fenton system is effective in degrading various recalcitrant compounds by using highly oxidative hydroxyl radicals and rapid oxidation kinetics with a cheap and easily maintained operating system.16,21–23 It should be noted that very limited studies have been conducted on the Fenton reaction using real wastewater. Torrades and García-Montaño (2014) are among the few researchers who have conducted such studies. They have investigated the use of Fenton reagent and UV-irradiation for treating real dye wastewater from a Spanish textile manufacturer in one of their studies at laboratory scale and reported that 120 min of treatment resulted in a 62.9% and 76.3% reduction in the chemical oxygen demand after the Fenton and photo-Fenton treatments, respectively at the optimum conditions.19

In the present study, the efficiency of the Fenton system to treat real batik wastewater was investigated. In the Fenton oxidation process, pollutants removal highly depends on the initial pH of wastewater, dosage of H2O2 and Fe2+, and initial concentration of pollutants. It should be noted that most of the available studies only focus on the decolourization efficiency, not the mineralization or degradation efficiencies to represent the effectiveness of the Fenton process. In this work, we focused on both the degradation and mineralization efficiencies. We also evaluated the characteristics of Fenton's sludge since it is the main limitation of practical application of the Fenton process. Besides, intermediate study was also conducted before and after the treatment by using FTIR, GC/MS and HPLC. to check the superiority of the Fenton process. Each operating parameter was evaluated by using Central Composite Design (CCD), a commonly used form of Response Surface Methodology (RSM). Then, the model developed for the textile wastewater was further validated using the other types of real wastewater with low, medium and high COD values. The results showed that the Fenton oxidation process could successfully treat the batik wastewater. This work does not only open up a new avenue for the application of the Fenton process in treating the batik wastewater, but also gives information on the by-products that can possibly be formed as a result of excessive chemicals.

2. Materials and methods

2.1. Wastewater collection and characterization

The wastewater samples were provided by a local batik manufacturer (Institut Kraf Negara, Rawang, Malaysia). Sampling bottles were rinsed with samples before the collection was done. The samples were manually collected in a 30 l-plastic container and preserved in the refrigerator at 4 °C in accordance with the standard method. The physico-chemical characteristics of the wastewater were studied in terms of the pH value, chemical oxygen demand (COD), total organic carbon (TOC), suspended solids and color (ADMI unit). The main characteristics of the wastewater are presented in Table 1. It exemplifies that the batik wastewater was a dark-colour wastewater with a high content of organic compounds. Besides, a large number of organic compounds, such as benzenes, esters, hydrocarbons, and alkyl halide were detected in the batik wastewater via GC-MS.
Table 1 Characteristics of batik effluent
Parameters Mean value ± standard deviation
COD (mg l−1) 1600–1900 ± 15 mg l−1
TOC (mg l−1) 170 ± 15 mg l−1
Color (ADMI) 1500 ± 50
pH 12.5 ± 2
Appearance Dark blue


2.2. Materials

All chemicals used in the present study were of analytical grade and used without further purification. Sodium hydroxide (NaOH), hydrogen peroxide (H2O2, 30%, w/v), ferrous sulphate heptahydrate (Fe2SO4·7H2O), sulphuric acid (H2SO4) and all other reagents were purchased from Merck & Co and Sigma-Aldrich. Deionized water, from a Millipore Milli-Q system, was used to prepare all solutions.

2.3. Experimental design and statistical analysis

Conventional approaches such as one-factor-at-time (OFAT) studies the effects of one variable at one time while the other variables are constant. OFAT is time-consuming, challenging and not economically viable with no capability to detail the interaction among the studied parameters.24 Design of experiments (DOE) is an optimization tool that produces regression models by combining the individual effects of different variables and their interactions by using the minimum number of experiments.

In this study, DOE was used to predict the values of COD, TOC and color removals. Response Surface Methodology (RSM) has recently been used to study the effects of several independent variables on COD removal efficiency.25–31 RSM, in comparison to the other modeling techniques, offers several advantages such as less experiments, clearly interprets the operating parameters, high cost efficiency and provides detailed information on the interaction between the parameters and responses.10,32,33

In this context, Central Composite Design (CCD) was employed to design and optimize the experiments for the Fenton oxidation process. The mass ratios of H2O2[thin space (1/6-em)]:[thin space (1/6-em)]COD and H2O2[thin space (1/6-em)]:[thin space (1/6-em)]Fe2+, initial pH and retention time were chosen as the independent variables while COD, TOC, color removal percentages were the response variables. All the response variables are represented by a second-order polynomial equation that correlates response surfaces for evaluating the experimental results. The second-order polynomial equation (quadratic equation) is as follows:

 
image file: c5ra26775g-t1.tif(1)
where, y is the response value, xi is the coded value of the factor, β0 is the constant, βi is the linear coefficient, βii is the quadratic coefficient and βij is the interaction coefficient. Multiple linear regression analysis was conducted to estimate the coefficient parameters while 3D and 2D contour plots of the response models were used to study the interaction among the variables.

2.4. Experimental conditions

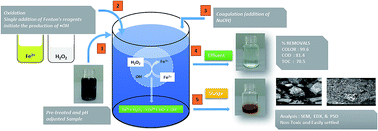
The Fenton process was carried out in a 500 ml-Erlenmeyer flask containing 100 ml of real textile wastewater equipped with a magnetic stirrer. The initial pH of the wastewater was adjusted to the desired level by using 1 M NaOH or 0.5 M H2SO4 solution. A defined quantity of Fe2+ catalyst was added in the form of FeSO4·7H2O into the pH-adjusted samples and the samples were stirred continuously at 250 rpm. The Fenton reaction was initiated by adding a defined amount of H2O2 oxidant based on the mass ratios of H2O2[thin space (1/6-em)]:[thin space (1/6-em)]COD and H2O2[thin space (1/6-em)]:[thin space (1/6-em)]Fe2+. After the reaction ended, the pH of the solution was measured and a sufficient amount of 1 M NaOH solution was added to adjust the pH level to 12 to stop the reaction. This was because Fe2+ precipitates as Fe3+ and H2O2 decomposes to H2O and oxygen at higher pH values, which results in the quenching of the reaction. In the Fenton oxidation process, addition of NaOH is important because it helps avoid the interference of H2O2 in the COD measurement. After a settling time of half an hour, samples were taken and filtered through 0.45 μm filter papers (Millipore, USA) to remove the sludge (ferric hydroxide precipitation). All the experiments were performed at room temperatures and atmospheric pressures. The procedures are illustrated step-by-step in Fig. 2. For the development of the Fenton oxidation process, batch experiments were performed using hydrogen peroxide as the oxidant and ferrous iron as the catalyst. All experiments were replicated to ensure the data quality.
image file: c5ra26775g-f2.tif
Fig. 2 Pictorial step-by-step procedure of the Fenton oxidation process.

2.5. Analytical determination

All the analyses were performed according to the procedures described in the standard method (ALPHA). All physicochemical parameters were measured for each treated and untreated wastewater sample. 2 ml of the samples were filled into the COD test cells supplied by Merck and heated in a thermo reactor (Spectroquant TR 420) for 120 minutes at 140 °C followed by subsequent measurement by a UV-spectrophotometer according to the standard method. The COD removal efficiency was calculated as follows:
 
image file: c5ra26775g-t2.tif(2)

A Total Organic Carbon (TOC) analyser (Shimadzu, Japan) was used to measure the TOC concentration in the solutions. The analysis was conducted to assess the extent the organic components were decomposed into CO2. The mineralization of the samples was analysed using the combustion/non-dispersive infrared gas analysis method. The TOC removal efficiency was calculated as:

 
image file: c5ra26775g-t3.tif(3)

The color was measured after filtration using a UV-Spectrophotometer (Spectroquant Pharo 300, Merck, Germany) in ADMI unit. The decolorization efficiency of the treated sample was calculated as follows:

 
image file: c5ra26775g-t4.tif(4)

The gas chromatography/mass spectrometry (GC-MS) analyses were performed using Agilent Technologies 6890 gas chromatograph, equipped with an HP-5MS column (30 m × 0.25 mm i.d. × 0.25 mm), coupled to an MSD 5973 selective mass detector (Agilent Technologies). A split–splitless injector was used under the following conditions: an injection volume of 5 μl and an injector temperature of 250 °C. The program temperature was 4 min at 105 °C, 25 °C min−1 to 180 °C, 5 °C min−1 to 230 °C, and 30 °C min−1 to 260 °C. The analyses were performed using the electron impact ionization (EI) mode at 70 eV. The spectrometer detector was run in a full-scan mode from 50 to 500 amu. The temperature of the MS interface and the ionization source was fixed at 280 °C and 250 °C, respectively. The decomposition of intermediates were determined by high performance liquid chromatography (HPLC) using Agilent Technology 1200 series. C18 column (4.6 mm × 250 mm × 5 μm) at 20 °C was used as the separation column. The eluent used was 60% acetonitrile/40% water (v/v); the injection volumes were 10 ml, and the eluent flow rate was 1 ml min−1. The detection wavelength was set at 254 nm.

The unique characteristics of the treated and untreated samples were presented by the Fourier transform infrared (FTIR) spectrum of the solution and recorded using FTIR (Perkin Elmer Spectrum One FTIR Spectrometer). In the present study, the attenuated total reflection (ATR) technique in the mid infrared region (MIR) of 4000–400 cm−1 was used for the characterization and assessment. In this work, surface morphology and composition of the sludge were analyzed using the 122 Phenom ProX SEM. The surface area method was used to calculate the percentage composition of the sludge generated. Particle size distribution (PSD) of the treated effluent with sludge (non-filtered sample) was measured by Malvern Mastersizer 2000, which works on the principle of laser detraction. Malvern Mastersizer can measure particles in the size range of 0.02 μm to 2000 μm. The process was fully automated and the results were based on the standard operating procedures provided by the manufacturer to eliminate user-to-user variability.

3. Results and discussion

3.1. Fitting the response surfaces and statistical analysis

Full factorial Central Composite Design (CCD), a widely used form of RSM was used to study the effects of four operating parameters (single and combined effects) on the efficiency of the Fenton oxidation process. Preliminary experiments were conducted to develop the experimental design to estimate the range of the variables. The effects of excess amount of hydrogen peroxide and iron salts on the color removal, degradation and mineralization efficiencies were studied. The performance of the Fenton system depends on various factors including initial pH of the solution, amount of H2O2, dosage of Fe2+, retention time, temperature, mixing speed and initial value of COD or concentration of wastewater.17,18,34,35 It would require a large number of experimental runs if all these variables were considered in the experimental design.

It is known that pH is one of the most important factors in the Fenton oxidation process.36 Various optimized pH values are observed in a few previous studies and some synthetic dyes are found to be efficient in both the basic and neutral conditions.37 Nevertheless, most of the studies have reported that Fenton process is ideal in acidic conditions.38 It has been reported that pH of the reaction is highly dependent on the property of the pollutants. Since this research focused on real textile effluents that comprise various components, the pH of the solution was varied from very acidic to basic conditions (initial pH values of 2 to 9).

The main aim of the study was to reduce the treatment cost by reducing energy consumption. All the experiments were conducted at room temperature (298 K). Oxidation and coagulation can take place simultaneously in the Fenton process and this is the major advantage. The mixing speed of the system also affects the solubility of iron salts and the reaction rate. In order to identify the best mixing speed, preliminary experiments were conducted in the range of 50–300 rpm. The COD removal efficiency was observed to increase with the mixing speed till 250 rpm, and no significant changes were observed at 300 rpm. Therefore, 250 rpm was selected as the optimized mixing speed and made constant during the course of the treatment process.

Since real textile effluent was used, initial chemical oxygen demand ([COD]i) was selected instead of concentrations. The value of [COD]i was varied between 1600–1900 mg l−1 and dependent on the samples collected from the batik industry.

Four operating factors were selected as the control factors to study the degradation efficiency of textile effluents: mass ratios of H2O2[thin space (1/6-em)]:[thin space (1/6-em)]COD and H2O2[thin space (1/6-em)]:[thin space (1/6-em)]Fe2+, initial pH of the solution and retention time of the reaction. A total of 30 experiments was carried out in this analysis in accordance with the model indicated by the CCD. The selected range of the operating parameters and level of the independent variables are given in Table 2. The selected design required experiments outside the experimental range to allow the prediction of the response functions outside the selected range. The COD, TOC and color removal percentages were chosen as the response variables because they could provide necessary information for evaluating the analytical performance.

Table 2 Experimental design of batik wastewater for Fenton process
Independent variable Units Coded levels
    −2 −1 0 +1 +2

Independent variable Units Actual levels
H2O2[thin space (1/6-em)]:[thin space (1/6-em)]COD w/w 4.5 1 6.5 12 17.5
H2O2[thin space (1/6-em)]:[thin space (1/6-em)]Fe2+ w/w 4.5 2 8.5 15 21.5
pH 1.5 2 5.5 9 12.5
Retention time min 0 30 60 90 120


The responses based on the experimental runs on color, COD and TOC removal percentages proposed by CCD are given in the Table 3. The results presented in the table are the duplicates of the experimental results at each operating condition proposed by CCD. Based on the results obtained from the experimental runs, the second-order polynomial equation was used to correlate the experimental results with the response functions. Polynomial models are commonly used to describe the behavior of the complex systems due to their good interpolation ability and simplicity of the parameter estimation.

Table 3 Observed results corresponding to RSM design by Fenton oxidation process for batik wastewater
Run Block Independent variable Responses (%)
H2O2[thin space (1/6-em)]:[thin space (1/6-em)]COD H2O2[thin space (1/6-em)]:[thin space (1/6-em)]Fe2+ pH RT (min) COD TOC CR
1 Block 1 12 2 9 90 71.5 53.5 98
2 Block 1 1 2 9 30 57.2 49.2 78
3 Block 1 1 2 2 90 52.7 50.3 77
4 Block 1 6.5 8.5 5.5 60 76.1 64.1 96
5 Block 1 6.5 8.5 5.5 60 75.4 65.8 96
6 Block 1 12 15 2 90 50.4 35.8 85
7 Block 1 1 15 9 90 60.1 45.1 84
8 Block 1 1 15 2 30 62.4 52.4 86
9 Block 1 12 15 9 30 52.7 36.2 88
10 Block 1 12 2 2 30 74.2 61 90
11 Block 2 12 2 9 30 70.8 55.8 96
12 Block 2 1 15 9 30 60.4 52 83
13 Block 2 12 2 2 90 73.2 62.1 83
14 Block 2 1 15 2 90 62.3 50.1 90
15 Block 2 1 2 9 90 61.6 48.2 79
16 Block 2 1 2 2 30 56.3 48.4 75
17 Block 2 12 15 9 90 49.5 28.7 90
18 Block 2 6.5 8.5 5.5 60 76.4 63.9 97
19 Block 2 12 15 2 30 54.5 37.1 87
20 Block 2 6.5 8.5 5.5 60 74.3 65.2 98
21 Block 3 6.5 8.5 5.5 120 62.2 38.2 95
22 Block 3 6.5 8.5 12.5 60 35.3 22.3 80
23 Block 3 17.5 8.5 5.5 60 76.8 60.3 95
24 Block 3 6.5 21.5 5.5 60 62.6 48.3 88
25 Block 3 6.5 −4.5 5.5 60 78.3 68.2 85
26 Block 3 6.5 8.5 5.5 60 74.6 61.9 96
27 Block 3 6.5 8.5 −1.5 60 41.5 33.1 73
28 Block 3 −4.5 8.5 5.5 60 70.2 62.8 86
29 Block 3 6.5 8.5 5.5 0 56.2 39.2 95
30 Block 3 6.5 8.5 5.5 60 74.3 62.9 96


Based on the experimental results, the final quadratic equation of the response in term of coded factors is presented in eqn (5)–(7), as shown in Table 4. The negative and positive values of the coefficients represent the antagonistic and synergistic effect of each model term on the response respectively. Positive effect means that the COD removal efficiency increases with factors while negative effect indicates that the response decreases when the factor level increases. The equations correlate the response variables as a function of the operating factors and a bad equation will result in poor lack-of-fit and violation of the analysis of variance (ANOVA) assumptions. The ANOVA results of the quadratic polynomial models for the Fenton oxidation treatment for the color, COD and TOC models are shown in ESI as Table S1. The equation clearly shows that all the four operating parameters had positive effects on the COD, TOC and color removal percentages within the investigated range.

Table 4 ANOVA results of the quadratic polynomial models for Fenton oxidation treatment for percent color, COD and TOC model
Responses Proposed quadratic model Eqn
COD% =28.07 + 1.92 (H2O2[thin space (1/6-em)]:[thin space (1/6-em)]COD) + 0.88 (H2O2[thin space (1/6-em)]:[thin space (1/6-em)]Fe2+) + 8.14 (pH) + 0.56 (RT) − 0.17 (H2O2[thin space (1/6-em)]:[thin space (1/6-em)]COD × H2O2[thin space (1/6-em)]:[thin space (1/6-em)]Fe2+) − 0.04 (H2O2[thin space (1/6-em)]:[thin space (1/6-em)]COD × pH) − 0.04 (H2O2[thin space (1/6-em)]:[thin space (1/6-em)]Fe2+)2 − 0.74 (pH)2 − 0.005 (RT)2 (5)
TOC% =11.80 + 1.50 (H2O2[thin space (1/6-em)]:[thin space (1/6-em)]COD) + 1.081 (H2O2[thin space (1/6-em)]:[thin space (1/6-em)]Fe2+) + 8.23 (pH) + 0.88 (RT) − 0.17 (H2O2[thin space (1/6-em)]:[thin space (1/6-em)]COD × H2O2[thin space (1/6-em)]:[thin space (1/6-em)]Fe2+) − 0.049 (H2O2[thin space (1/6-em)]:[thin space (1/6-em)]COD × pH) − 0.01 (H2O2[thin space (1/6-em)]:[thin space (1/6-em)]Fe2+ × RT) − 0.01 (pH × RT) − 0.027 (H2O2[thin space (1/6-em)]:[thin space (1/6-em)]Fe2+)2 − 0.72 (pH)2 − 0.01 (RT)2 (6)
Color% =63.30 + 1.55 (H2O2[thin space (1/6-em)]:[thin space (1/6-em)]COD) + 2.24 (H2O2[thin space (1/6-em)]:[thin space (1/6-em)]Fe2+) + 5.11 (pH) − 0.09 (H2O2[thin space (1/6-em)]:[thin space (1/6-em)]COD × H2O2[thin space (1/6-em)]:[thin space (1/6-em)]Fe2+) + 0.10 (H2O2[thin space (1/6-em)]:[thin space (1/6-em)]COD × pH) − 0.08 (H2O2[thin space (1/6-em)]:[thin space (1/6-em)]Fe2+ × pH) − 0.06 (H2O2[thin space (1/6-em)]:[thin space (1/6-em)]COD)2 − 0.06 (H2O2[thin space (1/6-em)]:[thin space (1/6-em)]Fe2+)2 − 0.42 (pH)2 (7)


Consequently, all the three polynomial equations gave a good visualization of the effects of the significant factors and their effects on the response.

The fit of the model was evaluated by ANOVA. The result revealed the effects of the model that were statistically significant for a confidence level of 95% (p-value < 0.05). The p value represents the occurrence probability of F due to noise; the smaller the value of p, the more significant the corresponding parameter is. Values of Prob > F less than 0.05 indicate that the model is significant and values greater than 0.01 imply that the model is insignificant. The results of the ANOVA analysis, showed that all the models had a p value less than 0.0001, indicating that the models were significant to describe the color, COD and TOC removal efficiencies.

Furthermore, the validity of the models was determined by the values of lack-of-fit. The ‘lack-of-fit’ for both models was not significant relative to the pure error and this confirmed the good predictability of the model. However, the “Lack-of-Fit F-value” of 29.41 implied that the Lack-of-Fit was significant and the model was not fit for color removal%. This was not surprising since the color abatement occurred within 2–5 minutes under all experimental conditions. Therefore, it was quite difficult to model color removal using the same time interval for COD and TOC removals because near-complete decolorization could be achieved at this reaction time.

Besides, the ANOVA analysis showed that the F values for the COD, TOC and color removal models were 128.3, 143 and 29.2 respectively, indicating that the models were highly significant. There was only 0.015 chance that the ‘model F value’ could occur due to noise. In addition, the quality of fit of the polynomial models was expressed by the value of correlation coefficient (R2). The models were found to be adequate to fit all the experimental data with R2, adjusted R2, and predicted R2 of 99.3, 98.5, and 94.8% for COD removal; 99.3, 98.7, 95.3% for TOC removal; and 96.9, 93.6 and 77.7% for color removal. The R2 value of the response variables, in descending order were COD > TOC > color removal. All the obtained predicted R2 values were in reasonable agreement with the adjusted R2, except for the color removal. This indicated the good predictability of the models for both COD and TOC removal%. It was difficult to model color removal based on the same retention time fixed for COD and TOC removals because decolorization happened within minutes. The good agreement between the experimental and predicted values for COD, TOC and color removal%, as illustrated in ESI as Fig. S1 revealed the accuracy of the model.

Besides, the adequate precision ratios of 39.12, 40.9 and 16.4 derived from the COD, TOC and color removal% indicated that there were adequate signals for all response variables. The perturbation graph obtained based on the experimental result could be used to explain that all the four investigated operating factors had a tremendous effect on the degradation efficiency. Fig. S2 (ESI) shows the perturbation graph of COD, TOC and color removals. The plot was obtained for initial pH of 5.5, H2O2[thin space (1/6-em)]:[thin space (1/6-em)]COD = 6.5, H2O2[thin space (1/6-em)]:[thin space (1/6-em)]Fe2+ = 8.5 and RT of 60 min. The steepiness of the plot indicates the sensitivity of the response to the factors. The plot depicted that the COD, TOC and color removal efficiencies were very sensitive to the mass ratio of H2O2[thin space (1/6-em)]:[thin space (1/6-em)]COD, followed by initial pH, mass ratio of H2O2[thin space (1/6-em)]:[thin space (1/6-em)]Fe2+ and retention time. In conclusion, based on the ANOVA analysis, the model was well explained and it could be used to navigate the design space in terms of COD and TOC removal% efficiencies.

3.2. Response surface and contour plots analysis of Fenton oxidation for color removal

Decolorization refers to the removal of azo groups that mainly contribute to the color of the dyestuff. The decolorization efficiency is very likely to be influenced by the number of azo groups present in the dyestuff. However, color removal does not necessarily indicate complete mineralization or degradation of pollutants. An ADMI unit is used to show decolorization efficiency. Fenton process is well-known for rapid decolorization of all types of wastewater.39–41

Color removal during the Fenton process may result from destruction of dyestuffs by hydroxyl radicals formed during the Fenton reaction or from coagulation by Fe3+. It was observed that decolorization was very efficient through the Fenton oxidation process with the removal efficiency between 73% and 98%. Rapid decolorization (within 5 minutes) was observed in most of the experimental runs right after the Fenton reagent was added to the wastewater. The dark blue wastewater turned pale yellow and colourless after the filtration process. The pale yellow color might be caused by the intermediates that destroyed the azo groups found in the wastewater. Although almost a complete color removal was observed, the low COD and TOC removal percentages showed that it was difficult to destroy aromatic compounds or other functional groups contributing to the recalcitrant nature of the wastewater.

Fig. 3 shows the 3D and 2D response surface plots representing the color removal percentage as a function of the ratio of H2O2[thin space (1/6-em)]:[thin space (1/6-em)]COD and H2O2[thin space (1/6-em)]:[thin space (1/6-em)]Fe2+, H2O2[thin space (1/6-em)]:[thin space (1/6-em)]COD and pH, and H2O2[thin space (1/6-em)]:[thin space (1/6-em)]Fe2+ and pH. The plots showed that color removal increased with increased ratio of H2O2[thin space (1/6-em)]:[thin space (1/6-em)]COD and decreased ratio of H2O2[thin space (1/6-em)]:[thin space (1/6-em)]Fe2+. However, further increase in the ratio of H2O2[thin space (1/6-em)]:[thin space (1/6-em)]COD and H2O2[thin space (1/6-em)]:[thin space (1/6-em)]Fe2+ beyond the optimum region resulted in decreased color removal efficiency. Since excessive hydroxyl radicals in the system will be converted to hydroxyl ions and cause the precipitation of Fe3+ ions, the amount of Fe2+ was reduced, leading to decreased colour removal, as seen in eqn (8)–(10).38 This result was supported by Benatti and others (2006)29 who reported that the color removal efficiency of chemical laboratory wastewater was inversely proportional to the ratio of H2O2[thin space (1/6-em)]:[thin space (1/6-em)]Fe2+.

 
H2O2 → HO˙ + ˙OH (8)
 
Fe2+ + HO˙ → Fe3+ + OH (9)
 
[Fe3+][OH] → Fe(OH)3 (10)


image file: c5ra26775g-f3.tif
Fig. 3 Response surface and contour for color removal percentage as a function of (a) H2O2[thin space (1/6-em)]:[thin space (1/6-em)]COD and H2O2[thin space (1/6-em)]:[thin space (1/6-em)]Fe2 (initial pH = 5.5, RT = 60 min), (b) H2O2[thin space (1/6-em)]:[thin space (1/6-em)]Fe2+ and initial pH (H2O2[thin space (1/6-em)]:[thin space (1/6-em)]COD = 6.5, RT = 60 min), (c) H2O2[thin space (1/6-em)]:[thin space (1/6-em)]COD and initial pH (H2O2[thin space (1/6-em)]:[thin space (1/6-em)]Fe2+ = 8.5, RT = 60 min).

Moreover, at constant retention time and ratio of H2O2[thin space (1/6-em)]:[thin space (1/6-em)]Fe2+, increase in color removal was observed with increased ratio of H2O2[thin space (1/6-em)]:[thin space (1/6-em)]COD and initial pH of the solution. The plots showed that the optimum pH for color removal (96.6%) was pH 6, beyond which, there was decreased decolourization. The wastewater pH is very important as its controls the generation of hydroxyl radicals and concentration of iron salts. The results supported the fact that decomposition of hydrogen peroxide rapidly increases at pH above 6.5. The results showed that the color removal efficiency was significantly higher in weak acidic conditions compared to weak alkaline solutions. The oxidation rate of the Fenton oxidation process was decreased at pH higher than 6, which could be due to the precipitation of Fe3+ to ferric hydro complexes. The formed ferric hydroxide could decompose the available H2O2 into oxygen and water and this consequently decreased the oxidation rate due to low concentration of hydroxyl radicals. Besides, the formed [Fe(II)(H2O)6]2+ reacted slowly with H2O2 than with [Fe(II)(OH)(H2O)5]2+ and this caused less generation of hydroxyl radicals.42 Moreover, low decolorization percentage was reported at very low pH due to the hydroxyl radical scavenging effects of H+ ion.43,44 These findings were consistent with the results reported by other researchers.42,45–47

Besides, increasing the ratio of H2O2[thin space (1/6-em)]:[thin space (1/6-em)]Fe2+ and initial pH of the solution at constant ratio of H2O2[thin space (1/6-em)]:[thin space (1/6-em)]COD increased the color removal efficiency. However, a decrease in the efficiency was observed above the optimal value of both the H2O2[thin space (1/6-em)]:[thin space (1/6-em)]Fe2+ and initial pH. This was because at constant H2O2[thin space (1/6-em)]:[thin space (1/6-em)]COD ratio, increase in the ratio of H2O2[thin space (1/6-em)]:[thin space (1/6-em)]Fe2+ contributed to the reduction in the concentration of Fe2+. The color removal rate was restarted there was insufficient Fe2+ to react with H2O2 to generate hydroxyl radicals in the system. It should also be noted that the authors observed immediate color change of the wastewater samples and formation of small flocs at pH higher than 5 with the addition of ferrous salt alone. This clearly showed that coagulation took place.

3.3. Response surface and contour plots of Fenton treatment for COD and TOC removals

3.3.1. Effects of initial H2O2[thin space (1/6-em)]:[thin space (1/6-em)]COD on COD and TOC. According to,38 the concentration of hydrogen peroxide played an influential role in the Fenton oxidation process. It enhances the degradation efficiency, but may cause scavenging or recombination of hydroxyl radicals when present excessively, as shown in eqn (11)–(13).35,48
 
H2O2 + HO˙ → H2O + HO˙2, k = 2.7 × 10⁷ M−1 s−1 (11)
 
HO˙2 + HO˙ → H2O + O2, k = 1.0 × 10¹⁰ M−1 s−1 (12)
 
HO˙ + HO˙ → H2O2, k = 4.2 × 10⁹ M−1 s−1 (13)

Therefore, it is important to optimize the dosage of H2O2 to generate a sufficient amount of hydroxyl radicals. In this context, the minimum and maximum ratios of H2O2[thin space (1/6-em)]:[thin space (1/6-em)]COD were chosen based on the previous studies reported in the literature and preliminary experiments were also conducted to identify the suitable range to avoid excessive usage of oxidants. The initial COD of wastewater was chosen as one of the parameters as it plays an important role in selecting the optimum concentration of H2O2 and Fe2+. Real textile wastewater with initial [COD]i of 1610 mg l−1 was used and it was kept constant throughout the Fenton oxidation process. Based on the second-order polynomial equation, it could be concluded that the key factor that contributed to the reduction of COD and TOC was the initial ratio of H2O2[thin space (1/6-em)]:[thin space (1/6-em)]COD.

Fig. 4 shows the response surface analysis and contour between the mass ratios of H2O2[thin space (1/6-em)]:[thin space (1/6-em)]COD and H2O2[thin space (1/6-em)]:[thin space (1/6-em)]Fe2+ on the COD and TOC removal efficiencies. Removal of COD increased with an increase in the mass ratio of H2O2[thin space (1/6-em)]:[thin space (1/6-em)]COD. At the fixed COD value of 1610 mg l−1 and mass ratio of H2O2[thin space (1/6-em)]:[thin space (1/6-em)]Fe2+ of 2, the final COD removal efficiency increased from 71.7% to 85% at a retention time of 60 min when the mass ratio of H2O2[thin space (1/6-em)]:[thin space (1/6-em)]COD increased from 1 to 15. The increase in the removal efficiency was due to the increase in the hydroxyl radical concentration as a result of the addition of H2O2.49 However, at a fixed mass ratio of H2O2[thin space (1/6-em)]:[thin space (1/6-em)]COD, an increase in the mass ratio of H2O2[thin space (1/6-em)]:[thin space (1/6-em)]Fe2+ from 2 to 18 reduced the COD removal efficiency from 85% to 57.6%. It was because there was an insufficient amount of ferrous salts that was available in the system. Increasing the mass ratio of H2O2[thin space (1/6-em)]:[thin space (1/6-em)]Fe2+ at fixed COD and H2O2 dosage reduced the amount of Fe2+ to be catalysed by hydrogen peroxide to produce hydroxyl radicals (eqn (14)). This result was similar to the findings presented by Gulkaya and others (2006).50 This was agreeable since the developed polynomial model also showed that both ratios exhibited a negative interaction.

 
Fe2+ + ˙OH → Fe3+ + OH (14)


image file: c5ra26775g-f4.tif
Fig. 4 Contour for percent COD and TOC removal as a function of mass ratios of H2O2[thin space (1/6-em)]:[thin space (1/6-em)]COD and H2O2[thin space (1/6-em)]:[thin space (1/6-em)]Fe2+ at pH of 5.5 and retention time of 60 min.

The highest COD reduction of 85% was obtained at H2O2[thin space (1/6-em)]:[thin space (1/6-em)]COD = 11 and H2O2[thin space (1/6-em)]:[thin space (1/6-em)]Fe2+ = 2 at a center value of initial pH and retention time. On the other hand, a decrease in the efficiency was observed when the ratio of H2O2[thin space (1/6-em)]:[thin space (1/6-em)]Fe2+ was less than 2 and H2O2[thin space (1/6-em)]:[thin space (1/6-em)]COD was above 12 (refer to Table 3). Moreover, unfavourable effect in the COD removal was observed when higher concentration of H2O2 was used. Self-scavenging of HO radicals caused by excessive amount of H2O2 contributed to this condition.34,41 This means that insufficient or excess H2O2 and Fe2+ reduced the efficiency of hydroxyl radicals to oxidize the contaminants. Zhang and others (2007) also reported that the removal efficiency of organic materials in the leachate wastewater decreased with increased Fenton reagent dosage beyond an optimal value.51 Therefore, it is suggested to keep the ratio lower than 11 and lower H2O2 concentration is also more economically viable compared to higher H2O2 concentration. The TOC removal percentage showed the similar trend as the COD removal efficiency with the highest mineralization of 70% observed at H2O2[thin space (1/6-em)]:[thin space (1/6-em)]COD = 10. The TOC removal efficiency was found to decrease when the ratio increased, as shown in Fig. 4. It should be noted that the concentration of H2O2 required to complete the degradation varied with the initial COD of the samples.

3.3.2. Effects of initial H2O2[thin space (1/6-em)]:[thin space (1/6-em)]Fe2+ on COD and TOC removal efficiency. Ferrous ion concentration is important and must be optimized in the Fenton process. In this study, the mass ratio of H2O2[thin space (1/6-em)]:[thin space (1/6-em)]Fe2+ was varied from 2–15 to investigate the effect of Fe2+ concentration on COD removal efficiency. Generally, the efficiency of Fenton process increased with concentration of Fe2+ and hydroxyl radicals. The results showed that the COD removal efficiency significantly increased with increased mass ratio of H2O2[thin space (1/6-em)]:[thin space (1/6-em)]Fe2+ from 2 to 11.6 and then decreased when the ratio was above 12. At a fixed H2O2[thin space (1/6-em)]:[thin space (1/6-em)]COD value, an increase in H2O2[thin space (1/6-em)]:[thin space (1/6-em)]Fe2+ did not affect H2O2 but reduced the amount of Fe2+. Therefore, the oxidation process became catalyst deficient, which reduced the removal efficiency. On the other hand, there was a direct relation between the H2O2[thin space (1/6-em)]:[thin space (1/6-em)]COD ratio and COD removal efficiency whilst an inverse trend was observed between the H2O2[thin space (1/6-em)]:[thin space (1/6-em)]Fe2+ and COD removal. An improvement in the COD removal efficiency was observed with an increase in the H2O2[thin space (1/6-em)]:[thin space (1/6-em)]COD ratio whereby the amount of oxidant (H2O2) available in the reaction medium was increased, hence, increasing the efficiency of the Fenton process. Fig. 4 shows that the removal efficiency was the lowest (71–74%) in the ratio range of 1–3 and an increase in the ratio of H2O2[thin space (1/6-em)]:[thin space (1/6-em)]COD significantly improved the removal efficiency. The COD removal percentage markedly increased from 71% to 85% by externally adding Fe2+ and H2O2 at the fixed initial pH of 5.5. Fig. 4 shows that the degradation efficiency increased dramatically when the mass ratio of H2O2[thin space (1/6-em)]:[thin space (1/6-em)]Fe2+ increased from 2–11. However, based on the initial rates, the scavenging of hydroxyl radicals was present when the initial mass ratio of H2O2[thin space (1/6-em)]:[thin space (1/6-em)]Fe2+ increased above 11.6. This was due to limited Fe2+ in the system to catalyze excessive hydroxyl radicals that were present. It contributed to the scavenging effects, as reported by.52 The results showed that higher concentration of Fe2+ or H2O2 did not increase the efficiency of the Fenton process.

Moreover, the interaction effect between the initial pH and mass ratio of H2O2[thin space (1/6-em)]:[thin space (1/6-em)]COD and H2O2[thin space (1/6-em)]:[thin space (1/6-em)]Fe2+ at a fixed retention time of 60 min was also evaluated in this study. It was observed that there were significant changes in the removal efficiency when we used different initial pH values (2, 5.5, 9 and 12). Fig. 5 shows that the removal efficiency decreased from 85% to 76.1% and 53.1% when the initial pH was changed to 9 and 12, respectively from 5.5. A further reduction in the removal efficiency (79.1%) was observed when the initial pH of 2 was used in the system, as shown in Fig. 5. This showed that there was a strong interaction between the dosage of the Fenton reagent and the initial pH of the pollutant. The following section discusses the effects of initial pH and mass ratios of H2O2[thin space (1/6-em)]:[thin space (1/6-em)]COD and H2O2[thin space (1/6-em)]:[thin space (1/6-em)]Fe2+ on COD and TOC removal efficiencies.


image file: c5ra26775g-f5.tif
Fig. 5 Contour graph for the COD removal percentage as a function of H2O2[thin space (1/6-em)]:[thin space (1/6-em)]COD and H2O2[thin space (1/6-em)]:[thin space (1/6-em)]Fe2+ at different initial pH (a) pH = 2, (b) pH = 9 (c) pH = 12.
3.3.3. Effects of initial pH on COD and TOC removal efficiency. The initial pH of the reaction medium is one of the variables that crucially affects the treatment efficiency of the Fenton process. Most of the studies have reported that the optimum pH for the Fenton reaction is around 3.53,54 At higher pH, ferric ions form Fe(OH)3, which reacts slowly with hydrogen peroxide.55 This process may reduce the efficiency of a Fenton system as less ferric ion is present to react with hydrogen peroxide to generate hydroxyl radicals. Besides, auto-decomposition of hydrogen peroxide also accelerates at higher pH. At very low pH, iron complex, [Fe(H2O)6]2+ is present and it reacts with hydrogen peroxide in the solution. This reduces the amount of ferrous ion present in the solution.56 In addition, at very low pH, hydrogen peroxide forms stable oxonium ions [H3O2]+ that are stable and less reactive compared to hydroxyl radicals, reducing its efficiency in oxidizing the pollutants. In this study, the initial pH was varied from 2–9 to study the effects of initial pH of the solution on the degradation efficiency of real textile wastewater.

Fig. 6 shows the semi spherical response surface that explains the effects of initial pH of the solution on the COD and TOC removal percentages. The graph shows that the mineralization and degradation efficiencies increased with the initial pH of the solution from 2–5 but the efficiency decreased slightly above pH 6. The maximum COD and TOC removals were determined to be 76.1% and 64.6%, respectively. The removal efficiency was reportedly decreased to 67.1% and 55% when the pH was increased above 7 at a mass ratio of H2O2[thin space (1/6-em)]:[thin space (1/6-em)]Fe2+ = 8.5, as illustrated in Fig. 6. At the optimum condition, H2O2 was converted rapidly to hydroxyl free radicals that could non-selectively decompose these pollutants in the batik wastewater.


image file: c5ra26775g-f6.tif
Fig. 6 Response surface and contour for COD and TOC removal percentages as a function of H2O2[thin space (1/6-em)]:[thin space (1/6-em)]COD and initial pH.

Moreover, an increase in the ratio of H2O2[thin space (1/6-em)]:[thin space (1/6-em)]Fe2+ from 2–15 at the lowest initial pH of 2 and fixed mass ratios of H2O2[thin space (1/6-em)]:[thin space (1/6-em)]COD = 6.5 caused a steady reduction in the removal efficiency of COD from 80.4 to 61.5%, as shown in Fig. 7. This may be due to the scavenging of hydroxyl caused by ferrous ion (eqn (8)).57 Moreover, increasing the mass ratios of H2O2[thin space (1/6-em)]:[thin space (1/6-em)]Fe2+ above 15 caused a drastic change in the removal efficiency, whereby only 56% and 42.8% removals were achieved at the mass ratio of H2O2[thin space (1/6-em)]:[thin space (1/6-em)]Fe2+ of 20 and 30, respectively. It was proven that the dosage of Fe2+ and H2O2 had a strong interaction with the initial pH of the solution. In conclusion, the result showed that the oxidation was more active in acidic conditions while alkaline conditions favoured the coagulation process.


image file: c5ra26775g-f7.tif
Fig. 7 Response surface and contour for COD removal percentage as a function of H2O2[thin space (1/6-em)]:[thin space (1/6-em)]Fe2+ and initial pH of the solution.
3.3.4. Effects of RT on COD and TOC removal efficiency. It is known that the treatment time or retention time of Fenton process affects the rate of organic contaminant removal. The organic matters in wastewater cannot react with the Fenton's reagents completely when the retention time is too short. On the other hand, if the retention time is beyond the optimal point, organic pollutants tend to form more toxic intermediates, which will reduce the treatment efficiency. Besides, longer retention time also requires a larger reactor and increases the cost of the process. Therefore, it is important to ascertain the appropriate oxidation time to increase the treatment efficiency. Therefore, experiments were carried out at different oxidation times to obtain the appropriate oxidation time of the Fenton process for the batik wastewater.

Fig. 8 shows the interaction between the mass ratio of H2O2[thin space (1/6-em)]:[thin space (1/6-em)]Fe2+ and retention time for the COD and TOC removals at the fixed mass ratios of H2O2[thin space (1/6-em)]:[thin space (1/6-em)]COD = 6.5 and initial pH of 5.5. It was observed that the degradation efficiency increased with the mass ratio of H2O2[thin space (1/6-em)]:[thin space (1/6-em)]Fe2+ and retention time. The maximum COD (77.9%) and TOC (67.3%) removals were achieved at pH 5.5, mass ratio of H2O2[thin space (1/6-em)]:[thin space (1/6-em)]COD = 6.5, H2O2[thin space (1/6-em)]:[thin space (1/6-em)]Fe2+ = 2 between 48–54 minutes. When the oxidation time and ratio of H2O2[thin space (1/6-em)]:[thin space (1/6-em)]Fe2+ increased beyond the optimal point, the COD and TOC removals were reduced to 67.1% and 55% respectively. A drop in the removal efficiency might be caused by longer treatment time that contributed to the formation of toxic intermediates or scavenging caused by excessive hydroxyl radicals and iron salts. The result indicated that there should be an optimised oxidation time.


image file: c5ra26775g-f8.tif
Fig. 8 Response surface and contour for percent COD and TOC removal as a function of H2O2[thin space (1/6-em)]:[thin space (1/6-em)]Fe2+ and retention time.

In addition, the interactions between the retention time and mass ratios of H2O2[thin space (1/6-em)]:[thin space (1/6-em)]Fe2+ and H2O2[thin space (1/6-em)]:[thin space (1/6-em)]COD were also evaluated in this study. When the H2O2[thin space (1/6-em)]:[thin space (1/6-em)]COD mass ratio was increased from 12 to 24 and 36, a drastic decrease in the COD removal was observed, as shown in Fig. 9. This indicated that longer retention time and excessive hydroxyl in the system might caused the formation of intermediates, which increased the toxicity level of the wastewater.


image file: c5ra26775g-f9.tif
Fig. 9 Contour for percent of COD removal as a function of H2O2[thin space (1/6-em)]:[thin space (1/6-em)]COD and retention time.

3.4. Model validation and confirmation of optimized conditions

It is possible to fix specific working conditions such as maximizing the responses or keeping them in the desired range by using RSM if multiple responses are applied. In the present study, the desired goals in terms of color, COD and TOC removal efficiencies were defined as “maximize” to achieve the highest removal efficiency. However, the operating parameters, mass ratio of H2O2[thin space (1/6-em)]:[thin space (1/6-em)]COD and H2O2[thin space (1/6-em)]:[thin space (1/6-em)]Fe2+, initial pH of the wastewater, and retention time were selected to be “in the range” without considering the operating (chemicals and electrical energy) costs. Accordingly, the optimum working conditions and the respective removal efficiencies were established for constant initial COD (mg l−1). The results are presented in Table 5. A verification experiment was carried out using the optimum conditions to confirm the adequacy of the predicted model. The average maximum degradation, mineralization and color removals were obtained from three replicate experiments, shown in Table 5. For an initial effluent COD of 1610 mg l−1, the model predicted 96.6% of color, 80.1% of COD and 68.2% of TOC removals under the optimized working conditions. The good agreement between the predicted value and the experimental value confirmed the validity of the model for the Fenton oxidation of the batik wastewater. The success revealed that it was possible to save considerable time and effort for estimating the optimum working conditions to achieve the highest treatment efficiencies by using RSM-based CCD.
Table 5 Optimum value of the process parameters for constraint conditions and experimental valuesa
Res. COD (mg l−1) H2O2[thin space (1/6-em)]:[thin space (1/6-em)]COD H2O2[thin space (1/6-em)]:[thin space (1/6-em)]Fe2+ pH RT H2O2 (ml) Fe2+ (ml) Pred. Exp.
a Desirability = 1, CR = color removal.
CR 1610 10.18 4.74 4.77 63.4 49.2 17.16 96.6 99.6
COD 1610 10.18 4.74 4.77 63.4 49.2 17.16 80.1 81.4
TOC 1610 10.18 4.74 4.77 63.4 49.2 17.16 68.2 70.5


3.5. Kinetic study of the treatment

The kinetic study is considered as an organic matter index for the COD value because of the complexity of the wastewater. In the present study, zero-, first- and second-order reaction kinetics were tested to investigate the degradation efficiency (COD removal) of the batik wastewater by the Fenton oxidation process. The individual expression is presented below (eqn (15)–(17)):

Zero order reaction:

 
image file: c5ra26775g-t5.tif(15)

First order reaction:

 
image file: c5ra26775g-t6.tif(16)

Second order reaction:

 
image file: c5ra26775g-t7.tif(17)
where C is the COD of wastewater; k0, k1 and k2 represent the apparent kinetic rate constants of zero-, first- and second-order reaction kinetics, respectively; and t is the reaction time.

By integrating eqn (15)–(17), the following equations can be obtained (eqn (18)–(20)):

 
ct = c0k0t (18)
 
ct = c0ek1t (19)
 
image file: c5ra26775g-t8.tif(20)
where ct is COD of wastewater at reaction time t.

The regression analysis based on the zero-, first- and second-order reaction kinetics for the COD removal from the batik wastewater using the Fenton oxidation process, which was conducted at the optimized conditions. The results are shown in Fig. 10. It was found that that the regression coefficients, R2 of the second-order reaction kinetics (Fig. 10(c)) was 0.9748, which was obviously much higher than that based on the zero-order (R2 = 0.8583) and the first-order (R2 = 0.9601) reaction kinetics. Comparing the regression coefficients obtained by the graphical representation, we concluded that the first-order reaction kinetics fit the reaction best. The first-order rate constant k1 = 0.0252 s−1 was calculated from the slope. The result obtained from this study was consistent with the work from Nitoi and others (2013).58


image file: c5ra26775g-f10.tif
Fig. 10 (a) Zero-order, (b) first-order and (c) second-order reaction kinetics for the COD removal by Fenton oxidation. Experimental conditions: [COD] = 900 mg l−1; H2O2[thin space (1/6-em)]:[thin space (1/6-em)]COD = 10.18 and H2O2[thin space (1/6-em)]:[thin space (1/6-em)]Fe2+ = 4.74, initial pH 4.77 and retention time = 63.4 min.

3.6. Surface group

FT-IR spectroscopy has been proven as a powerful tool for comprehensive characterization of organic contaminants. The unique characteristics of the material presented by the spectrum indicate the material properties, behavior and specific components represented by the functional groups. Infrared spectroscopy is based on the interactions of infrared radiation with matters. Infrared light causes functional groups to vibrate. The uptake of energy is indicated by the absorption bands in the spectrum. The intensity of the measured band depends on the content of the substances and the individual interaction of the functional groups with the infrared radiation at a distinct energy level. The near-infrared (NIR) region from 14[thin space (1/6-em)]000–4000 cm−1 and the mid-infrared (MIR) region from 4000–400 cm−1 are commonly applied for processes and product controls in many industrial fields. The spectral pattern of the substances reveals the inherent features and thus the identity of the substances.

An understanding of the surface chemistry can be acquired through conducting Fourier transform infrared spectroscopy (FTIR). FTIR spectroscopy is widely used to characterize and analyze the general functional groups present in wastewater. In the present study, the comparison of the FTIR spectrum of the untreated and treated batik wastewater clearly indicated the mineralization of wastewater by the Fenton oxidation process. Fig. 11 shows the FTIR spectrum of the untreated batik wastewater and treated wastewater by the Fenton oxidation process at the optimized experimental conditions as followed: mass ratio of H2O2[thin space (1/6-em)]:[thin space (1/6-em)]COD = 10.18, and H2O2[thin space (1/6-em)]:[thin space (1/6-em)]Fe2+ = 4.74, initial pH 4.77 and retention time = 63.4 min.


image file: c5ra26775g-f11.tif
Fig. 11 FTIR spectrum of batik wastewater and Fenton treated wastewater.

Fig. 11 shows the comparison of the spectrum before and after the treatment. A decrease in the number of peaks was observed. Therefore, it can be concluded that the Fenton process successfully mineralized most of the organic compounds present in the wastewater. It was clear from the FTIR spectrum that the peaks at the wavelengths of 3317 cm−1 and 1637 cm−1 were observed with a reduction in their intensity in the spectrum of the Fenton treated wastewater. A strong and broad peak located at 3317 cm−1 can be associated with the presence of hydroxyl groups. It was believed that the band that occurred at 1637 cm−1 was caused by the aromatic C[double bond, length as m-dash]C bonds, which were polarized by the oxygen atoms bond near one of the C atom. This might be due to the incorporation of oxygen groups into the carbonaceous phase caused by the attacks by hydroxyl radicals.

3.7. Sludge characterization

Fenton process has been extensively studied and successfully used to treat highly toxic, recalcitrant, and colored wastewaters which cannot be biologically treated. However, industrial application of the Fenton process is limited mainly because of the generation of iron oxyhydroxide during the neutralization process after oxidation. Researchers believe that the produced solid waste is potentially hazardous because of the adsorbed organics from the treated wastewater. This is one of the main obstacles preventing full-scale Fenton process for industrial wastewater treatment. The experimental study showed that the variation in the sludge amount was mainly due to the difference in the dosage of the Fenton reagent used in the system for each run when the initial COD value of the wastewater was fixed. Besides, the volume of the sludge was also related to the extent of mineralization. Therefore, it is important to optimize the amount of Fenton reagents and other operating parameters as they affect the sludge properties. Although many studies have been conducted to investigate the feasibility of the Fenton process, very limited work has reported the characteristics of the sludge generated from the oxidation process. There have not been any comprehensive reports on the particle size and surface studies of the generated sludge. In this work, the sludge formed from the optimized conditions was characterized using SEM/EDX and the particle size study was performed.
3.7.1. SEM and elemental analysis of sludge form Fenton treated sample. Sludge production is another important parameter in characterizing the Fenton process. Scanning Electron Microscopy (SEM) combined with energy dispersive spectrometry (EDX) was also conducted to elucidate the morphology and the elements of the sludge generated through the Fenton process. The sludge conditioned by the Fenton's reagent showed a discontinuous and porous structure with a diameter of around 80 μm (ESI as Fig. S3). The elemental analysis of the sample using EDX, as shown in Fig. 12 indicated that O, Na, Fe, C, N and S were present in the sludge. Table S2 (ESI) shows the percentage of the elements. Oxygen was the most abundant element followed by sodium. The presence of iron may cause particle destabilization and oxidation. Nevertheless, iron can be reduced by treating the Fenton treated samples with sodium hydroxide. It was clear that further treatment was not necessary. Based on the elemental analysis of the sludge produced in the Fenton process, it was proven that Fenton oxidation generates harmless end products.
image file: c5ra26775g-f12.tif
Fig. 12 The energy dispersive X-ray (EDX) spectrum for the Fenton treated sludge sample of the batik wastewater.
3.7.2. Particle size distribution. Particle size is one of the factors that affects the dewatering characteristics of sludge apart from pH, grease content, porosity, particle charge, solid concentration, nitrogen content and others. For this purpose, sludge samples were collected from a treated sample that was obtained as a result of the Fenton oxidation process under the optimized conditions. The particle size distribution analysis was performed by using Mastersizer 2000 and the particle size range was defined. The results presented above indicated that laser diffraction using Malvern Mastersizer 2000® was capable of providing rapid and reproducible results on the particle size distribution of the sludge. The particle size distribution of the sludge is illustrated in Fig. 13, which shows the percentage of particles by volume between 0.02 to 2000 μm. As illustrated in the graph, the sludge formed in the Fenton oxidation process had a particle size of 10.24 to 50.781 microns. According to Neyens et al. (2003), particle size can be modified by the presence of acids. Repulsive electrostatic interactions created by the surface charge of the sludge particles are minimized within the pH range of 2.6–3.6, leading to proximity of small particles. On the other hand, Fenton oxidation is a complex chain of reactions in which the generated ferrous ions react with hydroxide ions to form ferric hydroxide and ferric hydroxo complexes. These compounds possess a high capacity of coagulation and flocculation. Therefore, it was suggested that Fenton oxidation caused small sludge particles to flocculate to form larger particles.
image file: c5ra26775g-f13.tif
Fig. 13 Particle size distribution of sludge generated in the Fenton oxidation process.

3.8. Analysis of organic contaminants in the batik wastewater during Fenton oxidation process

In order to further investigate the organic contaminant removal from the batik wastewater by the Fenton oxidation process, the effluent was analyzed by GC-MS before and after the treatment. Fig. 14 shows that the concentration of organic contaminants in the batik wastewater reduced significantly after the Fenton oxidation process. The chromatogram illustrated that around 30 types of organic components were present in the influent. The organic compounds found in the batik effluent included 17 siloxanes derived compounds, 9 alkanes, 2 carboxylic acids, 1 ester and 1 aromatic hydrocarbon alkane. Among them, the semi-inorganic polymers, siloxanes or silicone derivatives were found in high proportion, which was around 57%. These nonionic surfactants could have been reduced from the sodium silicate that is used to fix the colors/dyes on the cloth. Sodium silicates are inorganic substances composed primarily of silicon oxide (SiO2) and sodium oxide (Na2O). The polysiloxanes found in the real wastewater included cyclohexasiloxane, silane, cyclodecasiloxane, cyclononasiloxane, heptasiloxane, heptasiloxane, octasiloxane, hexasiloxane, and cyclotrisiloxane. Siloxanes based on polymerized siloxanes consist of chains made of alternating silicone and oxygen atoms. Besides, the amount of hydrocarbons detected by GC/MS may be caused by the wax used in the batik making process. Wax helps dye penetrate into textiles and creates a marbled look. About 17 organic pollutants were completely removed by the Fenton oxidation process since they were not detected on the chromatogram of the effluent. After the Fenton oxidation process, about 71% of siloxanes were successfully removed from the wastewater. It was concluded that the Fenton oxidation process could oxidize high-molecular-weight substances into small organic compounds, which could then be readily detected by GC-MS. Additionally, the HPLC analysis showed that the treated effluent contained a small amount of carboxylic acids and sodium ions, which was in accordance with the GC/MS analysis (ESI as Fig. S4).
image file: c5ra26775g-f14.tif
Fig. 14 Chromatogram for organic in batik wastewater (a) before and (b) after Fenton treatment (S = siloxanes, A = alkanes, AH = aromatic hydrocarbon alkane, ES = ester, CA = carboxylic acid).

3.9. Model verification using different types of real wastewaters

The ideal ratio of H2O2[thin space (1/6-em)]:[thin space (1/6-em)]COD and H2O2[thin space (1/6-em)]:[thin space (1/6-em)]Fe2+, initial pH and retention time for the maximum pollutant removal efficiency differs with the types of wastewater. Further studies were conducted in order to determine if the model developed for the batik wastewater could be used for other types of wastewater. The validity of the RSM-predicted model for the optimum efficiency could be verified by applying the empirical model with varied initial COD values. The predicted and experimentally obtained treatment efficiencies of different types of real wastewater using the optimized values of the batik wastewater are presented in Table 6. In conclusion, the results obtained using the optimal conditions for COD, TOC and color removals showed that the RSM model attained for the batik wastewater could be used to treat different types of wastewater with higher removal efficiency.
Table 6 Optimum value of the process parameters for constraint conditions and experimental values for different types of wastewater
  COD (mg l−1) H2O2[thin space (1/6-em)]:[thin space (1/6-em)]COD H2O2[thin space (1/6-em)]:[thin space (1/6-em)]Fe2+ pH RT Predicted Experimental
CR COD TOC CR COD TOC
Steel industry 326 10.18 4.74 4.77 63.4 96.6 80.1 68.2 100 67.5 50.2
POME 34[thin space (1/6-em)]070 10.19 4.75 4.77 63.4 96.6 80.1 68.2 99.4 98.9 72.5
Leachate 5040 10.20 4.76 4.77 63.4 96.6 80.1 68.2 99.5 92.7 71.6


4. Conclusion

The overall results of this study indicated that the application of Fenton's reagent was a feasible method to treat wastewater to sufficiently reduce COD, TOC and color intensity. Response surface methodology was successfully used to design and optimize the operating parameters for treating the batik wastewater using the Fenton process with the initial COD values ranging from 1600–1900 mg l−1. The effects of the following operating parameters on the treatment efficiency were evaluated: initial pH, the mass ratio of H2O2[thin space (1/6-em)]:[thin space (1/6-em)]COD and H2O2[thin space (1/6-em)]:[thin space (1/6-em)]Fe2+, and retention time and The wastewater degradation and mineralization efficiencies were studied in terms of COD, TOC and color reduction percentages. The empirical equations developed using central composite design based on the experimental data described the treatment process within the studied region. Therefore, it showed the suitability of the developed models in optimizing the treatment system. Our study showed that the optimal conditions for the Fenton oxidation process were H2O2[thin space (1/6-em)]:[thin space (1/6-em)]COD = 10.18, H2O2[thin space (1/6-em)]:[thin space (1/6-em)]Fe2+ = 4.74, initial pH = 4.77 and retention time of 63 min. Under these conditions, the color removal, degradation (COD) and mineralization (TOC) efficiencies of the batik wastewater were found to be 99.6%, 81.4% and 70.5%, respectively. The kinetic study showed that the Fenton oxidation process best fit the first-order kinetics reaction, with the best data correlation. The GC/MS and FTIR analyses of the untreated and treated wastewater samples showed the organic contaminant destruction based on the disappearance of the functional groups. The chemical analyses (FTIR and GC/MS) of the treated samples revealed that the Fenton oxidation process managed to degrade most of the organic compounds within a short period of time. The properties of the generated sludge were studied in this study. This study also successfully validated the adoption of the developed model for the batik wastewater in other real wastewater samples with various COD values. In conclusion, this work opens up a new avenue for the use of the Fenton oxidation process in treating the batik wastewater.

Acknowledgements

The authors are grateful to the University of Malaya High Impact Research Grant (HIR-MOHE-D000037-16001) from the Ministry of Higher Education Malaysia which financially supported this work.

References

  1. N. Nair, The Star online, 25th September 2014.
  2. H. R. Rashidi, N. M. Sulaiman, N. A. Hashim and C. R. Che Hassan, Adv. Mater. Res., 2012, 627, 394–398 CrossRef.
  3. H. R. Rashidi, N. M. N. Sulaiman and N. A. Hashim, Procedia Eng., 2012, 44, 2010–2012 CrossRef.
  4. S. Chakma and V. S. Moholkar, AIChE J., 2013, 59, 4303–4313 CrossRef CAS.
  5. B. Lodha and S. Chaudhari, J. Hazard. Mater., 2007, 148, 459–466 CrossRef CAS PubMed.
  6. M. S. Lucas and J. A. Peres, Dyes Pigm., 2007, 74, 622–629 CrossRef CAS.
  7. M. Cheng, G. Zeng, D. Huang, C. Lai, P. Xu, C. Zhang and Y. Liu, Chem. Eng. J., 2016, 284, 582–598 CrossRef CAS.
  8. A. Justo, O. Gonzalez, J. Acena, S. Perez, D. Barcelo, C. Sans and S. Esplugas, J. Hazard. Mater., 2013, 263(2), 268–274 CrossRef CAS PubMed.
  9. Y. Shavisi, S. Sharifnia, S. N. Hosseini and M. A. Khadivi, J. Ind. Eng. Chem., 2014, 20, 278–283 CrossRef CAS.
  10. D. u. B. Hasan, A. R. Abdul Aziz and W. M. A. W. Daud, Chem. Eng. Res. Des., 2012, 90, 298–307 CrossRef CAS.
  11. A. Serra, X. Domenech, E. Brillas and J. Peral, J. Environ. Monit., 2011, 13, 167–174 RSC.
  12. S. Chakma, L. Das and V. S. Moholkar, Sep. Purif. Technol., 2015, 156(2), 596–607 CrossRef CAS.
  13. S. Chakma and V. S. Moholkar, RSC Adv., 2015, 5, 53529–53542 RSC.
  14. R. S. Malani, S. Khanna, S. Chakma and V. S. Moholkar, Ultrason. Sonochem., 2014, 21, 1400–1406 CrossRef CAS PubMed.
  15. S. Chakma and V. S. Moholkar, J. Ind. Eng. Chem., 2016, 33, 276–287 CrossRef CAS.
  16. S. Chakma and V. S. Moholkar, Ind. Eng. Chem. Res., 2014, 53, 6855–6865 CrossRef CAS.
  17. B. Archina, A. R. Abdul Aziz and W. D. Wan Mohd Ashri, Rev. Chem. Eng., 2015, 31, 263–302 Search PubMed.
  18. A. Babuponnusami and K. Muthukumar, J. Environ. Chem. Eng., 2014, 2, 557–572 CrossRef CAS.
  19. F. Torrades and J. García-Montaño, Dyes Pigm., 2014, 100, 184–189 CrossRef CAS.
  20. M. Qiu and C. Huang, Desalin. Water Treat., 2012, 24, 273–277 CrossRef.
  21. M. Hartmann, S. Kullmann and H. Keller, J. Mater. Chem., 2010, 20, 9002–9017 RSC.
  22. H. Li, Y. Pan, Z. Wang, S. Chen, R. Guo and J. Chen, RSC Adv., 2015, 5, 100775–100782 RSC.
  23. S. Chakma and V. S. Moholkar, Indian Chem. Eng., 2015, 57, 359–381 CrossRef CAS.
  24. D. Bingöl, M. Hercan, S. Elevli and E. Kılıç, Bioresour. Technol., 2012, 112, 111–115 CrossRef PubMed.
  25. M. A. Bezerra, R. E. Santelli, E. P. Oliveira, L. S. Villar and L. A. Escaleira, Talanta, 2008, 76, 965–977 CrossRef CAS PubMed.
  26. A. Saldaña-Robles, R. Guerra-Sánchez, M. I. Maldonado-Rubio and J. M. Peralta-Hernández, J. Ind. Eng. Chem., 2014, 20, 848–857 CrossRef.
  27. A. Zuorro, M. Fidaleo and R. Lavecchia, J. Environ. Manage., 2013, 127, 28–35 CrossRef CAS PubMed.
  28. D. u. B. Hasan, A. R. A. Aziz and W. M. A. W. Daud, Environ. Technol., 2012, 33, 1111–1121 CrossRef CAS PubMed.
  29. C. T. Benatti, C. R. Tavares and T. A. Guedes, J. Environ. Manage., 2006, 80, 66–74 CrossRef CAS PubMed.
  30. A. N. Módenes, F. R. Espinoza-Quiñones, D. R. Manenti, F. H. Borba, S. M. Palácio and A. Colombo, J. Environ. Manage., 2012, 104, 1–8 CrossRef PubMed.
  31. A. Asghar, A. A. Abdul Raman and W. M. A. W. Daud, Sci. World J., 2014, 2014, 14 Search PubMed.
  32. T. Shojaeimehr, F. Rahimpour, M. A. Khadivi and M. Sadeghi, J. Ind. Eng. Chem., 2014, 20, 870–880 CrossRef CAS.
  33. R. Colombo, T. C. R. Ferreira, S. A. Alves, R. L. Carneiro and M. R. V. Lanza, J. Environ. Manage., 2013, 118, 32–39 CrossRef CAS PubMed.
  34. M. Lucas and J. Peres, Dyes Pigm., 2006, 71, 236–244 CrossRef CAS.
  35. J. J. Pignatello, E. Oliveros and A. MacKay, Crit. Rev. Environ. Sci. Technol., 2006, 36, 1–84 CrossRef CAS.
  36. A. Žgajnar Gotvajn, J. Zagorc-Končan and M. Cotman, Desalination, 2011, 275, 269–275 CrossRef.
  37. H. Wu and S. Wang, J. Hazard. Mater., 2012, 243, 86–94 CrossRef CAS PubMed.
  38. S. Karthikeyan, A. Titus, A. Gnanamani, A. B. Mandal and G. Sekaran, Desalination, 2011, 281, 438–445 CrossRef CAS.
  39. I. Arslan-Alaton, G. Tureli and T. Olmez-Hanci, J. Photochem. Photobiol., A, 2009, 202, 142–153 CrossRef CAS.
  40. I. Arslan-Alaton, Color. Technol., 2003, 119, 345–353 CAS.
  41. X. R. Xu, H. B. Li, W. H. Wang and J. D. Gu, Chemosphere, 2004, 57, 595–600 CrossRef CAS PubMed.
  42. P. Bautista, A. F. Mohedano, M. A. Gilarranz, J. A. Casas and J. J. Rodriguez, J. Hazard. Mater., 2007, 143, 128–134 CrossRef CAS PubMed.
  43. W. Z. Tang and C. P. Huang, Environ. Technol., 1996, 17, 1371–1378 CrossRef CAS.
  44. B. G. Kwon, D. S. Lee, N. Kang and J. Yoon, Water Res., 1999, 33, 2110–2118 CrossRef.
  45. M. Y. Ghaly, G. Härtel, R. Mayer and R. Haseneder, Waste Manage., 2001, 21, 41–47 CrossRef CAS PubMed.
  46. Y. Deng and J. D. Englehardt, Water Res., 2006, 40, 3683–3694 CrossRef CAS PubMed.
  47. Y. S. Jung, W. T. Lim, J. Y. Park and Y. H. Kim, Environ. Technol., 2009, 30, 183–190 CrossRef CAS PubMed.
  48. C. Walling and A. Goosen, J. Am. Chem. Soc., 1973, 95, 2987–2991 CrossRef CAS.
  49. W. P. Ting, M. C. Lu and Y. H. Huang, J. Hazard. Mater., 2009, 161, 1484–1490 CrossRef CAS PubMed.
  50. İ. Gulkaya, G. A. Surucu and F. B. Dilek, J. Hazard. Mater., 2006, 136, 763–769 CrossRef PubMed.
  51. H. Zhang, C. Fei, D. Zhang and F. Tang, J. Hazard. Mater., 2007, 145, 227–232 CrossRef CAS PubMed.
  52. S. Bouafia-Chergui, N. Oturan, H. Khalaf and M. A. Oturan, J. Environ. Sci. Health, Part A: Toxic/Hazard. Subst. Environ. Eng., 2010, 45, 622–629 CrossRef CAS PubMed.
  53. H. Kusic, N. Koprivanac and L. Srsan, J. Photochem. Photobiol., A, 2006, 181, 195–202 CrossRef CAS.
  54. M. V. Bagal and P. R. Gogate, Ultrason. Sonochem., 2014, 21, 1–14 CrossRef CAS PubMed.
  55. A. Babuponnusami and K. Muthukumar, J. Environ. Chem. Eng., 2014, 2(1), 557–572 CrossRef CAS.
  56. R. R. Navarro, H. Ichikawa and K. Tatsumi, Chemosphere, 2010, 80, 404–409 CrossRef CAS PubMed.
  57. S. Chakma and V. S. Moholkar, J. Taiwan Inst. Chem. Eng., 2016, 60, 469–478 Search PubMed.
  58. I. Nitoi, T. Oncescu and P. Oancea, J. Ind. Eng. Chem., 2013, 19, 305–309 CrossRef CAS.

Footnote

Electronic supplementary information (ESI) available. See DOI: 10.1039/c5ra26775g

This journal is © The Royal Society of Chemistry 2016