Mechanism for the formation and growth of carbonaceous spheres from sucrose by hydrothermal carbonization

Yujie Qia, Mu Zhangb, Lin Qia and Yang Qi*ab
aInstitute of Materials Physics and Chemistry, School of Materials Science and Engineering, Northeastern University, Shenyang 110819, P. R. China. E-mail: qiyang@imp.neu.edu.cn
bKey Laboratory for Anisotropy and Texture of Materials, School of Materials Science and Engineering, Northeastern University, Shenyang 110819, P. R. China

Received 14th December 2015 , Accepted 15th February 2016

First published on 15th February 2016


Abstract

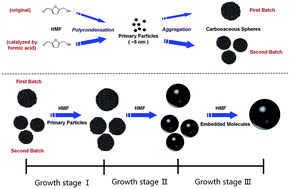
We report a new three-step mechanism for the formation and growth of carbonaceous spheres by hydrothermal carbonization of saccharides using sucrose as a precursor material. Carbonaceous spheres with small diameters and narrow size distribution were synthesized via a rapid heating route, and a notable phenomenon of a sudden drop in the mean diameter of the carbonaceous spheres at low concentration with the extension of time was observed. The morphology, chemical structure of carbonaceous spheres and the chemical composition of residual solutions were analysed by field emission scanning electron microscope (FESEM), Fourier transform infrared spectroscopy (FT-IR) and solution 13C nuclear magnetic resonance (NMR) respectively. Based on these results, evolution of solid products is clearly revealed. The formation contains two stages, and oversaturation of primary particles attributed to autocatalysis of fructose by the yielded acid (formic acid) results in the appearance of large amounts of carbonaceous spheres in the second stage of formation, which accounts for the sudden drop in mean diameter.


Introduction

In recent years, hydrothermal carbonization (HTC) has attracted great attention due to the convention of biomass to outstanding carbonaceous materials.1,2 However, this process involved with saccharides was initially carried out to study the mechanism of natural coalification in the early 20th century.3,4 Later on, 5-hydroxymethylfurfural (HMF), levulinic acid, lactic acid and furfural as valuable chemicals generated in the hydrothermal carbonization of biomass were researched extensively to improve their yields, with the assistance of supercritical water, organic solvents, and catalysts, besides, detailed chemical routes and reaction kinetics for the conversion of biomass to HMF were also investigated simultaneously.5–8 Nevertheless, the solid residues from hydrothermal carbonization of biomass were once considered as useless by-products. The carbonaceous spheres with regular shape firstly used as anode materials for lithium storage,9,10 which triggered further synthesis of functional carbonaceous materials for various purposes. Up to date, carbonaceous materials with regular spherical shape and controllable size are promising materials as precursors for activated spherical carbons,11,12 or catalyst support materials.13 Especially for the carbonaceous spheres with uniform size, which could be served as sacrificial templates for fabricating hollow spheres of inorganic materials (Ga2O3, GaN, ZnO, SnO2, Ta2O5, etc.), applied widely in the fields of photocatalysis, dye-sensitized solar cell and gas sensor.14–18

Apart from polymers,19 carbohydrates, such as xylose,20 glucose,11,12,21–23 fructose,20,24 sucrose,11,22 starch,22 cellulose,11,25 and cyclodextrins,26 have been frequently used as raw materials to synthesize carbonaceous spheres by HTC process. Although these particles synthesized are in the size range of 0.2–10 μm, carbonaceous spheres with uniform size are difficult to be found among these cases. The minimum mean sizes of carbon spheres obtained from different carbohydrates varied widely in the previous literatures, viz. 150 nm for glucose,21 170 nm for xylose,20 290 nm for fructose.20 Besides, detailed variation tendencies and size distributions of hydrothermal products are lacking.

There are two main different mechanisms about formation proposed in literatures of hydrothermal carbonization of carbohydrates: the former one based on Fourier transform infrared spectroscopy (FT-IR), X-ray photoelectron spectroscopy (XPS), and Raman characterizations, considers that the stable oxygen groups such as ether or pyrone constitute inner core,22,25 and that formation and growth of carbonaceous spheres follow the LaMer model;27 the latter one based on solid state 13C nuclear magnetic resonance (NMR) results, emphasizes on the furans rather than benzene rings in the scaffold of carbonaceous spheres.28,29 As single-quantum double-quantum (SQ-DQ) 13C correlation experiments provided possible ways to study the local structure of carbonaceous spheres and probe direct carbon–carbon bonds,30 the theory that furanic rings derived from polymerisation of HMF are scaffolds of carbonaceous spheres is convincing in analysing chemical structure of carbonaceous spheres.

In the present work, experiments were conducted under hydrothermal conditions using sucrose as precursor to elucidate accurate processes involved with formation and growth. Based on results, a new three-step mechanism for formation and growth was proposed. The formation of carbonaceous spheres consists of two distinct stages, mainly due to significant difference in yield, and the growth can be divided into three stages owing to varieties of growth units.

Experimental procedures

Materials

All the chemicals were of analytical grade purchased from Sinopharm Chemical Reagent Co., Ltd. and were used without further purification.

Synthesis of carbonaceous spheres

The typical hydrothermal carbonization of sucrose was carried out according to the following procedure. Firstly, 0.01 mol sucrose was dispersed in 30 ml water, stirred vigorously for 20 min to form clear and transparent solution. The solution was then transferred to a 45 ml Teflon-lined stainless steel autoclave, heated up to 180 °C and maintained for a period of time. After this, the reactor vessel was immediately immersed in water to quench the reaction. Finally, the precipitates were collected by centrifugation (4000 rpm, 30 min), and rinsed with distilled water and anhydrous ethanol more than three times, then dried at 80 °C in a vacuum furnace for 12 h.

Two different heating routes were applied in hydrothermal process. The Slow Heating (SH) represented a heating process from ambient temperature to 180 °C with the rise velocity of temperature maintaining 5 °C min−1, in which reaction time initiated once temperature reached 180 °C. Moreover, the reaction time in the Rapid Heating (RH) route initiated once reactor vessel was directly transferred into muffle furnace maintaining 180 °C. Herein, 0.067, 0.100, 0.167, 0.233, 0.300, 0.333 M sucrose solutions were selected for hydrothermal carbonization. The detailed experimental parameters applied here are listed in Tables S1 and S2.

Characterization

The morphologies and sizes of solid products were characterized by a field emission scanning electron microscope (FESEM, ZEISS & ULTRA PLUS). The diameters of carbonaceous spheres were measured by image processing software from SEM images of each sample, and statistical analysis was performed subsequently. The sampling number of each group was more than 1000. The Fourier transform infrared spectroscopy (FT-IR) spectra were measured by a VERTEX 70 (Bruker) spectrometer with KBr pellet technique ranging from 500 to 4000 cm−1. For 13C NMR analysis, D2O was added into 0.1 M sucrose solutions reacted for various reaction times. The 13C NMR spectra of solutions were recorded using Bruker Avance 600 MHz (14.09 T) spectrometer.

Results and discussion

Variation tendency of products

Reaction temperature (180 °C) was regarded as constant parameter in carbonization process. Initially, a series of experiments were conducted at 0.333 M for different reaction times in both Slow Heating (SH) and Rapid Heating (RH) routes. The results demonstrate that no solid product could be obtained when reaction time was less than 2.5 h in SH route and 2 h in RH route, only brown and viscous liquids existed. Besides, the mean diameters of carbonaceous spheres obtained in both heating routes are no less than 200 nm (Table S1, Fig. 1 and 2). Although carbonaceous spheres appeared in RH route for 2 h and 2.25 h, the statistical results were unreliable due to low yield. There is no remarkable change between SH and RH routes in mean diameter, range and standard deviation of products under high concentration.
image file: c5ra26725k-f1.tif
Fig. 1 SEM images and diameter histograms of carbonaceous spheres under various experimental conditions. Sucrose hydrothermally treated (180 °C) at 0.333 M in slow heating route for (a) 2.5 h, (b) 2.75 h, (c) 3 h, (d) 3.5 h, in rapid heating route for (e) 2.5 h, (f) 2.75 h, (g) 3 h, (h) 3.5 h.

image file: c5ra26725k-f2.tif
Fig. 2 The variation of diameters of carbonaceous spheres obtained at 0.333 M for different reaction times in slow heating and rapid heating routes. The bound of error bar represents 90% range of statistical samples, and the intermediate point reflects the mean diameter of carbonaceous spheres among 50% range in each group.

Furthermore, sucrose solutions with different concentrations were hydrothermally treated in both SH and RH routes for 4 h, as listed in Table S2. SEM images and distribution histograms of carbonaceous spheres are presented in Fig. 3 and 4. It is clear that carbonaceous spheres with regular spherical shapes and smooth surfaces were obtained, and that the mean diameters of carbonaceous spheres reduced and the size distribution narrowed with decreasing sucrose concentrations in both heating routes. It is worth noting that no solid products appeared in the case of 0.067 M solution reacted for 4 h in SH route. Adhesions between carbonaceous spheres could be observed in Fig. 4(f), indicates that the growth of products is quicker in RH route than that in SH route. Meanwhile, the bound of statistic range and mean diameter in RH route exceed those in SH route when concentration was beyond 0.167 M, on the contrary, the values in RH route are lower than values in SH route when concentration was below 0.167 M, as shown in Fig. 5. So, a brief conclusion could be reached that rapid heating route is more suitable for synthesizing carbonaceous spheres with smaller sizes.


image file: c5ra26725k-f3.tif
Fig. 3 SEM images and diameter histograms of carbonaceous spheres under various experimental conditions. Sucrose hydrothermally treated in slow heating route for 4 h at (a) 0.100 M, (b) 0.167 M, (c) 0.233 M, (d) 0.300 M, (e) 0.333 M.

image file: c5ra26725k-f4.tif
Fig. 4 SEM images and diameter histograms of carbonaceous spheres under various experimental conditions. Sucrose hydrothermally treated in rapid heating route for 4 h at (a) 0.067 M, (b) 0.100 M, (c) 0.167 M, (d) 0.233 M, (e) 0.300 M, (f) 0.333 M.

image file: c5ra26725k-f5.tif
Fig. 5 The variations of diameters of carbonaceous spheres obtained in slow heating and rapid heating routes with different concentrations. The bound of error bar represents 90% range of statistical samples, and the intermediate point reflects the mean diameter of carbonaceous spheres among 50% range in each group.

In order to elucidate accurate processes involved with formation and growth of carbonaceous spheres with small diameter and narrow size distribution, 0.067 and 0.100 M solutions of sucrose were hydrothermally reacted in RH route for various reaction times. Fig. 6 presents SEM images and diameter histograms of products obtained at 0.100 M solutions in RH route. The inspiring results show that the mean diameters of most groups are below 200 nm. Statistic results show that the mean diameters and standard deviations of products obtained at 0.100 M for 3 h, 3.5 h, 3.75 h, 4 h, 4.5 h, 5 h, 5.5 h in RH heating route are 162.22 ± 50.32, 189.78 ± 35.38, 138.43 ± 22.82, 192.81 ± 38.70, 192.38 ± 31.58, 208.28 ± 37.99, 288.08 ± 46.09 nm respectively, as listed in Table S2. That is to say, there is a sudden drop in mean diameter and a narrow size distribution in the case of 0.100 M for 3.75 h in RH route, which is obviously presented in Fig. 6 and 8. Similar phenomenon that mean diameter of products decreases with reaction time appears in the cases of 0.067 M. From 3 h to 3.5 h the mean diameter increases mainly due to growth of colloidal spheres, after 3.5 h, the mean diameter and bound of 90% range of carbonaceous spheres decrease gradually, as shown in Fig. 7 and 8. In fact, the mean diameter of whole products reduce significantly due to newly-formed carbonaceous spheres in large quantities, whose sizes are relatively small. This phenomenon is related to the formation and growth of carbonaceous spheres, and a detailed illustration is available in following sections.


image file: c5ra26725k-f6.tif
Fig. 6 SEM images and diameter histograms of carbonaceous spheres under different experimental conditions. Sucrose hydrothermally treated in rapid heating route at 0.100 M for (a) 3 h, (b) 3.5 h, (c) 3.75 h, (d) 4 h, (e) 4.5 h, (f) 5 h, (g) 5.5 h.

image file: c5ra26725k-f7.tif
Fig. 7 SEM images and diameter histograms of carbonaceous spheres under different experimental conditions. Sucrose hydrothermally treated in rapid heating route at 0.067 M for (a) 3 h, (b) 3.5 h, (c) 3.75 h, (d) 4 h, (e) 4.5 h, (f) 5 h, (g) 5.5 h.

image file: c5ra26725k-f8.tif
Fig. 8 The variations of diameters of carbonaceous spheres obtained at low concentration for different reaction time in rapid heating mode. The bound of error bar represents 90% range of statistical samples, and the intermediate point reflects the mean diameter of carbonaceous spheres among 50% range in each group.

Chemical characterization

FT-IR spectra of the typical products obtained in SH and RH routes are shown in Fig. 9. It is obvious that there is no significant difference among these spectra, confirming that heating route and reaction time have little influence on the species of functional groups. The bands positioned at 1615 and 1510 cm−1, are attributed to C[double bond, length as m-dash]C vibrations.20,22,25 There are also several characteristic absorption bands at 3420 cm−1 (O–H stretching vibration), 2926 and 1461 cm−1 (stretching vibration of aliphatic C–H), 1023 cm−1 (characteristic furan 1030 to 1015 cm−1 band), whereas the bands at 1708 and 1384 cm−1 correspond to stretching vibrations of C[double bond, length as m-dash]O (carbonyl, or carboxyl) and C–H in the carbonyl, respectively.12,20,22,23 Moreover, the bands at 1299 and 1213 cm−1 are attributed to C–O–C stretching vibration,20 and band at 796 cm−1 is assigned to out-of-plane bending vibrations of C–H in RCH[double bond, length as m-dash]CHR groups.
image file: c5ra26725k-f9.tif
Fig. 9 The FT-IR spectra of typical products obtained from (a) slow heating and (b) rapid heating routes.

Fig. 10(a) clearly shows solution 13C NMR spectra of 0.100 M sucrose solutions treated for various reaction times at 180 °C. Sucrose (103.54, 92.05, 81.27, 76.38, 73.97, 72.59, 72.30, 71.05, 69.19, 62.33, 61.30, 60.09 ppm) remained stable in 1 h, while no chemical shift of sucrose could be found in solution 13C NMR spectrum for 2 h, indicating that sucrose totally hydrolyzed into fructose and glucose. The isomers of glucose and fructose, including α-D-glucopyranose (92.05, 72.78, 71.49, 71.34, 69.62, 60.56 ppm), β-D-glucopyranose (95.87, 75.85, 75.77, 74.16, 69.58, 60.73 ppm), α-D-fructofuranose (104.37, 81.99, 81.21, 76.02, 62.92, 61.06 ppm), β-D-fructopyranose (98.01, 69.68, 69.18, 67.55, 63.88, 63.26 ppm) and β-D-fructofuranose (101.43, 80.57, 75.36, 74.41, 62.66, 62.34 ppm),31,32 were detected, as shown in Fig. 10(b). 5-Hydroxymethylfurfural (HMF) (180.37, 161.28, 151.69, 126.82, 110.89, 56.04 ppm) in a trace amount was also found in solution reacted for 2 h. Besides, formic acid (166.20 ppm) was initially detected in 3 h solution, while both acetic acid (176.69, 20.40 ppm) and levulinic acid (177.43, 37.66, 29.23, 27.77 ppm) for 3.75 h solution, respectively. Chemical structures of these four substances are schematically shown above the NMR spectra. And the approximate durations of chemicals existed in 0.100 M sucrose solutions are shown in Fig. 11.


image file: c5ra26725k-f10.tif
Fig. 10 (a) The 13C solution NMR spectra of 0.100 M sucrose solutions treated for different reaction times at 180 °C, (b) typical 13C solution NMR spectrum of isomers of glucose and fructose from solution reacted for 2 h.

image file: c5ra26725k-f11.tif
Fig. 11 The approximate durations of chemicals existed in 0.100 M sucrose solutions.

Mechanism for formation and growth of carbonaceous spheres

The experimental results presented above demonstrate that whole formation process of carbonaceous spheres is complex, and it includes several by-products. The proposed mechanism is schematically illustrated in Fig. 12. In the first step, the formation of HMF molecules holds dominant position. At first, sucrose hydrolyzes into fructose and glucose, catalyzed by hydronium ions generated by water autoionization.33 The process involved formation of HMF molecules could be divided into three parts as follows: α-D-fructofuranose and β-D-fructofuranose convert to HMF via intramolecular dehydration by losing 3H2O directly, at the same time, α-D-glucopyranose and β-D-glucopyranose transform into β-D-fructopyranose, and β-D-fructopyranose transforms into α-D-fructofuranose and β-D-fructofuranose by tautomerization, respectively. The processes above match well with pathways of conversions from D-fructose and D-glucose to HMF.31,32 As a consequence, there is a steady flow of HMF in initial stage.
image file: c5ra26725k-f12.tif
Fig. 12 (a) Detailed illustration of formation and convention of involved chemicals, (b) mechanism for formation and growth of carbonaceous spheres form sucrose by hydrothermal carbonization.

In the second step, polycondensation reactions occur between dissolvable HMF molecules, in similar mechanism proposed by Zhang et al.28 Three most possible cross-linking pathways among HMF molecules, including two forms of α-carbon bindings and one form of β-carbon binding have been confirmed based on 13C DQ-SQ MAS NMR results.29 With the extension of time, the process of cross-linking proceeds to form three dimensional furanic structure. This structure grows by continuous dehydration of HMF monomer, and the relative quantities of dissolvable functional groups (i.e., hydroxy and aldehyde groups) decrease with consistent increase in volume, which lead them to become hydrophobic and precipitate from solution eventually. The nano-sized precipitations, named as “primary particles”,28 which are typically around 5 nm in size, are also found in our solid products (0.100 M for 3.5 h, 0.067 M for 3 h and 3.5 h, RH route) after centrifugation, as shown in Fig. S1.

In the third step, formation and growth of small-sized carbonaceous spheres are involved. Herein, carbonaceous spheres obtained from almost all cases could be classified as two batches according to differentiation of the formation time. The primary particles aforementioned are inclined to aggregate due to diminution of surface free energy via reactions among functional groups existing in their surfaces. As a consequence, the first batch of carbonaceous spheres appears in hydrothermal solution in spite of relatively small amount of primary particles in early stage (carbonaceous spheres obtained at 0.100 M for 3 h in RH route). Formic acid was initially detected in 0.100 M solution for 3 h by solution 13C NMR, besides, numerous primary particles were only found in 0.100 M solution reacted for 3.5 h. In other words, formic acid produced acts as catalyst to accelerate conversion of fructose to HMF, which is consistent with autocatalysis process of fructose,34,35 and leads to rapid increase of HMF concentration in 0.100 M solutions after 3 h. Simultaneously, the amount of newly-formed primary particles grows dramatically within the duration from 3 h to 3.5 h in 0.100 M solutions. From 3.5 h to 3.75 h, the amount of newly-formed primary particles reaches a oversaturated state, and they aggregate rapidly to form the second batch of carbonaceous spheres in massive amount. In general, the precipitation of primary particles is dominant in the period from 3 h to 3.5 h, the growth of first batch of carbonaceous spheres as supplementary; the period from 3.5 h to 3.75 h is dominated by the formation of second batch of carbonaceous spheres, accompanied by the growth of both batches of carbonaceous spheres. The size of second batch of carbonaceous spheres is smaller than that of first batch due to lacking of enough growth, and the quantity of second batch is much more than first batch, these make a rational interpretation of the sudden drop in mean diameter and narrow size distribution of carbonaceous spheres in 0.100 M solution reacted for 3.75 h.

The whole growth of carbonaceous spheres can be divided into three stages based on the experimental results and varieties of growth units. In the first growth stage, both primary particles and HMF molecules can constitute new surfaces of carbonaceous spheres in first batch via dehydration reaction. At the early phase of the first growth stage, the amount of carbonaceous spheres has no obvious change, the mean diameter of carbonaceous spheres increases slightly because of scarcity of growth units, just as the change in the range of 3 h to 3.5 h in 0.100 M solution (RH route) shown in Fig. 8. The later phase of the first growth stage is occupied by rapid growth, the quantity of carbonaceous spheres is much more than that at early phase, and the mean diameter increases from 138 to 190 nm within quarter hour, corresponding to range from 3.75 h to 4 h in 0.100 M solutions. Here, the residual primary particles which are not involved in formation of second batch of carbonaceous spheres make an enormous contribution to rapid growth of whole products by direct depositions on their surfaces in abundance. Whereafter, carbonaceous spheres grow slowly in the second growth stage, which corresponds to the duration from 4 h to 5 h in 0.100 M solutions. No primary particle could be found in solutions hydrothermally treated for more than 3.5 h in 0.100 M solutions (RH route), which means HMF molecules act as main building units in second growth stage. The carbonaceous spheres already existed provide a widespread area of reaction interface for dehydration of HMF molecules in the second growth stage, so the formation of carbonaceous spheres almost comes to the end. As for the third growth stage, the mean diameters of carbonaceous spheres increase rapidly after 5 h in 0.100 M groups. The porous surface layers of carbonaceous spheres reacted for 5 h in 0.100 M solution provide sufficient space for embedability of levulinic acid and other molecules,29 accompanied by dehydration of HMF molecules, which lead to dramatically increase the size of products. Although the accurate boundaries of these three growth stages are difficult to distinguish, fundamental distinctions among them are the varieties of growth units.

Discussion

Based on FT-IR results, cross-link furanic rings derived from polycondensation of HMF molecules are confirmed by the characteristic furan band at 1023 cm−1. The simplified model is clear that the carbonaceous spheres consist of two parts, inner core is mostly full of stable cross-linked groups, outer shell contains lots of reactive groups (i.e. hydroxyl, carbonyl), which make inner core hydrophobic and outer shell hydrophilic. And mechanism involved with growth discussed above is consistent with this model.

There are several acids produced during hydrothermal process. The formic acid and levulinic acid are directly generated by rehydration of HMF,5 and acetic acid comes from fragmentation of fructose.36 These acids lower the pH value of solutions, and facilitate the conversion of fructose to HMF.8 And embedded levulinic acid is confirmed in carbonaceous spheres based on solid state 13C NMR characterization,29 levulinic acid is considered indispensable in the growth of carbonaceous spheres. So acids can act not only as catalysts to accelerate dehydration of HMF in initial stage, but also as embedded units in the third growth stage.

The formation and growth of carbonaceous spheres is not consistent with the conventional LaMer model, which includes outburst nucleation and subsequent growth by molecular attachment.27 The LaMer model is heavily dependent on the concentration of feedstock, and oversaturation is only criterion for nucleation in solution. As mentioned above, the second batch of carbonaceous spheres formed due to the oversaturation of primary particles, and HMF molecules play an important role in growth. So no accurate feedstock could be distinguished in whole process of formation and growth, neither HMF nor primary particle. Carbonaceous spheres could also be obtained in very low concentration (0.050 M for 6 h, 0.033 M for 10 h, Fig. S2), which indicates that no standard concentration for nucleation and that enough reaction time guarantees to generate carbonaceous spheres even in tiny concentration of reactant.

The duration of formation of carbonaceous spheres in second batch changes with initial concentration of sucrose, as shown in Fig. 8. The values are about 0.25 h and 1.5 h for 0.100 and 0.067 M solutions (0.100 M solution from 3.5 h to 3.75 h, 0.067 M solution from 3.5 h to 5 h), respectively, while the mean diameters of products at the end of duration are around 138 and 123 nm for 0.100 and 0.067 M. These indicate that the initial concentration of sucrose greatly influences the amounts of HMF molecules and primary particles, resulting in changes of duration of formation and size of carbonaceous spheres on the whole. So it is reasonable to assume that carbonaceous spheres with smaller sizes appear in lower concentration and longer reaction time, and no distinct reduction in sizes with the time in high concentration as short duration of formation in second batch. As a consequence, it is certainly preferable to choose carbonaceous spheres reacted at the end of duration of formation of second batch, which have distinct advantages of small size, narrow distribution and high yield.

Conclusions

In summary, the mechanism of formation and growth of carbonaceous spheres derived from sucrose under hydrothermal conditions has been investigated in this study, and a new model for the formation and growth has been proposed here. The results demonstrate that the carbonaceous spheres formed can be classified as two batches, the first batch of carbonaceous spheres in small quantity comes from aggregation of primary particles derived from polycondensation of HMF molecules, and the second batch in large quantity attributes to autocatalysis of fructose by the yielded acid (formic acid) from rehydration of HMF, which lead to the peculiar phenomenon of sudden drop in mean diameter. The growth of carbonaceous spheres should be divided into three stages due to varieties of growth units, HMF and primary particles for the first stage, only HMF for the second stage, HMF and embedded molecules for third stage. Combined with changes of quantity of carbonaceous spheres, the different growth units contribute to variation of growth rate of solid products in these three growth stages. The conventional LaMer model is not applicable in hydrothermal carbonization of sucrose, due to unavailability of accurate feedstock. In addition, monodisperse carbonaceous spheres reacted at the end of duration of formation of second batch are optimal choices among various cases, due to small size, narrow distribution and high yield.

Acknowledgements

The authors wish to acknowledge financial support from the National Natural Science Foundation of China (grant No. 51172040) and the Fundamental Research Funds for the Central Universities (grant No. N130105001).

Notes and references

  1. A. A. Deshmukh, S. D. Mhlanga and N. J. Coville, Mater. Sci. Eng., R, 2010, 70, 1 CrossRef.
  2. M. M. Titirici and M. Antonietti, Chem. Soc. Rev., 2010, 39, 103 RSC.
  3. E. Berl and A. Schmidt, Liebigs Ann. Chem., 1932, 493, 97 CrossRef CAS.
  4. J. Schuhmacher, F. Huntjens and D. Vankrevelen, Fuel, 1960, 39, 223 CAS.
  5. T. M. Aida, Y. Sato, M. Watanabe, K. Tajima, T. Nonaka, H. Hattori and K. Arai, J. Supercrit. Fluids, 2007, 40, 381 CrossRef CAS.
  6. A. Sinag, A. Kruse and V. Schwarzkopf, Eng. Life Sci., 2003, 3, 469 CrossRef CAS.
  7. B. M. Kabyemela, T. Adschiri, R. M. Malaluan and K. Arai, Ind. Eng. Chem. Res., 1999, 38, 2888 CrossRef CAS.
  8. F. S. Asghari and H. Yoshida, Ind. Eng. Chem. Res., 2006, 45, 2163 CrossRef CAS.
  9. Q. Wang, H. Li, L. Chen and X. Huang, Solid State Ionics, 2002, 152, 43 CrossRef.
  10. Q. Wang, H. Li, L. Chen and X. Huang, Carbon, 2001, 39, 2211 CrossRef CAS.
  11. A. J. Romero-Anaya, M. Ouzzine, M. Lillo-Ródenas and A. Linares-Solano, Carbon, 2014, 68, 296 CrossRef CAS.
  12. M. Li, W. Li and S. Liu, Carbohydr. Res., 2011, 346, 999 CrossRef CAS PubMed.
  13. C. Burda, X. Chen, R. Narayanan and M. A. El-Sayed, Chem. Rev., 2005, 105, 1025 CrossRef CAS PubMed.
  14. G. Patrinoiu, J. M. Calderon-Moreno, R. Birjega and O. Carp, RSC Adv., 2015, 5, 31768 RSC.
  15. H. M. Abdelaal, E. Pfeifer, C. Grünberg and B. Harbrecht, Mater. Lett., 2014, 136, 4 CrossRef CAS.
  16. W. Caihong, X. Chu and M. Wu, Sens. Actuators, B, 2007, 120, 508 CrossRef.
  17. X. Sun and Y. Li, Angew. Chem., Int. Ed., 2004, 43, 3827 CrossRef CAS PubMed.
  18. Z. Dong, X. Lai, J. E. Halpert, N. Yang, L. Yi, J. Zhai, D. Wang, Z. Tang and L. Jiang, Adv. Mater., 2012, 24, 1046 CrossRef CAS PubMed.
  19. D. Wang, M. Chen, C. Wang, J. Bai and J. Zheng, Mater. Lett., 2011, 65, 1069 CrossRef CAS.
  20. J. Ryu, Y. W. Suh, D. J. Suh and D. J. Ahn, Carbon, 2010, 48, 1990 CrossRef CAS.
  21. X. Sun and Y. Li, Angew. Chem., Int. Ed., 2004, 43, 597 CrossRef PubMed.
  22. M. Sevilla and A. B. Fuertes, Chem.–Eur. J., 2009, 15, 4195 CrossRef CAS PubMed.
  23. M. Zheng, Y. Liu, K. Jiang, Y. Xiao and D. Yuan, Carbon, 2010, 48, 1224 CrossRef CAS.
  24. C. Yao, Y. Shin, L. Q. Wang, C. F. Windisch, W. D. Samuels, B. W. Arey, C. Wang, W. M. Risen and G. J. Exarhos, J. Phys. Chem. C, 2007, 111, 15141 CAS.
  25. M. Sevilla and A. B. Fuertes, Carbon, 2009, 47, 2281 CrossRef CAS.
  26. Y. Shin, L. Q. Wang, I. T. Bae, B. W. Arey and G. J. Exarhos, J. Phys. Chem. C, 2008, 112, 14236 CAS.
  27. V. K. LaMer, Ind. Eng. Chem., 1952, 44, 1270 CrossRef CAS.
  28. M. Zhang, H. Yang, Y. Liu, X. Sun, D. Zhang and D. Xue, Carbon, 2012, 50, 2155 CrossRef CAS.
  29. N. Baccile, G. Laurent, F. Babonneau, F. Fayon, M. M. Titirici and M. Antonietti, J. Phys. Chem. C, 2009, 113, 9644 CAS.
  30. C. Falco, F. Perez Caballero, F. Babonneau, C. Gervais, G. Laurent, M. M. Titirici and N. Baccile, Langmuir, 2011, 27, 14460 CrossRef CAS PubMed.
  31. H. Kimura, M. Nakahara and N. Matubayasi, J. Phys. Chem. A, 2013, 117, 2102 CrossRef CAS PubMed.
  32. H. Kimura, M. Nakahara and N. Matubayasi, J. Phys. Chem. A, 2011, 115, 14013 CrossRef CAS PubMed.
  33. J. C. Tanger and K. S. Pitzer, AIChE J., 1989, 35, 1631 CrossRef CAS.
  34. H. Ma, F. Wang, Y. Yu, L. Wang and X. Li, Ind. Eng. Chem. Res., 2015, 54, 2657 CrossRef CAS.
  35. A. Ranoux, K. Djanashvili, I. W. C. E. Arends and U. Hanefeld, ACS Catal., 2013, 3, 760 CrossRef CAS.
  36. H. R. Holgate, J. C. Meyer and J. W. Tester, AIChE J., 1995, 41, 637 CrossRef CAS.

Footnote

Electronic supplementary information (ESI) available: Two tables showing synthesis conditions and statistic results, and two figures supplying detailed evidences for proposed mechanism. See DOI: 10.1039/c5ra26725k

This journal is © The Royal Society of Chemistry 2016