In situ synthesis of a bio-cellulose/titanium dioxide nanocomposite by using a cell-free system

Muhammad Wajid Ullaha, Mazhar Ul-Islamab, Shaukat Khana, Yeji Kima, Jae Hyun Janga and Joong Kon Park*a
aDepartment of Chemical Engineering, Kyungpook National University, Daegu 702-701, Korea. E-mail: parkjk@knu.ac.kr; Fax: +82 539506615; Tel: +82 539505621
bDepartment of Chemical Engineering, College of Engineering, Dhofar University, Salalah, 211, Oman

Received 14th December 2015 , Accepted 19th February 2016

First published on 22nd February 2016


Abstract

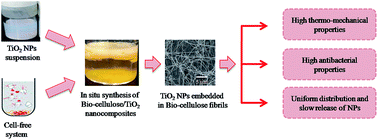
In the current study, nanocomposites of bio-cellulose with titanium dioxide nanoparticles (TiO2-NPs) were synthesized by an in situ strategy using a cell-free system. The system was developed from Gluconacetobacter hansenii PJK through bead beating. A suspension of TiO2-NPs was prepared in 1% sodium dodecyl sulfate and added to the cell-free extract of G. hansenii PJK. The bio-cellulose/TiO2 nanocomposite was synthesized at 30 °C, pH 5.0 for 5 days (bio-cellulose/TiO2-I), 10 days (bio-cellulose/TiO2-II), and 15 days (bio-cellulose/TiO2-III) using 10 g L−1 glucose. Field-emission scanning electron microscopy (FE-SEM) confirmed the structural features and impregnation of TiO2-NPs into the bio-cellulose matrix. Fourier transform-infrared (FT-IR) spectroscopy confirmed the presence of Ti–O groups in the chemical structure of the nanocomposite. X-ray diffraction (XRD) analysis indicated the presence of specific peaks for bio-cellulose and TiO2-NPs in the nanocomposite. The TiO2-NP uptake by bio-cellulose was greatly increased with time and 40 ± 1.6% of the initially added nanoparticles were successfully impregnated into the nanocomposite after 15 days of incubation. NP release analysis revealed minute detachment though a prolonged treatment time of 10 days. The synthesized nanocomposite showed better thermal and mechanical properties compared to pure bio-cellulose. The antibacterial test revealed impressive results where the inhibition zones produced against E. coli by bio-cellulose, bio-cellulose/TiO2-I, bio-cellulose/TiO2-II, and bio-cellulose/TiO2-III were zero, 2.1 cm, 2.5 cm, and 3.7 cm, respectively. The current strategy can be effectively employed for the development of composite materials of biopolymers with several kinds of bactericidal elements.
Introduction

Biopolymers are extensively used as support materials for various applications due to their excellent physico-mechanical and biological properties. However, their widespread applications in biomedical research are limited due to their lack of bactericidal properties. This inadequacy has been overcome through the development of polymers–nanomaterials composites.1,2 In such composites, the polymer serves as a support material while the inorganic nanoparticles act as a reinforcement material that possess the bactericidal properties.1,3 These nanocomposites have shown impressive magnetic, electrical, catalytic, optical, and biological properties.4,5 Several types of nanoparticles have been reported for the development of nanocomposites such as metals (Ag, Au, etc.) and metal oxides (ZnO, TiO2, CoO, MgO, CaO, NiO, etc.).1,2 Among these, the TiO2 nanoparticle is a multifunctional metal oxide that has received immense consideration owing to its unique structural, thermal, electronic, optical, and antibacterial properties. Recent investigations have shown great potential for the application of TiO2 nanoparticles in the areas of photovoltaics, photocatalysis, photoelectrochromics, and sensor development.2,6 Further, TiO2 is considered a safe material for application in sunscreens, ointments, and toothpastes due to it being non-toxic to animal and human cells.2

Microbial cellulose, a biopolymer produced by several microbial species, has received immense consideration owing to its purity, improved physico-mechanical, and biological properties.7,8 It serves as a carrier in drug delivery systems, enzyme immobilization, and scaffold for tissue engineering, which further highlights its importance in several fields.9–11 Furthermore, it possesses a high potential to form composites with most biocompatible and bactericidal elements.9,12,13 Microbial cellulose is composed of a fibrous structure where thin fibrils are interconnected through inter- and intra-molecular hydrogen bonding that stabilize its reticulate structure.14 The fibrils are loosely arranged with empty spaces between them that result in expanded surface area and a highly porous matrix.15–17 Further, the strong and stable fibrils offer better resistance to applied force and resist any variation in its structure. Similarly, the empty spaces between the fibrils can accommodate liquids and media components as well as small particles, thus supporting the formation of composites with several nano- and biocompatible polymeric materials.

Several methods have been reported for the synthesis of composites of microbial cellulose with other materials such as in situ, ex situ, and solvent dissolution and regeneration methods.1,2 However, these methods have several limitations such as the in situ method encounters limitation due to the cytotoxic effects of bactericidal elements against microbial cells; the ex situ method is confined to only nano-sized materials owing to the difficulty of penetrating the well-arranged fibril network; and the solvent dissolution and regeneration method alters the reticulate structure of microbial cellulose, and consequently, its physico-mechanical and biological properties.1,2,18 Thus, the need was extensively felt to develop an alternative approach for producing cellulose and preparing its composites with a wide range of materials for multifarious applications. Recently, we have developed a cell-free system for production of bio-cellulose that showed improved yield.19 Moreover, the produced bio-cellulose exhibited improved physico-mechanical properties.20 The system was entirely comprised of enzymes and not the microbial cells, and hence, can be utilized for the in situ preparation of composites of bio-cellulose with a wide range of nanomaterials of any type and size.

The current study was aimed to develop nanocomposites of bio-cellulose with TiO2 nanoparticles through an in situ strategy using a cell-free system. The synthesis mechanism of nanocomposite by a cell-free system was described, and its structural features and antibacterial activity against bacterial cells were investigated. This developed approach for the synthesis of nanocomposite can be effectively extended to the synthesis of other composite materials of diverse nature and a wide range of applications.

Materials and methods

Materials

The chemical reagents including titanium tetrachloride (TiCl4), anhydrous benzyl alcohol (C6H5CH2OH), glucose (C6H12O6), sodium hydroxide (NaOH), osmium tetroxide (OsO4), phosphate-buffered saline (PBS), glutaraldehyde [CH2(CH2CHO)2], succinic acid (C4H6O4), acetic acid (CH3COOH), and glass beads (425–600 μm) were purchased from Sigma-Aldrich (St. Louis, MO, USA). Whatman® microfilter (0.45 μm) was purchased from GE Life Sciences (Pittsburgh, PA, USA). Yeast extract and peptone were purchased from Becton, Dickinson and Company (Le Pont de Claix, France). All the reagents were utilized in the experiments without any additional processing.

Synthesis of TiO2 nanoparticles and preparation of suspension

The TiO2 nanoparticles were synthesized by slowly adding the TiCl4 to benzyl alcohol in a dropwise fashion as reported previously.2,21 Briefly, 80 mL of benzyl alcohol was placed in a pre-dried two-necked flask followed by the dropwise addition of 1 mL of TiCl4 under nitrogen flow. The mixture was heated to 80 °C and stirred for 24 h. The resultant white suspension was isolated and washed several times with distilled water and ethanol followed by calcination at 900 °C for 1 h.

The TiO2 nanoparticles suspension was prepared by sonication after suspending the nanoparticles in distilled water with different concentrations of SDS solutions (0.5, 1, 2, and 5%). A suspension of TiO2 nanoparticles prepared in distilled water was used as a reference. All suspensions were sonicated at 25 min intervals until all the nanoparticles were in suspended form. Thereafter, the suspensions were regularly observed for 15 days, after which their absorbance was determined at 315 nm.

Microorganism and cell culture

G. hansenii PJK (KCTC 10505BP) was grown in a basal medium as described previously.1,19 Briefly, the basal medium was prepared by adding glucose 10 g L−1, yeast extract 10 g L−1, peptone 7 g L−1, acetic acid 1.5 mL L−1, and succinic acid 0.2 g L−1 to distilled water. The pH of the medium was adjusted to 5.0 with 1.0 M NaOH. The prepared basal medium was sterilized for 15 min at 15 psi and 121 °C. A few colonies from the G. hansenii PJK culture plate were inoculated into 100 mL of basal broth medium in a 250 mL Erlenmeyer flask and incubated for 24 h at 30 °C under shaking conditions (150 rpm). Similarly, E. coli (KCCM 12119) was grown on nutrient agar medium containing 3 g L−1 beef extract, 5 g L−1 peptone, and 15 g L−1 agar in distilled water. The pH of the medium was adjusted to 7.0 with 1.0 M NaOH.

Development of the cell-free system

The cell-free system was developed using bead beating, as reported previously.19,22–24 Briefly, a freshly prepared 50 mL culture of G. hansenii PJK was taken in a Becton Dickinson (BD) falcon tube and centrifuged at 3500 rpm for 15 min. The pellet was resuspended in 5 mL of the supernatant to attain a 10× concentrated cell culture. The density of the culture rose to 2.6 × 10⁷ cells per mL. Thereafter, equal volumes of the concentrated cell culture and sterile chilled glass beads (425–600 μm) were put into a sterilized glass vial, and vortexed for 20 min to rupture the bacterial cells. The samples were incubated on ice at regular intervals of 2.0 min during beating to avoid thermal denaturation of the cellular proteins. The lysate was then collected using a sterile syringe. The cell-free lysate was passed through a Whatman® microfilter (0.45 μm) to remove cell debris, as described previously.25 The protein concentration of the cell-free lysate was determined by the Bradford assay and found to be 93.84 μg mL−1.

Synthesis of the bio-cellulose/TiO2 nanocomposite

Two parallel experiments were performed for the synthesis of bio-cellulose, and the bio-cellulose/TiO2 nanocomposite using the cell-free system. 1.0 mL of the suspension containing 0.0137 ± 0.0021 g of TiO2 nanoparticles was added to the culture medium for the synthesis of the nanocomposite. The synthesis was carried out in static culture for 3, 5, 10, and 15 days at 30 °C and pH 5.0 using 10 g L−1 glucose. Bio-cellulose and bio-cellulose/TiO2 nanocomposites were harvested after 5 days (bio-cellulose/TiO2-I), 10 days (bio-cellulose/TiO2-II), and 15 days (bio-cellulose/TiO2-III) and washed several times with deionized distilled water until the pH became neutral and all media components were removed. The samples were freeze-dried until used for various analyses.

Nanoparticles uptake analysis

The initial amount of TiO2 nanoparticles in the incubation mixture for nanocomposite synthesis was determined using a standard curve generated using a UV-visible light spectra.26 The nanoparticles uptake during the in situ synthesis of the nanocomposite by the cell-free system was determined through two methods described below:
Dry-weight based analysis. The weights of freeze-dried samples of bio-cellulose, bio-cellulose/TiO2-I, bio-cellulose/TiO2-II, and bio-cellulose/TiO2-III were determined. The difference of their dry-weights gave the net weight of nanoparticles uptake by each nanocomposite during the in situ synthesis by the cell-free system. Experiments were performed in triplicate, and the average values were taken.
Optical density method. After harvesting the nanocomposites, the sample media from each vial was taken and analyzed for the amount of TiO2 nanoparticles by measuring its absorbance at 315 nm. The difference of initial amount added to the incubation mixture and in the sample medium after harvesting the nanocomposites gave the amount of TiO2 nanoparticles that were impregnated into the bio-cellulose during the in situ synthesis by the cell-free system. The experiment was performed in triplicate, and the average values were taken.

Characterization of the bio-cellulose/TiO2 nanocomposite

The in situ synthesis of the bio-cellulose/TiO2 nanocomposite by the cell-free system was confirmed through several techniques. FE-SEM of the bio-cellulose/TiO2 nanocomposite was performed using a Hitachi S-4800 and EDX-350 (Horiba) FE-SEM (Tokyo Japan). Briefly, the samples were fixed onto a brass holder and coated with osmium tetroxide (OsO4) using a VD HPC-ISW osmium coater (Tokyo Japan) prior to FE-SEM observation. Both surface morphology and cross-sectional views of the samples were done. XRD patterns of both bio-cellulose and the bio-cellulose/TiO2 nanocomposite were recorded using an X-ray diffractometer (X'Pert-APD Philips, Netherlands) with an X-ray generator (3 kW) and anode (LFF Cu). The radiation was CuK-α at 1.54 Å, the X-ray generator tension and current was 40 kV and 30 mA, respectively, and the angle of scanning varied from 0 to 70°. The crystallinity indices of bio-cellulose and the bio-cellulose/TiO2 nanocomposite were determined from the peak area of the crystalline and amorphous regions as reported previously.15

The crystallite size of both samples was calculated using the WHFM values through the Scherrer equation given as follow:

 
image file: c5ra26704h-t1.tif(1)
where L represents the particle size; K is the Scherrer constant; λ is the wavelength of the X-ray; θ is the diffraction angle of the peak; B represents the full width at half height of the peaks (in radian). The crystallinities of both samples were calculated from the relative integrated area of crystalline and amorphous peaks through the following equation:
 
image file: c5ra26704h-t2.tif(2)
where Acr and Aam are the integrated area of the crystalline and amorphous phases, respectively.27

Similarly, the FT-IR spectra of freeze-dried samples of bio-cellulose and the bio-cellulose/TiO2 nanocomposite were recorded by using a Perkin Elmer FTIR spectrophotometer [Spectrum GX & Autoimage, USA, spectral range: 4000–400 cm−1; beam splitter: Ge-coated on KBr; detector: DTGS; resolution: 0.25 cm−1 (step selectable)]. For analysis, the samples were mixed with KBr (IR grade, Merck, Germany) pellets and processed further to obtain IR data that was transferred to a PC to acquire the spectra as reported previously.15

Thermal and mechanical properties of the bio-cellulose/TiO2 nanocomposite

The thermal properties of bio-cellulose and the bio-cellulose/TiO2 nanocomposite were determined through TGA analyses using a thermogravimetric/differential thermal analyzer (Seiko Instruments Inc., Japan). A thermogram for TGA was obtained in the range of 25–800 °C, under nitrogen atmosphere with a temperature increase of 10 °C min−1 as reported previously.15

Similarly, the tensile properties of bio-cellulose and the bio-cellulose/TiO2 nanocomposite were measured using an Instron Universal Testing Machine (Model 4465, USA) according to the procedure described by the American Society for Testing and Materials (ASTM D 882). Briefly, two metal clamps were placed at either end of each 100 mm × 10 mm rectangular strip of freeze-dried samples and then mounted on an Instron 4465 that measured both elongation and maximum tensile load before fracture. The experiment was repeated several times, and the average values were taken for each sample.

Titanium (Ti4+) release

The amount of titanium (Ti4+) released from the nanocomposite was determined by immersing the freeze-dried bio-cellulose/TiO2 nanocomposite (2 cm × 2 cm) in 5 mL of distilled water for different lengths of time (0, 2, 4, 6, 8, and 10 days) at room temperature under static conditions. After the respective period of time, the amount of Ti4+ released into the water was quantified using an inductively coupled plasma spectrophotometer (ICP, Thermo Jarrell Ash IRIS-AP).

Antibacterial activity of the bio-cellulose/TiO2 nanocomposite

Antibacterial activities against E. coli of bio-cellulose and the bio-cellulose/TiO2 nanocomposite were investigated through agar disc diffusion and optical density methods described below:
Agar disc diffusion method. The antibacterial activity of bio-cellulose and bio-cellulose/TiO2 nanocomposites was measured on solid agar plates prepared using the E. coli growth media as reported previously.1 Briefly, freeze-dried samples of bio-cellulose, bio-cellulose/TiO2-I, bio-cellulose/TiO2-II, and bio-cellulose/TiO2-III were cut into disc shapes with a diameter 1.3 cm and sterilized at 121 °C at 15 psi for 15 min. Next, a fresh pre-culture of E. coli was spread on the agar plate, and the discs were placed on top and incubated at 37 °C for 24 h. Finally, the inhibition zones were measured. Herein, the disc prepared from bio-cellulose was used as a control.
Optical density method. The antibacterial activities of bio-cellulose, bio-cellulose/TiO2-I, bio-cellulose/TiO2-II, and bio-cellulose/TiO2-III were investigated through optical density method using E. coli growth medium as reported previously.1 Briefly, freeze-dried samples were sliced into small pieces and sterilized at 121 °C at 15 psi for 15 min. Next, 10 mL of growth medium for E. coil was added to separate test tubes, followed by 0.02 g mL−1 of finely sliced solid bio-cellulose and bio-cellulose/TiO2 nanocomposites. The test tubes were then inoculated with 1 mL of fresh E. coli culture and incubated in a shaking incubator at 37 °C and 150 rpm for 24 h. During incubation, the turbidity of the media at 610 nm was observed using a UV spectrophotometer (T60 U, China).

Statistical analysis

The presented data are the mean values ± standard deviation (SD) of three independent experiments. The results were analyzed by Student's t tests using the Statistical Package for the Social Sciences (SPSS) software. p values ≤0.05 were considered statistically significant.

Results and discussion

Characterization of titanium dioxide nanoparticles and suspension

The UV-visible spectrum of the TiO2 nanoparticle suspension (Fig. 1A) was determined between 150 to 700 nm that gave a central peak at 315 nm (Fig. 1B). This is caused by the excitation of electrons from the valence band to the conduction band of titania. The sharp absorption peak indicates a narrow particle size distribution, which is in agreement with previous reports.2,21 The XRD spectrum of TiO2 nanoparticles further confirmed the UV spectrum results. Various crystallinic peaks of TiO2 nanoparticles are shown in Fig. 1C, which confirms the synthesis of anatase TiO2 nanoparticles. The peaks at 2θ 25.23°, 36.95°, 37.71°, 38.56°, 48.06°, 53.80°, 55.07°, 62.75°, 68.71°, and 70.32° were assigned to the (101), (103), (004), (112), (200), (105), (211), (118), (116), and (220) planes of anatase TiO2, respectively, which is in agreement with previous observations.2,28 The FWHM values for all Miller indices ranged from 0.3–0.4° while the crystal size was in the range of 20–30 nm. The absence of extra peaks in the XRD spectra confirmed the purity of the of TiO2 nanoparticles.
image file: c5ra26704h-f1.tif
Fig. 1 Illustration of (A) preparation of a TiO2 nanoparticles suspension in different concentrations of SDS (0.5, 1, 2, and 5%) through sonication, and naked eye observation after (I) 0 days (reference), (II) 5 days, (III) 10 days, and (IV) 15 days, (B) the UV-visible spectrum of TiO2 nanoparticles, and (C) the X-ray diffraction pattern of TiO2 nanoparticles.

A naked-eye observation of TiO2 nanoparticles suspensions in both distilled water and various concentrations of SDS solutions after sonication showed that the nanoparticles started settling down with the passage of time (Fig. 1A). Nearly all TiO2 nanoparticles suspended in distilled water settled after 24 h. However, the settling rate was much slower for the nanoparticles suspended in different concentrations of SDS solutions. It was observed that nearly all of the nanoparticles suspended in the SDS solutions remained suspended for 15 days, which is in agreement with previous observations.29,30 These results show that the resuspension ability of TiO2 nanoparticles was extended by the addition of detergent during sonication. This improved feature could be very useful during the in situ synthesis of a nanocomposite of bio-cellulose with TiO2 by a cell-free system.

Synthesis of the bio-cellulose/TiO2 nanocomposite

Microbial cellulose production is an aerobic process where cellulose is produced at the air-media interface as an assembly of reticulated crystalline ribbons and forms a gel-like membrane.15,31 Unlike microbial cellulose, bio-cellulose production can take place under anaerobic conditions due to the involvement of enzymes in a cell-free system. It is produced in the form of microfibrils that are uniformly distributed in the culture medium rather at the air-medium interface.19,20 In the current study, bio-cellulose/TiO2 nanocomposites were synthesized by an in situ strategy using a cell-free system. The nanocomposite was analyzed through FE-SEM to confirm the impregnation of TiO2 nanoparticles into the bio-cellulose matrix and its synthesis mechanism during the in situ development by a cell-free system. A detailed description suggesting the possible mechanism of impregnation of TiO2 nanoparticles into the bio-cellulose has been described in Fig. 2.
image file: c5ra26704h-f2.tif
Fig. 2 FE-SEM analysis of (a) the surface and (b) cross-section of bio-cellulose/TiO2-I, (c) the surface and (d) cross section of bio-cellulose/TiO2-II, and (e) the surface and (f) cross section of bio-cellulose/TiO2-III nanocomposites.

Fig. 2 shows the SEM micrographs of surface and cross section of bio-cellulose, bio-cellulose/TiO2-I, bio-cellulose/TiO2-II, and bio-cellulose/TiO2-III nanocomposites synthesized after 5, 10, and 15 days, respectively by the cell-free system. It shows that the TiO2 nanoparticles were impregnated into the bio-cellulose matrix, confirming the successful synthesis of nanocomposite through the in situ strategy. During nanocomposite synthesis, the suspended TiO2 nanoparticles in the culture medium interact with the developing subfibrils from β-1,4-glucan chains that form the micro and macro fibrils, bundles, and ribbons.16,17 The nanoparticles are encaged within the bio-cellulose matrix through hydrogen bonding.15 The synthesis of bio-cellulose/TiO2-I showed that the TiO2 nanoparticles were attached to the fibrils only and were not impregnated into the matrix as shown in Fig. 2a. These observations were in agreement with the cross sectional analysis of the bio-cellulose/TiO2-I nanocomposite that displayed the presence of TiO2 nanoparticles towards the outer surface only and not in the interior of the bio-cellulose matrix (Fig. 2b). Such arrangement of TiO2 nanoparticles in the bio-cellulose matrix could be attributed to the early phase of synthesis by the cell-free system that possessed a loosely arranged matrix. The compactness of the bio-cellulose matrix increases with time as more fibrils and pellicles are produced with the time and added to the pre-existing ones.19,32,33 This resulted in an increased density of TiO2 nanoparticles within the matrix of bio-cellulose/TiO2-II as shown in Fig. 2c. These observations were in agreement with the cross-sectional analysis of bio-cellulose/TiO2-II nanocomposite that displayed the presence of TiO2 nanoparticles in the interior of bio-cellulose matrix (Fig. 2d). The density of TiO2 nanoparticles kept on increasing in the bio-cellulose matrix with time, and a nanocomposite with uniform and deeply impregnated nanoparticles was synthesized as shown by the surface (Fig. 2e) and cross-sectional analyses of the bio-cellulose/TiO2-III nanocomposite (Fig. 2f).

The potential application of a nanocomposite is highly dependent on the amount of impregnated nanoparticles. The conventionally reported strategies of nanocomposite synthesis such as in situ, ex situ, and solvent dissolution and regeneration approaches encounter the limitation of inefficient nanoparticles uptake. This study attempted to overcome this limitation through the development of an in situ strategy using a cell-free system. The nanoparticles uptake during the in situ synthesis of nanocomposite by a cell-free system was determined through two methods: dry-weight analysis and optical density method. The difference of initial nanoparticles concentration added to the mixture and after harvesting the nanocomposite after the respective time period gave the amount of nanoparticles impregnated into the bio-cellulose/TiO2 nanocomposites. The detailed results are described below:

The dry-weight analyses of pure bio-cellulose and bio-cellulose/TiO2 nanocomposite produced under the same experimental conditions by a cell-free system were done to determine the amount of TiO2 nanoparticles impregnated into the nanocomposite. Table 1 shows that 0.0271 ± 0.0038 g, 0.0578 ± 0.0105 g, and 0.0832 ± 0.0108 g bio-cellulose was produced after 5, 10, and 15 days, respectively by the cell-free system. On the other hand, the dry-weights of bio-cellulose/TiO2-I, bio-cellulose/TiO2-II, and bio-cellulose/TiO2-III nanocomposites were found to be 0.0281 ± 0.0042 g, 0.0604 ± 0.0123 g, and 0.0885 ± 0.0084 g, respectively. This indicates the impregnation of 0.0010 g, 0.0026 g, and 0.0054 g corresponding to 3.55%, 4.30%, and 5.99% of the total weights of bio-cellulose/TiO2-I, bio-cellulose/TiO2-II, and bio-cellulose/TiO2-III nanocomposites, respectively. These results show that the impregnation of TiO2 nanoparticles kept increasing with increased time, and 39.4% of the initially added TiO2 nanoparticles (i.e. 0.0137 ± 0.0021 g) were successfully impregnated into the nanocomposite after 15 days. These results are justified by the SEM micrographs that show a clear and increasing trend of nanoparticles impregnation into the bio-cellulose matrix with increasing time (Fig. 2).

Table 1 Illustration of TiO2 uptake during the in situ synthesis of bio-cellulose/TiO2 nanocomposite by cell-free system. The initial amount of TiO2 added to the culture medium was 0.0137 ± 0.0021 g and the synthesis was carried out at 30 °C and pH 5.0 under static condition
Nanocomposite Experiment I (dry-weight method) Experiment II (optical density method)
Dry weight (g) TiO2 up taken in bio-cellulose/TiO2 (g) Amount of TiO2 in culture medium (g) TiO2 up taken in bio-cellulose/TiO2 (g)
Bio-cellulose Bio-cellulose/TiO2
Bio-cellulose/TiO2-I 0.0271 ± 0.0038 0.0281 ± 0.0042 0.0010 0.0104 ± 0.0011 0.0008
Bio-cellulose/TiO2-II 0.0578 ± 0.0105 0.0604 ± 0.0123 0.0026 0.0078 ± 0.0031 0.0034
Bio-cellulose/TiO2-III 0.0832 ± 0.0108 0.0885 ± 0.0084 0.0054 0.0055 ± 0.0022 0.0057


The results of the optical density method indicated a similar trend to that of dry-weight analysis. Optical density analysis of sample medium after harvesting the bio-cellulose/TiO2-I, bio-cellulose/TiO2-II, and bio-cellulose/TiO2-III nanocomposites was carried out using a TiO2 standard curve. The initial amount of TiO2 nanoparticles in the culture medium was found to be 0.0137 ± 0.0021 g determined by the standard curve. The amounts of TiO2 nanoparticles impregnated into the nanocomposites, and non-impregnated nanoparticles in the culture medium are given in Table 1. The optical density analysis of the culture medium shows that 0.0104 ± 0.0011 g, 0.0078 ± 0.0031 g, and 0.0055 ± 0.0022 g of nanoparticles were still present in the culture medium after the synthesis of bio-cellulose/TiO2-I, bio-cellulose/TiO2-II, and bio-cellulose/TiO2-III nanocomposites, respectively. This indicates that 0.0008 g, 0.0034 g, and 0.0057 g of TiO2 nanoparticles, corresponding to 5.83%, 24.81%, and 41.60% of the initially added nanoparticles, were successfully taken up by the bio-cellulose/TiO2-I, bio-cellulose/TiO2-II, and bio-cellulose/TiO2-III nanocomposites, respectively. This is also justified by the SEM micrographs of bio-cellulose/TiO2-I, bio-cellulose/TiO2-II, and bio-cellulose/TiO2-III nanocomposites synthesized in situ by the cell-free system.

Table 1 shows a slight difference between the initially added nanoparticles and the sum of impregnated and unattached nanoparticles in the culture medium. This difference could be attributed to the amount of loosely bound nanoparticles that are removed during the washing of nanocomposites. The amount of TiO2 nanoparticles impregnated into the bio-cellulose matrix determined through the above two different approaches were comparable. A significant difference in the dry-weights of bio-cellulose and bio-cellulose/TiO2 nanocomposites and optical density values of culture media before and after the harvesting the nanocomposites showed that TiO2 nanoparticles were successfully impregnated into the bio-cellulose matrix. Further, the content of impregnated nanoparticles kept on increasing with time and 40 ± 1.6% of the initially added TiO2 nanoparticles were successfully impregnated into the matrix after 15 days.

From the above results, it can be concluded that nanoparticles interact with the microfibrils of bio-cellulose during the early phase of synthesis by a cell-free system. More nanoparticles get impregnated with increasing time and are entrapped more towards the interior of bio-cellulose matrix due to the addition of fibrils and pellicles. Several pellicles containing the impregnated nanoparticles interact with each other and form the larger bio-cellulose sheet containing a large number of impregnated TiO2 nanoparticles (i.e. nanocomposite). The thickness of nanocomposite increases in all directions when more pellicles containing the impregnated nanoparticles are attached. This process continues until all of the substrate available in the medium is consumed, and thus, a nanocomposite with a large number of impregnated nanoparticles is formed. These observations suggest that the in situ synthesis approach using a cell-free system ensures the uniform distribution of nanoparticles within the bio-cellulose matrix.

Characterization of the bio-cellulose/TiO2 nanocomposite

The synthetic accuracy and structural features of the synthesized nanocomposites were confirmed through FTIR and XRD analyses. The combined FTIR spectra of bio-cellulose and the bio-cellulose/TiO2 nanocomposite are shown in Fig. 3A, indicating the positions of various functional groups.
image file: c5ra26704h-f3.tif
Fig. 3 (A) Fourier transform-infrared spectral analysis of bio-cellulose and the bio-cellulose/TiO2 nanocomposite produced under static conditions at 30 °C and pH 5.0. (B) The X-ray diffraction patterns of bio-cellulose and the bio-cellulose/TiO2 nanocomposite produced under static conditions at 30 °C and pH 5.0.

The FT-IR spectra of bio-cellulose contained basic peaks for all chemical groups in cellulose and thereby confirmed the basic structure of pure cellulose. The spectra of bio-cellulose showed characteristic peaks for OH stretching at 3364 cm−1, which are in agreement with previous observations.14,18,20 A broader peak for bio-cellulose indicated stronger OH bonding.20 Similarly, peaks were obtained for a CH stretching vibration at 2924 cm−1 as reported previously.14,18,20 The presence of the CH group was further supported by the appearance of several peaks corresponding to CH bending vibrations at 1450–1200 cm−1.13,20 In addition, two characteristic peaks at 1453 cm−1 and 1396 cm−1 were observed.20 The peaks due to C–O–C stretching vibrations appeared at 1060 cm−1.13,20,34 The FT-IR spectrum of bio-cellulose/TiO2-III nanocomposite contained additional small peaks at 621 cm−1, 594 cm−1, 549 cm−1, and 412 cm−1, which are in agreement with previous observations.35 The presence of these characteristic Ti–O peaks of titania confirms the successful synthesis of bio-cellulose/TiO2-III nanocomposite by a cell-free system through an in situ strategy. The peaks at 1000–1300 cm−1 for bio-cellulose/TiO2-III nanocomposite due to C–OH stretching (1060 cm−1) and C–O–C bending vibrations (1163 cm−1), are weakened in comparison to the peaks in bio-cellulose because the TiO2 nanoparticles grow on the surface of bio-cellulose. These results are in agreement with previous observation.36

Fig. 3B shows the comparative XRD patterns of the extended linear scanning (10–70°) of bio-cellulose and bio-cellulose/TiO2-III nanocomposite. The XRD spectrum of bio-cellulose showed two broad peaks at 2θ 11.78° and 20.32° arising from the (11[0 with combining macron]) and (110) crystallinic planes, respectively, which represents the cellulose II structure.20 The XRD pattern of bio-cellulose/TiO2-III nanocomposite showed the diffraction pattern of both bio-cellulose and TiO2 nanoparticles that exhibit all characteristic peaks at 2θ 11.78°, 20.32°, 25.23°, 36.95°, 37.71°, 38.56°, 48.06°, 53.80°, 55.07°, 62.75°, 68.71°, and 70.32° arising from the (101), (103), (004), (112), (200), (105), (211), (118), (116), and (220) planes of anatase TiO2 nanoparticles.2,28 The slight decrease in the peak intensity of bio-cellulose in the bio-cellulose/TiO2-III spectra could be due to the TiO2 content.2

The degree of crystallinity of bio-cellulose and bio-cellulose/TiO2-III nanocomposite was calculated from the relative integrated area of the crystalline and amorphous peaks (eqn (2)). The ratio of crystalline to amorphous regions varies between samples and is dependent on the cellulose type, microbial strain, medium constituents, and processing conditions.37 The relative crystallinity of bio-cellulose was 31.98%. This lower crystallinity of bio-cellulose was clearly demonstrated by the absence of sharp crystallinic peaks in its XRD spectrum (Fig. 3B), and can be attributed to the incomplete growth of crystallite during its synthesis by a cell-free system.20,38 The impregnation of TiO2 nanoparticles did not significantly affect the crystallinity of bio-cellulose, which was slightly reduced to 31.08%.2 The crystallite size of bio-cellulose was calculated through the Scherrer equation and is summarized in Table 2.

Table 2 Illustration of comparative d-spacing, crystallinic planes, FWHM values, crystallite size, and crystallinity index of bio-cellulose
Sample d-Spacing (Å) Crystallinic planes FWHM Crystallite sizes (Å) Crystallinity index (%)
Bio-cellulose 6.1001 (1−10) 1.611 47 31.98
3.8932 (110) 1.428 555


Thermal and mechanical properties of the bio-cellulose/TiO2 nanocomposite

Besides various physico-mechanical and biological properties, the commercial applications of cellulose are highly dependent on its thermal stability, especially at elevated temperatures.20,39 Further, highly thermostable inorganic materials, such as nanoparticles, significantly increase the thermal degradation temperature of polymers.1 Therefore, the thermal behavior of the bio-cellulose/TiO2-III nanocomposite was investigated using TGA and was compared to that of bio-cellulose. The TGA thermograms of bio-cellulose and the bio-cellulose/TiO2 nanocomposite are shown in Fig. 4A. The thermal degradation of bio-cellulose takes place in three steps including dehydration, depolymerization, and decomposition of glucose units, which finally results in charred residue.40
image file: c5ra26704h-f4.tif
Fig. 4 (A) Thermal gravimetric analysis curves of bio-cellulose and the bio-cellulose/TiO2 nanocomposite produced under static conditions at 30 °C and pH 5.0. (B) The mechanical properties of bio-cellulose and the bio-cellulose/TiO2 nanocomposite produced under static conditions at 30 °C and pH 5.0.

In the present study, both bio-cellulose and the bio-cellulose/TiO2-III nanocomposite displayed two major weight loss zones (Fig. 4A). In the first step, about 2–3% weight loss occurred at a temperature range of 90–100 °C in bio-cellulose. This weight loss in bio-cellulose could be attributed to the loss of moisture content adsorbed on the surfaces and interlayer coordinated water molecules.41,42 The weight loss in the first step was lower for the bio-cellulose/TiO2 nanocomposite, indicating that the sample had a lower water content.1 Negligible weight loss was observed as the temperature was increased to 290 °C and 310 °C for bio-cellulose and the bio-cellulose/TiO2 nanocomposite, respectively. The second phase revealed a sharp weight loss due to the degradation of the main cellulose skeleton in both samples.15,20,41 The onset temperatures of bio-cellulose and the bio-cellulose/TiO2 nanocomposite were 298 °C and 333 °C, respectively. The improved thermal stability of nanocomposite could be attributed to the impregnated TiO2 nanoparticles. During this phase, the weight loss in bio-cellulose was 84%. In contrast, a lower weight loss was recorded in the bio-cellulose/TiO2 nanocomposite (68%). Similarly, the endset temperatures of bio-cellulose and bio-cellulose/TiO2 nanocomposite were 346 °C and 411 °C, respectively. The overall results indicate that the thermal stability of bio-cellulose/TiO2 nanocomposite was higher than bio-cellulose. Fig. 4A also indicates that there was no further decomposition of TiO2 nanoparticles after bio-cellulose degradation. Inorganic materials are thermally stable and most degrade above 600 °C.1 The nanoparticles impregnated into polymers, such as cellulose, offer a barrier for the main skeleton by absorbing heat, which ultimately results in shifting the degradation process towards higher temperature and reduced weight loss.

Fig. 4B shows the mechanical properties of bio-cellulose and bio-cellulose/TiO2-III nanocomposite. The maximum tensile strength value at the breaking point for bio-cellulose was recorded to be 17.54 MPa. This high value could be attributed to the thick, compact, and well-arranged fibrils of bio-cellulose.20 Such compact and uniform arrangement of fibrils in bio-cellulose could give a uniform response to applied force, and thus, result in improved tensile strength.15,37 The tensile strength for bio-cellulose/TiO2-III nanocomposite was increased to 20.98 MPa. Similar increases in tensile properties of polymer–nanoclay and polymer–nanoparticles have previously been reported.1,43,44 The Young's modulus for the bio-cellulose/TiO2-III nanocomposite was significantly increased to 0.97 GPa comparing to 0.38 GPa of bio-cellulose. These results demonstrate that the impregnation of TiO2 nanoparticles exerts a positive effect on the mechanical properties of bio-cellulose. It has been reported that the binding potential of nanoparticles to the polymer surface is readily affected by the physical phenomenon caused by rough surfaces and chemical interactions by hydrogen bonding and van der Waals forces.1,45 The binding of TiO2 and ZnO nanoparticles with microbial cellulose with OH moieties have already been reported.1,2 The TiO2 nanoparticles attached to bio-cellulose improves its overall toughness and restricts its mobility, ultimately resulting in the improved mechanical strength of the nanocomposite.1,46 The average strain of bio-cellulose and the bio-cellulose/TiO2-III nanocomposite was recorded to be 3.29 and 2.74%, respectively. The low strain of bio-cellulose could be attributed to the closely packed fibrils that cause the chains to be almost immobile and results in a very low level of elasticity.20 The strain of the nanocomposite was significantly decreased upon the incorporation of TiO2 nanoparticles into bio-cellulose. Several studies have reported a decrease in elasticity of composite material that can be attributed to the incorporation of nanoparticles into the main cellulose skeleton.1,15,46 The binding interaction between the TiO2 nanoparticles causes rigidity and restricts the mobility of bio-cellulose microfibrils, thus, resulting in decreased strain.

Antibacterial properties of the bio-cellulose/TiO2 nanocomposite

Lack of antibacterial properties in microbial and bio-cellulose is one of the main motives behind the synthesis of composites with bactericidal materials. To date, several nanocomposites of microbial cellulose have been reported to have excellent antibacterial and antifungal activities.1,2,47 Khan et al. have demonstrated a detailed mechanism of action of nanoparticles and nanocomposite against E. coli.2 In general, nanocomposites show their bactericidal activity through oxidative stress, generation of reactive oxygen species such as H2O2, O2, O*2 and OH˙, membrane stress, or the release of ions.2 Oxidative stress is a key antibacterial mechanism of nanomaterials caused by several factors including the generation of reactive oxygen species which induces mitochondrial membrane permeability and damages the cellular respiratory chain. ROS can also lead to the generation of free radicals either through interaction with cellular components or via activation of NADPH-oxidase enzyme.48 Membrane stress caused by the direct contact with nanomaterials is another possible effect on bacterial cell viability.49 This direct contact of nanomaterials with bacterial cell damages the peptidoglycans which results in altered morphology of bacterial cell. TiO2 nanoparticles and bio-cellulose/TiO2 nanocomposite produces highly reactive species which decompose the cell's outer membrane consisting of lipopolysaccharide (LPS) and peptidoglycan as reported previously.2 The phospholipid layer is also damaged by the free radicals such as O2 and OH˙.2

The antibacterial activity against E. coli of bio-cellulose and the bio-cellulose/TiO2 nanocomposites developed by a cell-free system was investigated using the agar disc diffusion and optical density methods. The results of are shown in Fig. 5A and B. During the disc diffusion method, the impregnated nanoparticles immediately begin to diffuse outwards from the nanocomposite disc. The released nanoparticles create a gradient in the agar such that the highest concentration is found in the vicinity of the disc while decreasing the concentrations further away from the disc. For bio-cellulose, the disc did not produce any inhibition zone (Fig. 5A), indicating that it does not possess any bactericidal activity, which is in agreement with previous studies.1,14,50 On the other hand, clear inhibition zones or ‘areas of no growth’ were produced by the bio-cellulose/TiO2-I, bio-cellulose/TiO2-II, bio-cellulose/TiO2-III nanocomposites discs after an overnight incubation. Precisely, a maximum of 3.7 cm, 2.5 cm, and 2.1 cm zones of inhibition were produced by the bio-cellulose/TiO2-I, bio-cellulose/TiO2-II, bio-cellulose/TiO2-III nanocomposites, respectively. The results obtained with disc diffusion method were in agreement with those of the optical density method that showed similar trends of antibacterial activity. The curves for optical density values versus culture time for bio-cellulose and bio-cellulose/TiO2 nanocomposites are shown in Fig. 5B. The results indicate that bio-cellulose did not show any antibacterial activity and, in fact, the E. coli growth was higher than the control, which is in agreement with previous reports.2,51 In contrast, the nanocomposites showed considerable antibacterial activity against E. coli, which was higher for bio-cellulose/TiO2-III compared to the bio-cellulose/TiO2-II and bio-cellulose/TiO2-I nanocomposites. This indicates that the bactericidal effect of the bio-cellulose/TiO2 nanocomposite is dependent on TiO2 concentration and release rate.52,53 These observations are in agreement with the SEM micrographs of the nanocomposites (Fig. 2). This can be further explained by the fact that with increasing time the bio-cellulose fibrils become more compact and hold the nanoparticles more firmly, which allows for the slow release of nanoparticles that show bactericidal activity over a prolonged time. Consequently, this will improve the potential of application of bio-cellulose/TiO2 nanocomposites in the biomedical field.


image file: c5ra26704h-f5.tif
Fig. 5 (A) Evaluation of antibacterial activities against E. coli of (I) bio-cellulose, (II) bio-cellulose/TiO2-I, (III) bio-cellulose/TiO2-II, and (IV) bio-cellulose/TiO2-III nanocomposites as determined by the disc diffusion method, (B) illustration of antibacterial activities against E. coli of bio-cellulose, bio-cellulose/TiO2-I, bio-cellulose/TiO2-II, and bio-cellulose/TiO2-III nanocomposites as determined by the optical density method. Data are the mean ± SD of three independent experiments. Significance was indicated by *p ≤ 0.05 relative to the control.

The release behavior of ions or nanoparticles indicates the strength of their interaction with the polymer matrix and their toxicological level.1,2 Further, the constant and controlled release of nanoparticles is necessary for biomedical and other applications, which may otherwise cause hazardous effect if high concentrations are released or if a release occurs in an uncontrolled fashion. A nanocomposite of cellulose with TiO2 nanoparticles shows its antibacterial activity due to the release of Ti4+.2 Therefore, the Ti4+ release behavior from bio-cellulose/TiO2-III nanocomposite was determined.

In the current study, the amount of Ti4+ released from the bio-cellulose/TiO2-III nanocomposite in water was determined using the ICP method. The nanocomposite showed a very low level of ion release throughout the entire observation period. Precisely, the ions release level reached to only 0.1123% of the initially impregnated nanoparticles in the nanocomposite after 10 days of incubation in water under static conditions at room temperature (Table 3). Conversely, the nanocomposite retained 99.98% of nanoparticles impregnated after 10 days of incubation. This slow release of ions indicates the strong interaction of Ti4+ with bio-cellulose fibers at both the surface and inner matrix as shown by the highly compact fibril arrangement in the nanocomposite (Fig. 2).

Table 3 Illustration of Ti4+ release from bio-cellulose/TiO2 nanocomposite after different length of time incubated at room temperature under static conditions
Days Initial amount of NPs in nanocomposite (g) Amount of NPs released from nanocomposite Amount of NPs retained in nanocomposite
(g) % (g) %
0 0.0054 0 0.0000 0.005400 100
2 0.0054 9.53 × 10⁻⁷ 0.0177 0.005399 99.982335
4 0.0054 3.15 × 10⁻⁶ 0.0585 0.005397 99.941548
6 0.0054 4.55 × 10⁻⁶ 0.0843 0.005395 99.915652
8 0.0054 5.84 × 10⁻⁶ 0.1083 0.005394 99.891698
10 0.0054 6.063 × 10⁻⁶ 0.1123 0.005394 99.887721


Comparative analysis of the nanocomposites synthesized through a cell-free system, microbial cell system, and regeneration method

To date, nanocomposites of microbial cellulose with TiO2 nanoparticles have been synthesized by various methods such as ex situ36,54–56 and regeneration methods.2 However, these nanocomposites have several limitations including limited impregnation of nanoparticles into the cellulose matrix, nanoparticle release, and variable distribution of nanoparticles.36,54–56 Further, these nanocomposites have limited thermal and mechanical stability and low antibacterial activity.36,54 In the current study, we have developed a bio-cellulose/TiO2 nanocomposite through an in situ strategy using a cell-free system, which avoids the cytotoxic effect of TiO2 nanoparticles on cells.2

Bio-cellulose synthesized by a cell-free system possesses a more compact and well-distributed fibril arrangement20 that favored the effective uptake of TiO2 nanoparticles (Table 1). Further, the TiO2 nanoparticles were impregnated into the bio-cellulose matrix (Fig. 2) and remained firmly attached to the fibers as shown by the slow release of Ti4+ from the synthesized bio-cellulose/TiO2-III nanocomposite (Table 3). On the other hand, the TiO2 nanoparticles are mostly attached to the bacterial cellulose (BC) surface in the ex situ method and a major portion are released during the washing (e.g. with sodium carbonate solution) of the BC/TiO2 nanocomposite.52 Further, the in situ synthesis of nanocomposite by the cell-free system favored the uniform distribution of TiO2 nanoparticles due to the continuous synthesis of cellulose fibers and their interaction with TiO2 nanoparticles as shown by the FE-SEM micrographs (Fig. 2). In contrast, the formation of agglomerates on the surface of a composite is a common phenomenon during the ex situ synthesis of BC composites with TiO2 or other nanomaterials.52 The bio-cellulose/TiO2 nanocomposite synthesized by the cell-free system showed better thermal properties as shown by the thermogravimetric analysis (Fig. 4A). The degradation temperature of bio-cellulose/TiO2 nanocomposite synthesized by the cell-free system was found to be 414 °C compared to 280–300 °C for BC/TiO2 nanocomposites as reported in previous studies.36,54 On the other hand, regeneration method of composite synthesis alters the reticulate structure of microbial cellulose and ultimately its physico-mechanical properties.1,2 Furthermore, the bio-cellulose/TiO2 nanocomposite synthesized by the cell-free system displayed better antibacterial activity compared to RBC/TiO2 nanocomposite created by the regeneration method.2 This could be due to the fact that uniformly distributed TiO2 nanoparticles in the bio-cellulose/TiO2 nanocomposite synthesized by the cell-free system are slowly and uniformly released and showed bactericidal activity against E. coli for a prolonged time (Fig. 5B).

From the above discussion, it can be concluded that a cell-free system can offer several advantages compared to microbial cell system in composite syntheses, such as in situ synthesis of composites with a wide range of bactericidal elements, better uptake and uniform distribution of nanoparticles, and cost effectiveness due to a better yield of bio-cellulose. Similarly, the thicker, compact, and well-distributed fibers in bio-cellulose could favor the synthesis of a composite with better physico-mechanical, antibacterial, and biological properties.

Conclusions

A bio-cellulose/TiO2 nanocomposite was successfully developed through an in situ approach using a cell-free system. The cell-free system developed from a single cell line through a low-cost and simple approach bypassed the limitation of the nanoparticles' bactericidal effect on the microbial cells that are used for in situ synthesis of nanocomposites. The nanocomposite that was synthesized by the cell-free system showed improved thermal, mechanical, and antibacterial properties compared to bio-cellulose. This could be an important aspect when choosing a synthesis method (in situ synthesis by the cell-free system). The current synthesis approach will provide a foundation for the future development of a broad range of composite materials of biopolymers with bactericidal elements for various biomedical and other useful applications.

Acknowledgements

This research was supported by the Basic Science Research Program through the National Research Foundation (NRF) of Korea, funded by the Ministry of Education, Science and Technology (NRF-2014-R1A1A2055756). Additionally, it was supported by the BK21 plus (2014–2019) Korea, (21A.2013-1800001).

References

  1. M. Ul-Islam, W. A. Khattak, M. W. Ullah, S. Khan and J. K. Park, Cellulose, 2014, 21, 433–447 CrossRef CAS.
  2. S. Khan, M. Ul-Islam, W. A. Khattak, M. W. Ullah and J. K. Park, Cellulose, 2015, 22, 565–579 CrossRef CAS.
  3. T. Hanemann and D. V. Szabo, Materials, 2010, 3, 3468–3517 CrossRef CAS.
  4. A. Aravamudhan, D. M. Ramos, J. Nip, M. D. Harmon, R. James, M. Deng, C. T. Laurencin, X. Yu and S. G. Kumbar, J. Biomed. Nanotechnol., 2013, 9, 719–731 CrossRef CAS PubMed.
  5. M. Fiayyaz, K. M. Zia, M. Zuber, T. Jamil, M. K. Khosa and M. A. Jama, Korean J. Chem. Eng., 2014, 31, 644–649 CrossRef CAS.
  6. H. Zhang, Y. Shan and L. Dong, J. Biomed. Nanotechnol., 2014, 10, 1450–1457 CrossRef CAS PubMed.
  7. C. Seo, H. W. Lee, A. Suresh, J. W. Yang, J. K. Jung and Y. C. Kim, Korean J. Chem. Eng., 2014, 31, 1433–1437 CrossRef CAS.
  8. M. Shoda and Y. Sugano, Biotechnol. Bioprocess Eng., 2005, 10, 1–8 CrossRef CAS.
  9. W. Czaja, A. Krystynowicz, S. Bielecki and R. M. Brown, Biomaterials, 2006, 27, 145–151 CrossRef CAS PubMed.
  10. K. Mahmoudi, K. Hosni, N. Hamdi and E. Srasra, Korean J. Chem. Eng., 2015, 32, 274–283 CrossRef CAS.
  11. C. Wu and Y. K. Lia, J. Mol. Catal. B: Enzym., 2008, 54, 103–108 CrossRef.
  12. H. X. Li, S. J. Kim, Y. W. Lee, C. D. Kee and I. K. Oh, Korean J. Chem. Eng., 2011, 28, 2306–2311 CrossRef CAS.
  13. M. Ul-Islam, N. Shah, J. H. Ha and J. K. Park, Korean J. Chem. Eng., 2011, 28, 1736–1743 CrossRef CAS.
  14. M. Ul-Islam, J. H. Ha, T. Khan and J. K. Park, Carbohydr. Polym., 2013, 92, 360–366 CrossRef CAS PubMed.
  15. M. Ul-Islam, T. Khan and J. K. Park, Carbohydr. Polym., 2012, 88, 596–603 CrossRef CAS.
  16. Y. Dahman, J. Nanosci. Nanotechnol., 2009, 9, 5105–5122 CrossRef CAS PubMed.
  17. A. Meftahi, R. Khajavi, A. Rashidi, M. Sattari, M. E. Yazdanshenas and M. Torabi, Cellulose, 2010, 17, 199–204 CrossRef CAS.
  18. M. Ul-Islam, W. A. Khattak, M. Kang, S. M. Kim, T. Khan and J. K. Park, Cellulose, 2013, 20, 253–263 CrossRef CAS.
  19. M. W. Ullah, M. Ul-Islam, S. Khan, Y. Kim and J. K. Park, Carbohydr. Polym., 2015, 132, 286–294 CrossRef CAS PubMed.
  20. M. W. Ullah, M. Ul-Islam, S. Khan, Y. Kim and J. K. Park, Carbohydr. Polym., 2016, 136, 908–916 CrossRef CAS PubMed.
  21. M. Niederberger, M. H. Bartl and G. D. Stucky, Chem. Mater., 2002, 14, 4364–4370 CrossRef CAS.
  22. M. W. Ullah, W. A. Khattak, M. Ul-Islam, S. Khan and J. K. Park, Biochem. Eng. J., 2014, 91, 110–119 CrossRef CAS.
  23. M. W. Ullah, W. A. Khattak, M. Ul-Islam, S. Khan and J. K. Park, Biotechnol. Bioprocess Eng., 2015, 20, 561–575 CrossRef CAS.
  24. Y. Jeon, J. Y. Yi and D. H. Park, Korean J. Chem. Eng., 2014, 31, 475–484 CrossRef.
  25. W. A. Khattak, M. Ul-Islam, M. W. Ullah, B. Yu, S. Khan and J. K. Park, Process Biochem., 2014, 49, 357–364 CrossRef CAS.
  26. D. Paramelle, A. Sadovoy, S. Gorelik, P. Free, J. Hobleya and D. G. Fernig, Analyst, 2014, 139, 4855–4861 RSC.
  27. B. Focher, M. T. Palma, M. Canetti, G. Torri, C. Cosentino and G. Gastaldi, Ind. Crops Prod., 2001, 13, 193–208 CrossRef CAS.
  28. L. Zhao, H. Wang, K. Huo, L. Cui, W. Zhang, H. Ni, Y. Zhang, Z. Wu and P. K. Chu, Biomaterials, 2011, 32, 5706–5716 CrossRef CAS PubMed.
  29. R. Chadha, R. Sharma, N. Maiti, A. Ballal and S. Kapoor, Spectrochim. Acta, Part A, 2015, 150, 664–670 CrossRef CAS PubMed.
  30. E. Bae, H. J. Park, J. Park, J. Yoon, Y. Kim, K. Choi and J. Yi, Bull. Korean Chem. Soc., 2011, 32, 613–619 CrossRef CAS.
  31. R. Mormino and H. Bungay, Appl. Microbiol. Biotechnol., 2003, 62, 503–506 CrossRef CAS PubMed.
  32. S. Kaewnopparat, K. Sansernluk and D. Faroongsarng, AAPS PharmSciTech, 2008, 9, 701–707 CrossRef CAS PubMed.
  33. W. Tang, S. Jia, Y. Jia and H. Yang, World J. Microbiol. Biotechnol., 2010, 26, 125–131 CrossRef CAS.
  34. N. Shah, J. H. Ha and J. K. Park, Biotechnol. Bioprocess Eng., 2010, 15, 110–118 CrossRef CAS.
  35. M. Hema, A. Y. Arasi, P. Tamilselvi and R. Anbarasan, Chem. Sci. Trans., 2013, 2, 239–245 CrossRef.
  36. D. Sun, J. Yang and X. Wang, Nanoscale, 2010, 2, 287–292 RSC.
  37. O. Shezad, S. Khan, T. Khan and J. K. Park, Carbohydr. Polym., 2010, 82, 173–180 CrossRef CAS.
  38. M. W. Ullah, W. A. Khattak, M. Ul-Islam, S. Khan and J. K. Park, Biochem. Eng. J., 2016, 105, 391–405 CrossRef CAS.
  39. Y. S. Lin and A. J. Burggraaf, J. Am. Ceram. Soc., 1991, 74, 219–224 CrossRef CAS.
  40. J. George, K. V. Ramana, A. S. Bawa and S. Siddaramaiah, Int. J. Biol. Macromol., 2011, 48, 50–57 CrossRef CAS PubMed.
  41. M. Darder, M. Colilla and E. Ruiz-Hitzky, Chem. Mater., 2003, 15, 3774–3780 CrossRef CAS.
  42. T. Khan and J. K. Park, Carbohydr. Polym., 2008, 73, 438–445 CrossRef CAS.
  43. H. Liu, D. Chaudhary, S. Yusa and M. O. Tade, Carbohydr. Polym., 2010, 83, 1591–1597 CrossRef.
  44. S. T. Olalekan, S. A. Muyibi, Q. H. Shah, M. F. Alkhatib, F. Yusof and I. Y. Qudsie, Int. J. Energy Res., 2010, 1, 68–72 CrossRef.
  45. D. Batch, J. L. Andres, J. E. Winter, H. B. Schlegel, J. M. Ball and J. W. Holobka, J. Adhes. Sci. Technol., 1994, 8, 249–259 CrossRef.
  46. R. Velmurugan and T. P. Mohan, J. Reinf. Plast. Compos., 2009, 28, 17–37 CrossRef CAS.
  47. H. Chen, S. B. Lin, C. P. Hsu and L. C. Chen, Cellulose, 2013, 20, 1967–1977 CrossRef CAS.
  48. T. Xia, M. Kovochich, M. Liong, L. Madler, B. Gilbert, H. Shi, J. I. Yeh, J. I. Zink and A. E. Nel, ACS Nano, 2008, 2, 2121–2134 CrossRef CAS PubMed.
  49. X. Jiang, L. Yang, P. Liu, X. Li and J. Shen, Colloids Surf., B, 2010, 79, 69–74 CrossRef CAS PubMed.
  50. W. L. Hu, S. Chen, X. Li, S. Shi, W. Shen, X. Zhang and H. Wang, Mater. Sci. Eng., C, 2009, 29, 1216–1219 CrossRef CAS.
  51. T. Maneerung, S. Tokura and R. Rujiravanit, Carbohydr. Polym., 2008, 72, 43–51 CrossRef CAS.
  52. Z. Emami-Karvani and P. Chehrazi, Afr. J. Microbiol. Res., 2011, 5, 1368–1373 CAS.
  53. G. Applerot, A. Lipovsky, R. Dror, N. Perkas, Y. Nitzan, R. Lubart and A. Gedanken, Adv. Funct. Mater., 2009, 19, 842–852 CrossRef CAS.
  54. J. Gutierrez, A. Tercjak, I. Algar, A. Retegi and I. Mondragon, J. Colloid Interface Sci., 2012, 377, 88–93 CrossRef CAS PubMed.
  55. A. Daoud, J. H. Xin and Y. H. Zhang, Surf. Sci., 2005, 599, 69–75 CrossRef.
  56. X. Zhang, W. Chen, Z. Lin, J. Yao and S. Tan, Synth. React. Inorg., Met.-Org., Nano-Met. Chem., 2011, 41, 997–1004 CrossRef CAS.

This journal is © The Royal Society of Chemistry 2016