
Anstifolines A and B, two dimeric furoquinoline alkaloids from the root bark of Dictamnus angustifolius†
Jianbo Sun‡
*a,
Neng Jiang‡b,
Mengying Lva,
Benqin Tangc,
Pei Wangd,
Jingyu Lianga and
Li Chen*a
aDepartment of Natural Medicinal Chemistry, China Pharmaceutical University, Nanjing 210009, China. E-mail: sjbcpu@gmail.com; chenliduo@sohu.com
bDepartment of Clinical Pharmacy, Affiliated Tumor Hospital of Guangxi Medical University, Nanning 530021, China
cDepartment of Medical Science, Shunde Polytechnic College, Shunde, Guangdong 528333, China
dCenter of Excellence in Post-Harvest Technologies, North Carolina Agricultural and Technical State University, Kannapolis 28081, North Carolina, USA
First published on 22nd February 2016
Abstract
Anstifolines A and B, two dimeric furoquinoline alkaloids with unique coupling patterns were isolated from the root bark of Dictamnus angustifolius. The biosynthetic pathway of anstifoline A was proposed. All of the isolates exhibited cytotoxicities and inhibition of superoxide anion generation and elastase release.
Introduction
Furoquinoline alkaloids, typical constituents of the Rutaceae plant species, are the most widely distributed of the quinoline alkaloids.1 A number of such derivatives have been examined and were found to be responsible for various physiological, pharmacological and biological effects.2 Antimicrobial, antitumor, and antiemetic activities have been attributed to both the natural and synthetic analogues of these molecules.3 They were derived from anthranilic acid and structurally similar to linear furanocoumarins.4 Both of furoquinolines and furanocoumarins are tricyclic planar aromatic compounds with a polysubstituted furan ring, which has been found as a key structural unit in many bioactive natural products and pharmaceuticals.5Dictamnus angustifolius G. Don ex Sweet (Rutaceae), known to be a rich source of furoquinoline alkaloids, has been used for the treatment of chronic hepatitis, rheumatism and as an anti-inflammatory agent, febrifugal and detoxicant drug in Traditional Chinese Medicine.6 In our search for more furoquinoline alkaloids with structural diversity and multitarget effects, two new highly aromatized furoquinolines, anstifolines A (1) and B (2), possessing unique cross-coupling patterns, were isolated from the root bark of D. angustifolius. The respective possible biogenetic precursors of 1, dictamnine (3) and robustine (4) were also obtained from the present study (Fig. 1).
 | ||
| Fig. 1 Structures of compounds 1–4. | ||
Experimental
General experimental procedures
Optical rotations were measured with a JASCO P-1020 polarimeter. ECD spectra were obtained on a JASCO 810 spectropolarimeter. IR spectra (KBr disks) were recorded on a Bruker Tensor 27 spectrometer. NMR spectra were recorded on a Bruker ACF-500 NMR instrument, with TMS as internal standard. Mass spectra were obtained on an MS Agilent 1100 Series LC/MSD ion-trap mass spectrometer (ESIMS) and a Mariner ESITOF spectrometer (HR-ESIMS). All solvents used were of anal. grade (Tianjin Chemical Co., Ltd, Tianjin, China). Silica gel (Qingdao Marine Chemical Co., Ltd, Qingdao, China), Sephadex LH-20 (40–75 μm, Pharmacia Biotech AB, Uppsala, Sweden) and RP-C18 (40–63 μm, FuJi) were used for column chromatography.Plant material
The air-dried root bark of D. angustifolius were collected from Xinjiang Altay Region in P. R. China in October, 2010, and identified by Prof. Sheban Pu, China Pharmaceutical University (Nanjing, China). A voucher specimen has been deposited in the Department of Natural Medicinal Chemistry, China Pharmaceutical University (accession number. 20100507).Extraction and isolation
The air-dried root bark of D. angustifolius (18 kg) were soaked in 95% EtOH (120 L × 3) at room temperature and extracted under refluxed three times. The combined extracts were filtered and the solvent was evaporated in vacuo to obtain a brown crude extract (850 g). The extract was further dissolved in water and partitioned with petroleum ether, CH2Cl2 and n-BuOH, respectively. The CH2Cl2 fraction (150 g) was subjected to column chromatography over silica gel and eluted with a gradient of CH2Cl2/CH3OH (80![[thin space (1/6-em)]](https://www.rsc.org/images/entities/char_2009.gif) :0–1:1) to give 7 fractions (I–VII). Fraction I (35 g) was rechromatographed on a silica gel column eluted with CH2Cl2/CH3OH (60:0–1:1) to produce 5 subfractions (Ia–Ie). Fraction Ib (12.8 g) obtained was subjected to Sephadex LH-20 to afford compound 1 (12 mg). Fraction Ie (7.9 g) was chromatographed on a C18 MPLC column using aqueous methanol (1:10–1:0) as eluent to give six subfractions Ie1–Ie6. Subfraction Ie3 (1.4 g) was further purified by preparative TLC chromatography with CH2Cl2/CH3OH (20:1) to afford compound 2 (23 mg) and compound 3 (17 mg). Fraction Ie6 (0.9 g) was placed on a Sephadex LH-20 column and then purified by preparative TLC chromatography with CH2Cl2/CH3OH (20:1) to afford 4 (48 mg).
ε): 329 (3.69) nm; IR (KBr) νmax: 3442, 1671, 1507, 1368, 1091, 722 cm−1; for 1H and 13C NMR spectroscopic data, see Table 1; HRESIMS m/z 459.1195 [M + H]+.
:0–1:1) to give 7 fractions (I–VII). Fraction I (35 g) was rechromatographed on a silica gel column eluted with CH2Cl2/CH3OH (60:0–1:1) to produce 5 subfractions (Ia–Ie). Fraction Ib (12.8 g) obtained was subjected to Sephadex LH-20 to afford compound 1 (12 mg). Fraction Ie (7.9 g) was chromatographed on a C18 MPLC column using aqueous methanol (1:10–1:0) as eluent to give six subfractions Ie1–Ie6. Subfraction Ie3 (1.4 g) was further purified by preparative TLC chromatography with CH2Cl2/CH3OH (20:1) to afford compound 2 (23 mg) and compound 3 (17 mg). Fraction Ie6 (0.9 g) was placed on a Sephadex LH-20 column and then purified by preparative TLC chromatography with CH2Cl2/CH3OH (20:1) to afford 4 (48 mg).
ε): 329 (3.69) nm; IR (KBr) νmax: 3442, 1671, 1507, 1368, 1091, 722 cm−1; for 1H and 13C NMR spectroscopic data, see Table 1; HRESIMS m/z 459.1195 [M + H]+.
| Compound 1 | |||
|---|---|---|---|
| No. | δH | δC | HMBC (H → C) |
| 2 | 162.3, s | ||
| 3 | 103.5, s | ||
| 4 | 156.7, s | ||
| 5 | 8.06, d (10.3) | 136.5, s | 7 |
| 6 | 6.36, d (10.3) | 124.5, d | 8, 10 |
| 7 | 198.7, s | ||
| 8 | 79.9, s | ||
| 9 | 156.0, s | ||
| 10 | 113.5, s | ||
| 11 | 7.45, d (2.8) | 105.4, s | 2, 3, 12 |
| 12 | 7.97, d (2.8) | 144.3, d | 2, 11 |
| 2′ | 163.9, s | ||
| 3′ | 105.6, s | ||
| 4′ | 156.9, s | ||
| 5′ | 7.72, d (9.0) | 110.6, d | 4′, 9′ |
| 6′ | 7.95, d (9.0) | 123.3, d | 8, 7′, 10′ |
| 7′ | 127.2, s | ||
| 8′ | 135.2, s | ||
| 9′ | 146.8, s | ||
| 10′ | 117.8, s | ||
| 11′ | 7.39, d (2.6) | 106.2, d | 2′, 12′ |
| 12′ | 7.94, d (2.6) | 144.2, d | 3′, 11′ |
| 4-OCH3 | 4.45, s | 59.4, q | 4 |
| 8-OCH3 | 3.03, s | 51.5, q | 8 |
| 4′-OCH3 | 4.38, s | 59.5, q | 4′ |
| 8′-OH | 9.36, s | 7′, 9′ | |
ε): 335 (2.75) nm; IR (KBr) νmax: 3433, 1629, 1596, 1204, 1126, 754 cm−1; for 1H and 13C NMR spectroscopic data, see Table 2; HRESIMS m/z 471.2063 [M − H]−.
| Compound 2 | |||
|---|---|---|---|
| No. | δH | δC | HMBC (H → C) |
| 2 | 156.0, s | ||
| 3 | 107.5, s | ||
| 4 | 172.7, s | ||
| 5 | 8.57, d (8.0) | 127.5, d | 4, 6, 7 |
| 6 | 7.42, d (8.0) | 115.5, d | 7, 8, 9 |
| 7 | 173.4, s | ||
| 8 | 98.5, s | ||
| 9 | 155.6, s | ||
| 10 | 125.3, s | ||
| 11 | 6.78, d (2.8) | 104.9, d | 2, 3, 12 |
| 12 | 7.60, d (2.8) | 138.3, d | 2, 4, 11 |
| 2′ | 157.0, s | ||
| 3′ | 107.1, s | ||
| 4′ | 172.3, s | ||
| 5′ | 7.49, d (8.5) | 114.0, d | 4′, 6′, 10′ |
| 6′ | 7.70, d (8.5) | 132.0, d | 8, 5′, 7′ |
| 7′ | 128.4, s | ||
| 8′ | 122.6, s | ||
| 9′ | 151.5, s | ||
| 10′ | 122.3, s | ||
| 11′ | 7.05, d (2.3) | 107.8, d | 2′, 3′, 12′ |
| 12′ | 7.30, d (2.3) | 137.8, d | 2′, 3′ |
| 1-NCH3 | 3.93, s | 31.3, q | |
| 8-OCH3 | 3.93, s | 55.7, q | 8 |
| 1′-NCH3 | 3.93, s | 31.4, q | |
| 8′-OCH3 | 4.16, s | 36.8, q | 8′ |
Determination of cytotoxic activities
A-549 and NCI-H460 human lung cancer cell lines were cultured in DMEM medium (Hyclone, UT, USA), supplemented with 10% fetal bovine serum (Hyclone) in 5% CO2 at 37 °C. The cytotoxicity assay was performed according to the MTT method7 in 96-well microplates. Voreloxin (Aladdin, Shanghai, China) was used as positive control.Determination of superoxide anion generation
Diphenyleneiodonium (DPI) was supplied by Energy Chemical. Co., Ltd (Shanghai, China), 2-(4-iodophenyl)-3-(4-nitrophenyl)-5-(2,4 disulfophenyl)-2H-tetrazolium monosodium salt (WST-1) was purchased from Dojindo Laboratories (Kumamoto, Japan). The superoxide anion generation of compounds 1–4 was determined using xanthine/xanthine oxidase in a cell-free system, based on a previously described method.8Measurement of elastase release
Degranulation of azurophilic granules was determined by elastase release as described previously9 with some modifications. Experiments were performed using MeO-Suc-Ala-Ala-Pro-Val-p-nitroanilide as the elastase substrate. Sivelestat was supplied by Guiechem. Co., Ltd (Hubei, China).Results and discussion
Compound 1 was isolated as yellow powder. Its molecular formula C25H18N2O7 was established from HRESIMS (m/z at 459.1195 [M + H]+, calcd for 459.1187), indicating 18 degrees of unsaturation. The IR spectrum showed the existence of a hydroxyl group (3442 cm−1) and a carbonyl group (1671 cm−1). The 1H and 13C NMR data (Table 1) revealed the presence of one hydroxyl group (δH 9.36) and showed three methoxyl groups [δH 3.03, 4.38 and 4.45 (each 3H); δC 51.5, 59.5 and 59.4], two ortho coupled furyl rings [δH 7.39, 7.94 (each 1H, d, J = 2.6 Hz) and δH 7.45, 7.97 (each 1H, d, J = 2.8 Hz); δC 106.2, 144.2 and 105.4, 144.3] and two ortho coupled aromatic rings [δH 7.72, 7.95 (each 1H, d, J = 9.0 Hz) and δH 6.36, 8.06 (each 1H, d, J = 10.3 Hz); δC 110.6, 123.3 and 124.5, 136.5]. In addition, the 13C NMR and DEPT data indicated 14 other carbons ascribed to one carbonyl group at δC 198.7, thirteen quaternary carbons between δC 79.9 and 163.9. Among all carbons, 1 carbonyl and 20 olefinic carbons account for 17 degrees of unsaturation, suggesting that 1 is a highly aromatized C25 nitrogen-containing structure with a hexacyclic ring system.According to the above NMR and MS data with previously reported furoquinoline alkaloids isolated from D. angustifolius, compound 1 was inferred to be a homodimer comprising two tricyclic ring moieties designated as subunits 1A and 1B. Interpretation of the HSQC data allowed all single-bond proton and carbon correlations of the two units to be assigned.
In the HMBC spectrum of 1A (Fig. 2), H-11 showed correlations to two quaternary sp2 carbons at δC 103.5 (C-3) and 162.3 (C-2), which suggested that the position of the furyl ring was conjugated with pyridine ring through C-2 and C-3. Correlations from 4-OMe (δH 4.45) to δC 156.7 (C-4) indicated that the methoxyl group was assigned to C-4. The position of the carbonyl group was determined by the conjugate relationship with C-5 (δC 136.5) and C-6 (δC 124.5) and multiple HMBC correlations from H-5 to C-4, C-7, and H-6 to C-8 and C-10. The remaining methoxyl group at C-8 was assigned on the basis of HMBC correlation from 8-OMe (δH 3.03) to C-8 (δC 79.9). Besides, due to sp3 hybridization of C-8, there was a substituent position still unappropriated. This led to the assignment of part 1A being linked to unit 1B through C-8.
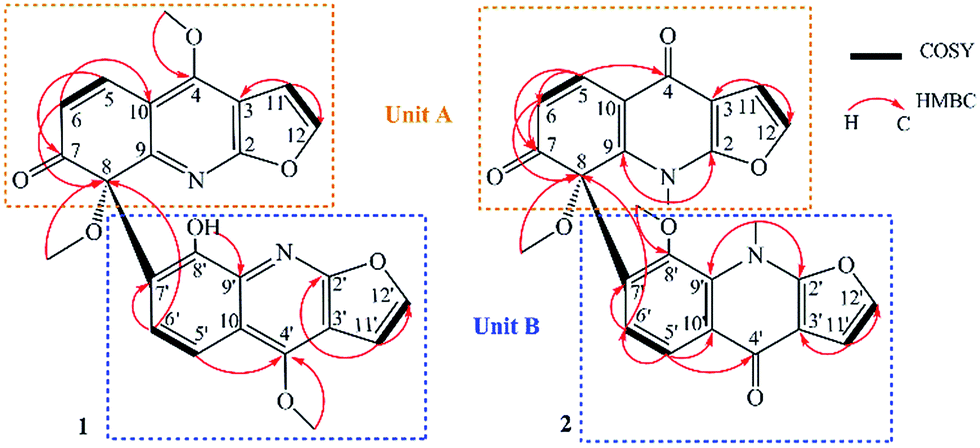 | ||
| Fig. 2 Key COSY and HMBC correlations of 1 and 2. | ||
The remaining 12 carbon resonances (C-2′ to C-12′ and 4′-OMe) belonged to subunit 1B. The HMBC correlations (Fig. 2) from 4′-OMe (δH 4.38) to δC 156.9 (C-4′) indicated that the methoxyl group was assigned to C-4′. Correlations of H-5′ (δH 7.72) with C-4′ (δC 156.9), H-6′ (δH 7.95) with C-8 (δC 79.9) and C-7′ (δC 127.2) suggested that unit 1B was directly connected with C-7′ through C-8. The hydroxyl group was attached to C-8′ (δC 135.2) by the HMBC correlations from 8-OH (δH 9.36, s) to C-7′ (δC 127.2) and C-9′ (δC 146.8). The ortho coupled relationships of H-5/H-6, H-11/H-12, H-5′/H-6′ and H-11′/H-12′ were supported by 1H–1H COSY (Fig. 2).
The absolute configuration of compound 1 was established by applying the CD exciton chirality method.10 The CD spectrum of 1 exhibited positive chirality resulting from the exciton coupling between the two different chromophores of the long conjugated α,β-unsaturated ketone at 269 nm (π–π* transition)11 and the benzo heterocyclic fragment at 242 nm (π–π* transition),12 respectively. The positive chirality indicated that the transition dipole moments of the two chromophores are in a clockwise-oriented manner (Fig. 3). Thus, the stereostructure of 1 was established as 8S. The above evidence led to the structural assignment of 1 as depicted in Fig. 1, and it was given a trivial name of anstifoline A.
 | ||
| Fig. 3 CD spectrum and the exciton chirality of 1; the bold lines denote the electric transition dipole of the chromophores for 1. | ||
The absolute configuration of compound 1 was also deduced by comparison of the experimental and calculated ECD spectra. The stable conformers obtained were submitted to ECD calculation by the TDDFT [B3LYP/6-31+G(2d,3p)] method.13 The overall predicted ECD spectrum of 1 was subsequently compared with the experimental one, which revealed a good agreement between the calculated and the measured ECD curves (Fig. 4). Thus, the absolute configuration of 1 was assigned as depicted.
 | ||
| Fig. 4 Experimental ECD spectra of 1 and 2; calculated CD spectra of 1; for better comparibility the intensity of the curve of 2 is fitted to the one of 1. | ||
Compound 2 was isolated as yellow oil. The molecular formula was deduced to be C26H20N2O7 on the basis of negative HRESIMS at m/z 471.2063 [M − H]−, corresponding to an index of hydrogen deficiency of 18. Analysis of the NMR spectra (Table 2), suggested that 2 was also made up of two parts (subunits 2A and 2B). However, different from 1, subunits 2A and 2B were isoforms of subunits 1A and 1B. Due to the presence of 4/4′-carbonyl groups, the chemical shifts of C-4 and C-4′ (δC 172.7 and 172.3) were downfiled and the two methyl groups 4/4′-OMe were moved to 1/1′-N with their chemical shifts changed to (δC 31.3 and 31.4) consequently. Based on the HMBC spectral data (Fig. 2), correlations from H-6 to C-7, C-8 and H-6′ to C-8, C-7′ along with correlations from H-5′ to C-6′ and C-10′, revealing the connection between 2A and 2B via C-8 and C-7.
The absolute configuration of compound 2 was deduced by comparison of the experimental CD and optical rotation data with compound 1. Since these two compounds both have only one chiral center in C-8, therefore, a good agreement between the two experimental CD curves and the similarity of optical rotation data revealed that the stereostructure of 2 was unambiguously established as 8S (Fig. 4). All available data led to the structural assignment of 2 as depicted in Fig. 1, and it was given a trivial name of anstifoline B.
To the best of our knowledge, anstifolines A and B represent the first furoquinoline dimers featuring an unprecedented 8–7′ coupling system from a natural source, which is of interest in the context of chemotaxonomy, plant biochemistry, and synthetic chemical research. Biogenetically, intermolecular oxidative phenol coupling is considered a major process in nature for the formation of atropisomeric biaryl structures.14 The dimeric furoquinoline structures from the Dictamnus species are believed to be derived from the furoquinoline precursors (such as compounds 3 and 4) via nucleophilic substitution and tautomerism (see Scheme 1). Taking the biogenetical formation of compound 1 for example. In the presence of reactive oxygen, an unstable intermediate A with a three-membered ring generated by oxidation reaction in C-7 and C-8 of compound 3. Then, a nucleophilic addition occurs by an initial nucleophilic attacking from 4 at C-7 by the π-system to intermediate A at C-8, which initiates a concerted process leading to a dimeric furoquinoline carbanion intermediate B. After tautomerism of the aromatic ring from 4, the nucleophilic substitution in C-8 results in the formation of a chiral center. Due to the instability of the enol form in intermediate C, further tautomerism and selective oxidation established the unprecedented C–C coupling skeleton and finally produced 1.
 | ||
| Scheme 1 Plausible pathway for the biogenesis of 1. | ||
Compounds 1–4 were evaluated for their cytotoxicities against A-549 and NCI-H460 human lung cancer cell lines using the MTT method with voreloxin as the positive control. Compounds 1 and 2 exhibited more significant cytotoxicities against A549 and NCI-H460 than dictamnine (3) and robustine (4) with IC50 values of 13.29 μM, 14.31 μM, and 10.64 μM, 13.18 μM, respectively (Table 3).
| Cell lines | Compounds (IC50 μM) | ||||
|---|---|---|---|---|---|
| 1 | 2 | 3 | 4 | Voreloxin | |
| A549 | 13.29 | 10.64 | 21.31 | 18.42 | 0.39 |
| NCI-H460 | 14.31 | 13.18 | 25.40 | 22.34 | 0.45 |
It was also found that both immediate inflammation responses including superoxide anion generation and elastase release were significantly inhibited by treatment with compounds 1, 2, 3 and 4 [superoxide anion generation (IC50: 13.0, 17.4, 32.8, 26.1 μM); elastase release (IC50: 19.6, 12.1, 29.3, 32.2 μM, respectively)] (Table 4).
| Compounds | Superoxide anion | Elastase release |
|---|---|---|
| IC50b (μM) | IC50b (μM) | |
| a Results are presented as means ± SEM (n = 3 or 4) (***p < 0.001 compared with the control value).b Concentration necessary for 50% inhibition (IC50).c Diphenyleneiodonium (DPI) and sivelestat were used as positive controls for superoxide anion generation and elastase release, respectively. | ||
| 1 | 13.0 ± 0.2 | 19.6 ± 0.1 |
| 2 | 17.4 ± 0.1 | 12.1 ± 0.3 |
| 3 | 32.8 ± 0.4 | 29.3 ± 0.2 |
| 4 | 26.1 ± 0.3 | 32.2 ± 0.7 |
| DPIc | 0.9 ± 0.4 | |
| Sivelestatc (nM) | 52.5 ± 0.6 | |
Conclusions
In summary, two dimeric furoquinoline alkaloids (anstifolines A and B) with unique coupling patterns along with the biosynthetic related precursors of 1 were isolated from the root bark of D. angustifolius. Their structures were elucidated by comprehensive analysis of NMR spectroscopic data. The absolute configuration were determined by comparison of experimental and theoretically calculated ECD spectra. The biosynthetic pathway of 1 was proposed. The isolated furoquinoline alkaloids with new skeleton were not only of great interest in the chemotaxonomy, plant biochemistry, and synthetic chemical research but also revealed their further biosynthetic pathway. Moreover, through the preliminary activity comparison, these two new skeletons exhibited better activities in cytotoxicity and significant inhibition on superoxide anion generation and elastase release than their monomer forms. Further, we speculate that with further research, we will find more complex furoquinoline alkaloids with more excellent activities.Acknowledgements
This project was supported by the National Natural Science Foundation of China (No. 31500277) and the Open Fund of Guangxi Key Laboratory of Eearly Prevention in Regional High incidence Cancer (No. GK2015-TKF02).Notes and references
-
(a) T. S. Wu, C. Y. Li, Y. L. Leu and C. Q. Hu, Phytochemistry, 1999, 50, 509–512 CrossRef CAS
; (b) J. P. Michael, Nat. Prod. Rep., 2008, 25, 166–187 RSC
-
(a) M. Y. Lv, X. Ping, T. Yuan, J. Y. Liang, Y. Q. Gao, F. G. Xu, Z. J. Zhang and J. B. Sun, J. Ethnopharmacol., 2015, 171, 247–263 CrossRef CAS PubMed
-
(a) H. Paulini, R. Waibel and O. Schimmer, Mutat. Res. Lett., 1989, 227, 179–186 CrossRef CAS
- T. E. Sackett, G. N. Towers and M. B. Isman, Chemoecology, 2007, 17, 97–101 CrossRef CAS
-
(a) S. Groysman, I. Goldberg, M. Kol, E. Genizi and Z. Goldschmidt, Organometallics, 2003, 22, 3013–3015 CrossRef CAS
- J. B. Sun, W. Qu, P. Wang, F. H. Wu, L. Y. Wang and J. Y. Liang, Fitoterapia, 2013, 90, 209–213 CrossRef CAS PubMed
- P. Twentyman and M. B. Luscombe, J. Cancer, 1987, 56, 279 CrossRef CAS
- A. S. Tan and M. V. Berridge, J. Immunol. Methods, 2000, 238, 59–68 CrossRef CAS PubMed
- T. L. Hwang, S. H. Yeh, Y. L. Leu, C. Y. Chern and H. C. Hsu, Br. J. Pharmacol., 2006, 148, 78–87 CrossRef CAS PubMed
- N. Harada, K. Nakanishi and S. Tatsuoka, J. Am. Chem. Soc., 1969, 91, 5896–5898 CrossRef CAS PubMed
- B. P. Ying, G. W. Qin and R. S. Xu, Chin. J. Org. Chem., 1987, 3, 165–173 Search PubMed
- Y. D. Zhao, R. F. Chen, T. L. Wang and J. B. Chang, Spectrosc. Spectral Anal., 1989, 10, 16–19 Search PubMed
- M. J. Frisch, G. W. Trucks, H. B. Schlegel, G. E. Scuseria, M. A. Robb, J. R. Cheeseman, G. Scalmani, V. Barone, B. Mennucci, G. A. Petersson, H. Nakatsuji, M. Caricato, X. Li, H. P. Hratchian, A. F. Izmaylov, J. Bloino, G. Zheng, J. L. Sonnenberg, M. Hada, M. Ehara, K. Toyota, R. Fukuda, J. Hasegawa, M. Ishida, T. Nakajima, Y. Honda, O. Kitao, H. Nakai, T. Vreven, J. A. Montgomery Jr, J. E. Peralta, F. Ogliaro, M. Bearpark, J. J. Heyd, E. Brothers, K. N. Kudin, V. N. Staroverov, T. Keith, R. Kobayashi, J. Normand, K. Raghavachari, A. Rendell, J. C. Burant, S. S. Iyengar, J. Tomasi, M. Cossi, N. Rega, J. M. Millam, M. Klene, J. E. Knox, J. B. Cross, V. Bakken, C. Adamo, J. Jaramillo, R. Gomperts, R. E. Stratmann, O. Yazyev, A. J. Austin, R. Cammi, C. Pomelli, J. W. Ochterski, R. L. Martin, K. Morokuma, V. G. Zakrzewski, G. A. Voth, P. Salvador, J. J. Dannenberg, S. Dapprich, A. D. Daniels, O. Farkas, J. B. Foresman, J. V. Ortiz, J. Cioslowski and D. J. Fox, Gaussian 09, Revision C.01, Gaussian, Inc., Wallingford, CT, 2010 Search PubMed
- G. Bringmann, B. K. Lombe, C. Steinert, K. N. Ioset, R. Brun, F. Turini, G. n. Heubl and V. Mudogo, Org. Lett., 2013, 15, 2590–2593 CrossRef CAS PubMed
Footnotes |
| † Electronic supplementary information (ESI) available: HRMS, UV, IR, 1D NMR, 2D NMR graphic data and CD experimental coefficients. See DOI: 10.1039/c5ra26460j |
| ‡ These authors contributed equally. |
| This journal is © The Royal Society of Chemistry 2016 |