
Adsorption of Cd(II) from aqueous solution by biogenic selenium nanoparticles†
Fanghui Yuan,
Chao Song,
Xuefei Sun,
Linrui Tan,
Yunkun Wang and
Shuguang Wang*
Shandong Key Laboratory of Water Pollution Control and Resource Reuse, School of Environmental Science and Engineering, Shandong University, Jinan 250100, China. E-mail: wsg@sdu.edu.cn; Fax: +86 531 88364513; Tel: +86 531 88365919
First published on 26th January 2016
Abstract
Biogenic selenium nanoparticles (BioSeNPs), which were produced by aerobic granular sludge in a sequencing batch reactor (SBR), were used to remove cadmium from aqueous solution. Batch experiments were carried out to investigate the effect of contact time, initial solution pH and adsorbent dosage on adsorption. The Langmuir model was more suitable to describe the adsorption process than the Freundlich model, with a monolayer maximum adsorption capacity of 59.7 mg g−1 for Cd(II) adsorption by the BioSeNPs. The isotherm data were also well described by the Temkin model, which further supported that Cd(II) adsorption was a chemisorption process. The adsorption kinetics data were well described by the pseudo-second-order kinetic model with r2 values exceeding 0.999. The overall rate process was influenced by both external mass transfer and intraparticle diffusion, but was mainly controlled by intraparticle diffusion. The negative values of ΔG0 and ΔH0 indicated that the adsorption process was spontaneous and exothermic. Energy dispersive X-ray spectrometry (EDS) analysis confirmed that Cd(II) was adsorbed onto BioSeNPs. After being loaded with Cd(II), the BioSeNPs had less negative zeta potential values and no obvious change in the isoelectric point was observed. The Fourier transform infrared spectroscopy (FTIR) and X-ray photoelectron spectroscopy (XPS) analysis indicated that the removal of Cd(II) was a complicated process, in which electrostatic attraction and surface complex formation were involved. The results demonstrated that BioSeNPs could be used to remove cadmium from aqueous solution with high efficiency.
Introduction
Due to the fast development of industry in recent decades, more and more heavy metals have been emitted into the environment.1–3 These metals are usually highly toxic, nonbiodegradable, carcinogenic and can be accumulated through the food chain, even at very low concentrations.4 Therefore, it is urgent and necessary to remove heavy metals from natural waters.Cadmium (Cd) is one of these dangerous metals that is released into the environment through metal production, electroplating, photography and the manufacturing of batteries.5 It has been reported that chronic exposure to Cd could lead to renal degradation, skeletal deformity, muscular cramps and death in mammals and humans.4 Thus, the UK Department for Environment, Food & Rural Affairs has listed Cd in the red list of priority pollutants and it also has been included in the black list of the Dangerous Substance Directive in the European Economic Community.3 According to previous research, there are many methods for Cd removal from wastewater including chemical precipitation, coagulation–flocculation, membrane filtration, ion exchange, electrolysis and adsorption.1 Compared with the other methods, adsorption is more flexible and easy to operate, with low operational cost and high efficiency in the removal of heavy metal ions from dilute solutions.6 Various adsorbents such as activated carbon,7 root cell walls8 and bamboo charcoal3 have been studied in recent decades. However, theose adsorbents are usually inefficient. There is still a long way to go in the search for adsorbents with higher adsorption capacity, faster kinetics and lower cost.
In recent years, the application of selenium nanoparticles (SeNPs) has attracted great attention. Previous studies have reported that SeNPs could be utilized as antimicrobials, fertilizers, semiconductors and sensors.9 Recently, it was found that SeNPs could be used as an adsorbent for the removal of heavy metals in solution due to their small size, large specific surface area and negative surface charge.6 Although chemically produced selenium nanoparticles (CheSeNPs) adsorb high quantities of copper,10 chemical production methods are costly and not environmentally friendly due to the use of toxic reagents, high temperature and high pressure. In contrast, biologically produced selenium nanoparticles (BioSeNPs) could be a potential adsorbent for heavy metal cations such as zinc, copper and nickel6 because they can be produced by an eco-friendly method under ambient conditions. BioSeNPs produced by the anaerobic reduction of selenite in the presence of anaerobic granular sludge have been successfully used to remove zinc from a water system. Compared with the anaerobic granular sludge, aerobic granular sludge has attracted more attention due to its advantages such as short start time and a perfect ability for the biological removal of nitrogen and phosphorus. However, there is no information about using aerobic biologically produced SeNPs as an adsorbent so far. If BioSeNPs were produced by aerobic granular sludge in a sequencing batch reactor (SBR), it may provide a promising method for treating wastewaters which contain heavy metals and selenium oxyanions.
The present study investigated the feasibility of BioSeNPs, which were first produced by aerobic granular sludge, to remove Cd(II) from wastewaters. The adsorption characteristics of Cd(II) onto BioSeNPs were investigated under varying experimental conditions, such as contact time, initial solution pH and adsorbent dosage. The adsorption kinetics and isotherm data, as well as Fourier transform infrared spectroscopy (FTIR) and X-ray photoelectron spectroscopy (XPS) analysis, were processed to understand the adsorption mechanism. This study would provide an overall understanding of Cd(II) adsorption by BioSeNPs.
Materials and methods
Selenium nanoparticles production and purification
Selenium nanoparticles were produced by aerobic granular sludge in a SBR with an initial mixed liquor suspended solids (MLSS) concentration of 3000 mg L−1 and sludge volume index (SVI) of 33.6 mL g−1. The SBR was operated at room temperature (22–25 °C) and neutral pH (7.2–7.5). Sodium selenite was added as the selenium source.The production of SeNPs was confirmed by the appearance of a red color both on the granular sludge and in the medium.11 The effluent was collected by simple decanting and then was concentrated by centrifuging at 5000 rpm and 4 °C. The pellet was re-suspended in distilled water and purified by the protocol described by Jain et al.6 The obtained pellet was lyophilized and stored in a drying vessel at room temperature.
Characterization of the BioSeNPs
The surface morphology and size of the BioSeNPs were characterized by Scanning Electron Microscopy (SEM, JSM 6700F, JEOL, Japan). Energy dispersive X-ray spectrometry (EDS, Oxford, INCA X sight, OIMS, England) was used to analyze the elemental composition of the BioSeNPs before and after Cd(II) adsorption. The average particle size of the BioSeNPs was measured by dynamic light scattering (DLS, BI-200SM/BI-9000, Brookhaven Instrument Co., USA). The isoelectric point (IEP) of the BioSeNPs was measured using a laser electrophoresis zeta potential analyzer (Zetasizer III, Malvern, USA).FTIR (Bruker Tensor 27 spectrometer, USA) was also used to analyze the dried BioSeNPs samples before and after Cd(II) adsorption. The XPS (Thermo ESCALAB 250, USA) spectra of the BioSeNPs before and after Cd(II) adsorption were collected, applying an energy source of monochromatic Al Kα radiation (1486.6 eV) operated at 150 W. Wide scans were conducted from 0 to 1200 eV with a pass energy of 70 eV. The elements to be analyzed were scanned over different energy ranges with a pass energy of 30 eV. The binding energy of the spectra was standardized with the C 1s peak at 284.8 eV.
Preparation of solutions
All the chemicals used in this study were of guaranteed analytical grade purchased from Sinopharm (Shanghai, China). The stock solution of Cd(II) with a concentration of 20 g L−1 was prepared by dissolving Cd(NO3)2·4H2O in deionized water. The desired Cd(II) concentrations in latter experiments were prepared by diluting the stock solution with deionized water.Batch adsorption experiments
Adsorption experiments were performed in a Thermo Forma orbital shaker with a shaking speed of 160 rpm at 30 °C. A series of adsorption experiments were carried out in 50 mL conical flasks which contained 20 mL Cd(II) solution at the required concentration and pH. Time-dependency studies were carried out at pH 7.0 with Cd(II) and BioSeNPs concentrations of 50 mg L−1 and 1.0 g L−1, respectively. The samples were collected at different time intervals up to 24 h to determine the equilibrium time. Single-point adsorption experiments were carried out to investigate the effect of initial solution pH on the adsorption process. The initial Cd(II) concentration was 50 mg L−1 and the pH values of the initial solutions were adjusted in the range of 4.0–10.0 with HCl (0.1 M) or NaOH (0.1 M) solutions. Control experiments were carried out to rule out the influence of precipitation. The effect of the adsorbent dosage at pH 7.0 was studied by varying the adsorbent dosage (0.5–5.0 g L−1) with the initial Cd(II) concentration in the range of 20–100 mg L−1.Adsorption kinetics experiments
Adsorption kinetics experiments were carried out with three different initial Cd(II) concentrations of 20, 50 and 100 mg L−1. The pH was set at 7.0 and the adsorbent concentration was set at 1.0 g L−1. Samples were collected at 0, 0.5, 1, 2, 4, 6, 9, 12 and 15 h for Cd(II) analysis.Adsorption isotherm experiments
Cd(II) solutions of various concentrations (10–150 mg L−1) were added to 50 mL conical flasks for adsorption experiments. Then, a certain amount of BioSeNPs was added into each flask, making the concentration 1.0 g L−1. These flasks were stirred at 160 rpm at five temperatures (293, 298, 303, 308 and 313 K) for 10 h to reach the adsorption equilibrium. The samples were collected at 0 and 10 h to quantify the initial and equilibrium Cd(II) concentrations.The obtained samples were first centrifuged at 8000 rpm for 10 min, and then the supernatant was filtered with 0.22 μm syringe filters. The residual Cd(II) concentration in the filtrate was analyzed using a flame atomic absorption spectrophotometer. Control experiments were carried out to discard the possibility of adsorption of Cd(II) ions to the filter material and conical flasks.
The adsorption capacity was expressed as the amount of Cd(II) adsorbed per mass unit of BioSeNPs using the following equation:
 | (1) |
Results and discussion
Characterization of the BioSeNPs
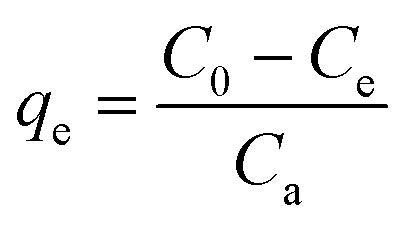
The red BioSeNPs synthesized by the reduction of SeO32− by aerobic granular sludge are primarily spherical in shape with sizes in the range of 50–150 nm (Fig. S1†). EDS analysis of the BioSeNPs indicated the presence of selenium (Fig. 1a). The presence of carbon, oxygen, phosphorus and sulfur may be in response to the presence of extracellular polymeric substances (EPS) which attached to the BioSeNPs. EDS analysis of the Cd-loaded BioSeNPs confirmed the existence of Cd(II). The characteristic peak for Cd was at 3.20 keV, which was similar to the Cd(II) signal observed at the same energy in Cd-loaded nZVI particles.12 The DLS analysis of the BioSeNP solution revealed that particles were in the size range of 98 nm to 131 nm with an average size of 113 nm (Fig. 1b), which was in agreement with the SEM finding. The polydispersity index (PDI) was 0.005, indicating high stability of the BioSeNPs in solution.13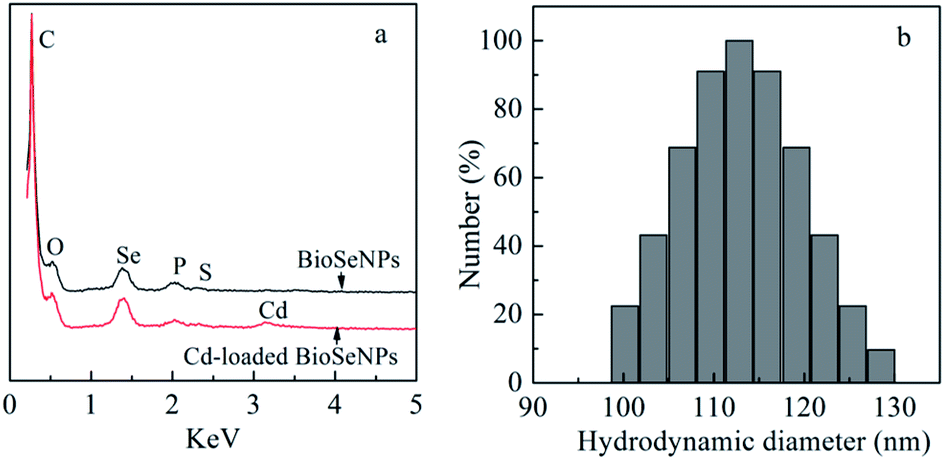 | ||
| Fig. 1 (a) EDS analysis of BioSeNPs and Cd-loaded BioSeNPs; (b) DLS analysis of BioSeNPs (avg. size: 113 nm). | ||
As shown in Fig. 2, the IEP of the BioSeNPs was at pH 4.1. Above pH 6.0, BioSeNP suspensions were colloidally stable due to their intrinsic negative charge of <−25 mV.14 Hence, BioSeNPs have a potential ability to combine with heavy metal cations. After being loaded with Cd(II), the BioSeNPs have less negative zeta potential values, especially at alkaline pH, due to anion–cation combination, suggesting that the colloidal stability of the BioSeNPs decreased after Cd(II) was loaded on the surface of the BioSeNPs. No appreciable change was observed in the IEP; this can be accounted for by the relatively small amount of Cd(II) adsorption at pH 4.1.
 | ||
| Fig. 2 Zeta potential measurements of BioSeNPs (a) and BioSeNPs exposed to 100 mg L−1 Cd(II) (b). | ||
Batch adsorption experiments
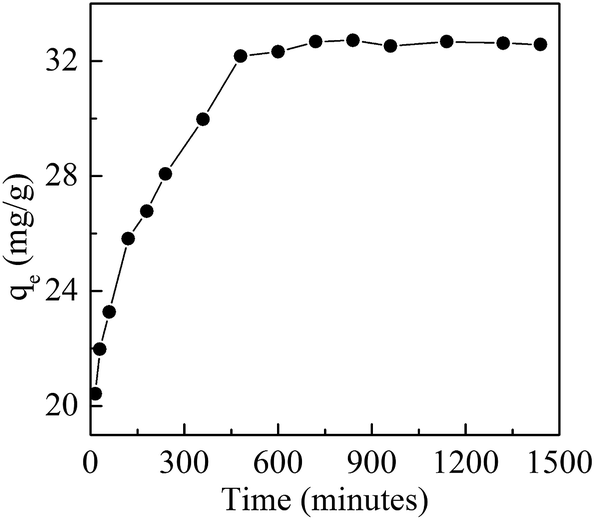 | ||
| Fig. 3 Effect of contact time on the adsorption of Cd(II) by BioSeNPs. | ||
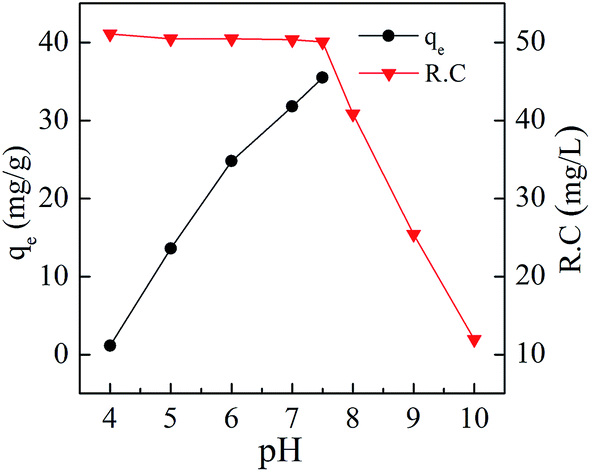 | ||
| Fig. 4 Effect of initial solution pH on the adsorption of Cd(II) by BioSeNPs. | ||
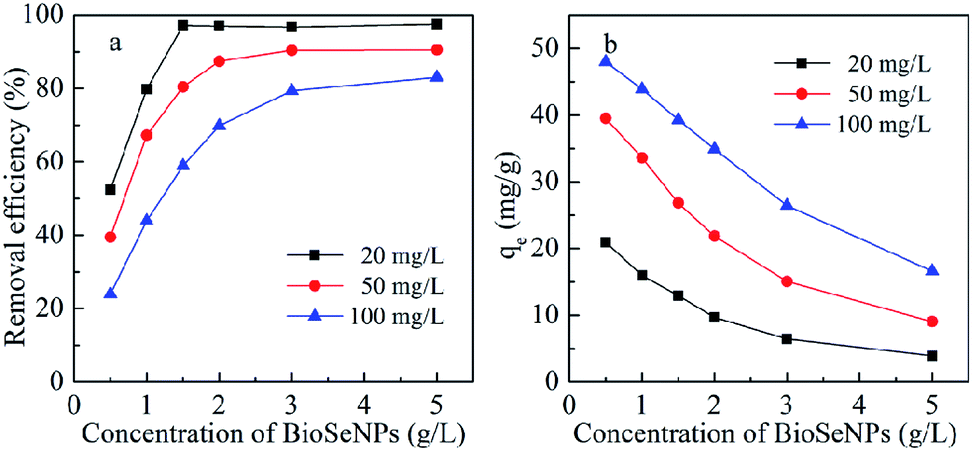 | ||
| Fig. 5 Effect of BioSeNP dosage on the adsorption of Cd(II) by BioSeNPs under different initial Cd(II) concentrations. | ||
As shown in Fig. 5b, the adsorption capacity, the amount of Cd(II) adsorbed per mass unit of BioSeNPs, decreased with increasing adsorbent dosage. One possible explanation is that the available Cd(II) concentration is insufficient to cover the active sites at high adsorbent concentrations, resulting in low metal uptake.19 Another explanation is that high adsorbent concentration will cause particle–particle aggregation and lead to a decrease of the total surface area, which causes decreased adsorption.17 The adsorption capacity increased with the increasing initial Cd(II) concentration of the solution and the increased qe at higher initial concentration can be attributed to an enhanced driving force.3
Adsorption kinetics
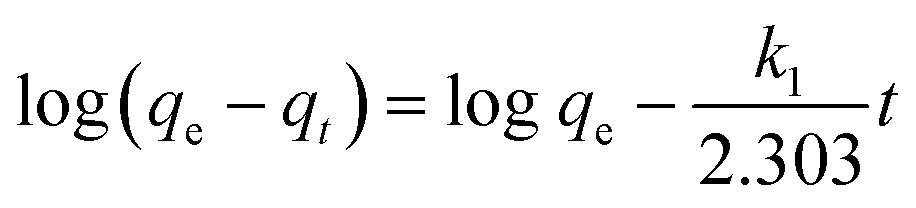
The kinetics of adsorption would help to understand the adsorption mechanisms and investigate the efficiency of the adsorbent for the removal of pollutants.20 In this study, in order to evaluate the kinetics of the adsorption process, the pseudo-first-order, pseudo-second-order and intraparticle diffusion models were used to analyze the experimental data.The linear form of the pseudo-first-order model12 is expressed as:
 | (2) |
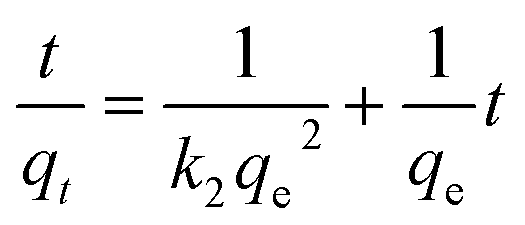
The linear form of the pseudo-second-order model12 can be expressed as:
 | (3) |
The intraparticle diffusion model is expressed as:21
| qt = kidt0.5 + I | (4) |
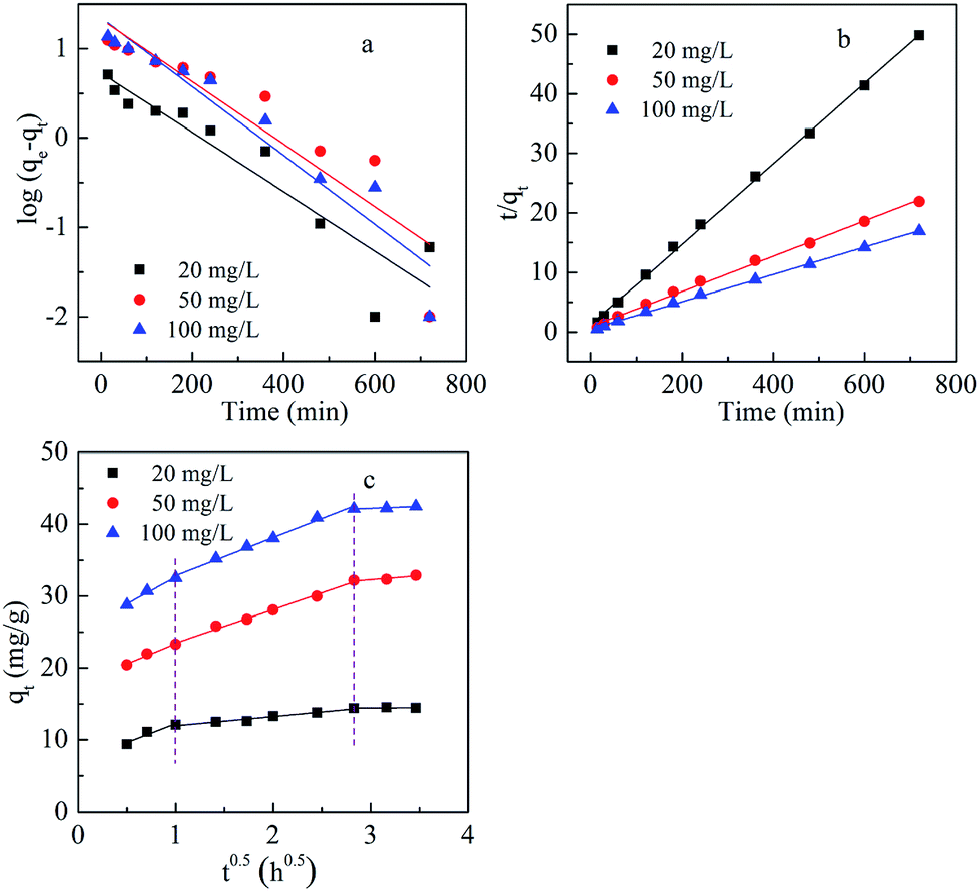
Fig. 6a shows the pseudo-first-order kinetic plots of log(qe − qt) versus t for Cd(II) adsorption at different initial metal concentrations. Kinetic parameters including the first-order rate constant (k1), calculated equilibrium adsorption capacity (qe,cal) and the regression coefficient (r2) were calculated and summarized in Table 1. The large difference between qe,exp and qe,cal and also the much lower regression coefficients (r2 < 0.92) indicated that the pseudo-first-order model is not appropriate to describe the adsorption of Cd(II) onto BioSeNPs.
 | ||
| Fig. 6 Pseudo-first-order (a), pseudo-second-order (b), and intraparticle diffusion (c) kinetics of Cd(II) adsorption on BioSeNPs at various concentrations. | ||
| Concentration (mg L−1) | qe,exp (mg g−1) | Pseudo-first-order | ||
|---|---|---|---|---|
| k1 (×10−3 s−1) | qe,cal (mg g−1) | r2 | ||
| 20 | 14.4 | 0.13 | 5.36 | 0.85 |
| 50 | 32.9 | 0.13 | 21.45 | 0.83 |
| 100 | 42.5 | 0.15 | 22.19 | 0.92 |
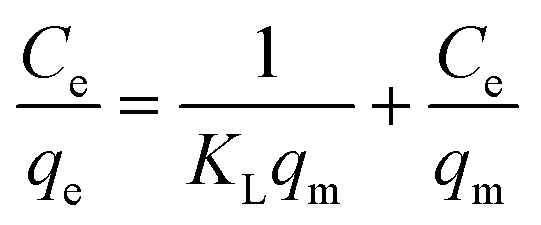
Fig. 6b shows the pseudo-second-order kinetic plots of t/qt versus t for Cd(II) adsorption at different initial metal concentrations and the obtained kinetic parameters are shown in Table 2. All three regression coefficients (r2) were higher than 0.999, suggesting the adsorption process follows pseudo-second-order kinetics. Moreover, the theoretical qe values calculated from the pseudo-second-order kinetic model were in good agreement with those obtained experimentally, which also suggested that the pseudo-second-order model is more suitable for representing Cd(II) adsorption kinetics on BioSeNPs.
| Concentration (mg L−1) | qe,exp (mg g−1) | Pseudo-second-order | |||
|---|---|---|---|---|---|
| k2 (×10−4 g mg−1 s−1) | qe,cal (mg g−1) | h (mg g−1 s−1) | r2 | ||
| 20 | 14.4 | 0.63 | 14.78 | 0.014 | 0.999 |
| 50 | 32.9 | 0.17 | 33.78 | 0.019 | 0.999 |
| 100 | 42.5 | 0.18 | 43.67 | 0.034 | 0.999 |
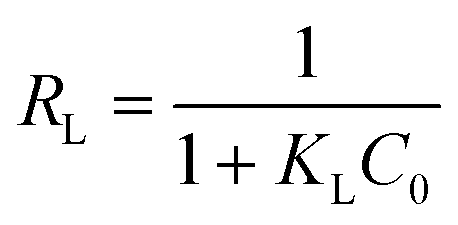
In order to identify the diffusion mechanism, the intraparticle diffusion model was used to predict the rate-controlling step. From this study, multi-linearities were observed (Fig. 6c), indicating that there was three-stage diffusion of Cd(II) onto the BioSeNPs. The first stage was from 0 h to 1 h, representing external mass transfer. The second stage included the adsorption period from 1 h to 8 h, representing intraparticle diffusion. The last stage indicated the adsorption–desorption equilibrium, including the period from 8 h to 12 h.15
The kinetic parameters (kid and I) of the intraparticle diffusion section were calculated and summarized in Table 3. As the plots did not pass through the origin, intraparticle diffusion is not the unique rate-controlling step.15 Due to the large intercepts of the second linear portion of the plots, external mass transfer is also significant in the rate-controlling step.22 However, the ratio of the time taken by external mass transfer to intraparticle diffusion was about 1![[thin space (1/6-em)]](https://www.rsc.org/images/entities/char_2009.gif) :7. So, intraparticle diffusion was predominant over external mass transfer.
:7. So, intraparticle diffusion was predominant over external mass transfer.
| Concentration (mg L−1) | kid (mg g−1 h−0.5) | Intercept values (I) | r2 |
|---|---|---|---|
| 20 | 1.28 | 10.67 | 0.96 |
| 50 | 4.67 | 18.80 | 0.99 |
| 100 | 5.30 | 27.55 | 0.99 |
Adsorption isotherms
Adsorption isotherms describe the adsorption mechanism of a solute adsorbing on an adsorbent surface, which helps in optimizing the design of a specific adsorption process. In this study, the equilibrium data obtained for Cd removal using BioSeNPs were tested with three isotherm models available in the literature to reveal the best fitting isotherm.5The Freundlich isotherm is applicable to the description of the adsorption of metal on a heterogeneous surface by multilayer adsorption. The linear form of the Freundlich isotherm model12 is expressed as:
 | (5) |
qe versus logCe on the basis of the linear form of the Freundlich equation. These constants are also related to adsorption capacity and adsorption intensity, respectively. Ce is the equilibrium concentration (mg L−1).
The Langmuir isotherm assumes monolayer adsorption on a homogeneous surface with a finite number of adsorption sites. After a certain time, the surface will eventually reach a saturation point and achieve maximum adsorption. The linear form of the Langmuir isotherm model12 is described as:
 | (6) |
The Langmuir constant (KL) is adapted to calculate the dimensionless separation factor (RL), which determines the favorability of the adsorption process. The relationship between RL and KL can be expressed as:20
 | (7) |
The Temkin isotherm model assumes that the adsorption energy would decrease linearly with the surface coverage due to adsorbent–adsorbate interactions. The linear form of the Temkin isotherm model12 is given as:
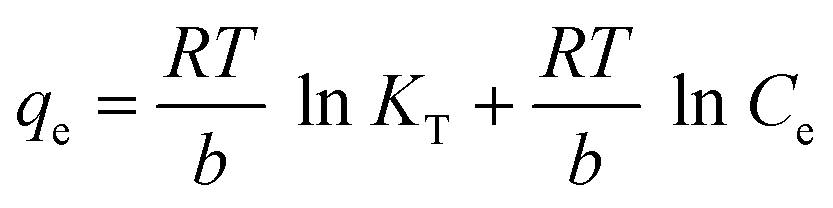 | (8) |
Ce on the basis of the linear form of the Temkin isotherm.12
The adsorption studies were conducted at a fixed initial concentration of Cd(II) while changing the temperature. The equilibrium data obtained from the isotherm studies were fitted to Freundlich, Langmuir and Temkin isotherm models to obtain the best fitting isotherm. The isotherms are shown graphically in Fig. 7 and the isotherm parameters are listed in Table 4. As shown in Table 4, the value of KF decreased with increasing temperature, which indicated that the adsorption process of Cd(II) onto BioSeNPs is exothermic.
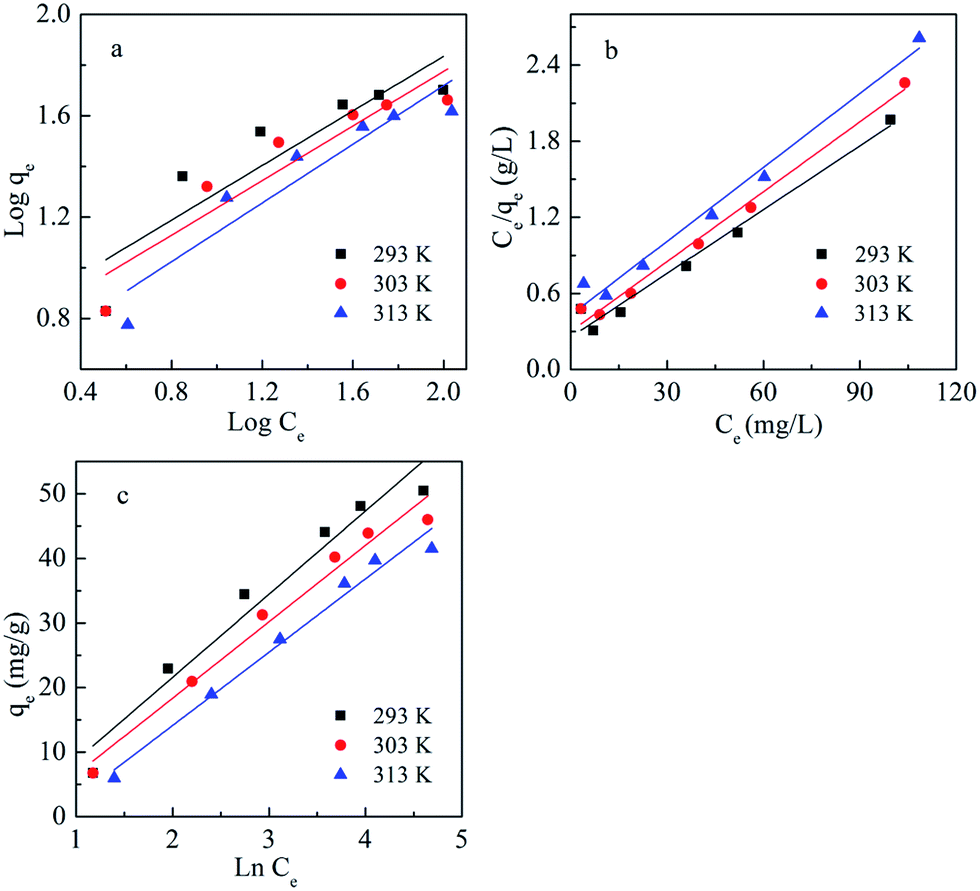 | ||
| Fig. 7 Linearized Freundlich (a), Langmuir (b) and Temkin (c) isotherms for Cd(II) adsorption on BioSeNPs at different temperatures. | ||
| Isotherm | Temperature (K) | Parameters | r2 | |
|---|---|---|---|---|
| KF | n | |||
| Freundlich | 293 | 5.71 | 1.85 | 0.773 |
| 303 | 4.99 | 1.86 | 0.849 | |
| 313 | 3.70 | 1.73 | 0.861 | |
| Isotherm | Temperature (K) | Parameters | r2 | |
|---|---|---|---|---|
| qm (mg g−1) | KL (L mg−1) | |||
| Langmuir | 293 | 59.70 | 0.066 | 0.971 |
| 303 | 54.44 | 0.061 | 0.987 | |
| 313 | 51.52 | 0.045 | 0.978 | |
| Isotherm | Temperature (K) | Parameters | r2 | |
|---|---|---|---|---|
| KT | b | |||
| Temkin | 293 | 0.723 | 189.1 | 0.953 |
| 303 | 0.639 | 212.9 | 0.972 | |
| 313 | 0.470 | 229.1 | 0.976 | |
According to the results, both the Langmuir model and Temkin model were suitable to describe this adsorption process, with high linearity coefficients. Comparison of the coefficients indicates that the Langmuir isotherm fitted more precisely (r2 > 0.97) than the Temkin isotherm (r2 > 0.95). The basic assumption of the Langmuir adsorption isotherm is monolayer adsorption on a homogenous surface with a finite number of adsorption sites, which means that the adsorption of Cd(II) onto BioSeNPs generates monolayer formation.3 The maximum adsorption capacity was 59.7 mg g−1 and it is much higher than those of most other adsorbents reported in previous literature: bamboo charcoal (12.08 mg g−1),3 activated guava leaves (19.15 mg g−1),4 MnO2 functionalized multi-walled carbon nanotubes (41.6 mg g−1),15 modified algae (41.80 mg g−1),23 activated alumina (35.06 mg g−1),18 untreated Pinus halepensis sawdust (7.35 mg g−1),5 porous urea–formaldehyde (3.12 mg g−1),24 and wheat stem (11.16 mg g−1).25 The calculated values of RL for the adsorbent at different temperatures are 0.23 (293 K), 0.25 (303 K), and 0.31 (313 K). All the values of RL are less than unity, which confirms the favorable adsorption process. The basic assumption of the Temkin adsorption isotherm is a chemisorption process and the linear plots for the Temkin adsorption isotherm fit quite well, with r2 > 0.95 at all temperatures. This indicated that the adsorption of Cd(II) onto BioSeNPs is a chemisorption process.12
Thermodynamic parameters
The temperature dependence of the adsorption process is associated with several thermodynamic parameters, such as Gibb’s free energy change (ΔG0), enthalpy change (ΔH0) and change in entropy (ΔS0), which can be determined by using the following equations:20
 | (9) |
 | (10) |
The values of ΔH0 and ΔS0 can be calculated by plotting ln(qe/Ce) versus 1/T (Fig. 8). All these thermodynamic parameters for adsorption of Cd(II) by BioSeNPs are shown in Table 5.
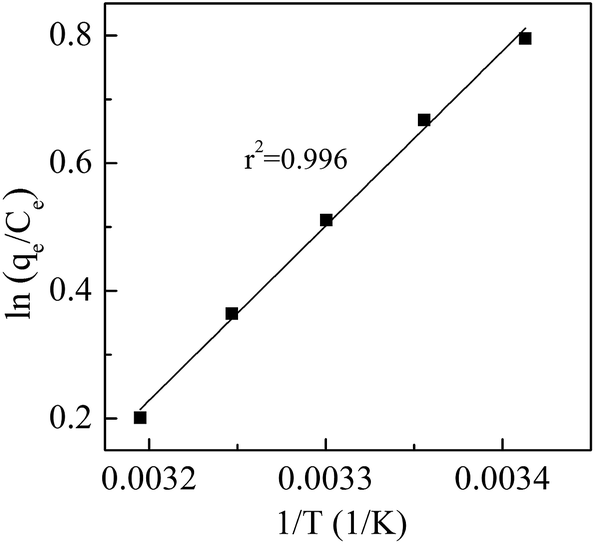 | ||
| Fig. 8 Van’t Hoff plot for adsorption of Cd(II) by BioSeNPs. | ||
| Temperature (K) | ΔG0 (kJ mol−1) | ΔH0 (kJ mol−1) | ΔS0 (J mol−1 K−1) |
|---|---|---|---|
| 293 | −1.94 | −22.75 | −70.91 |
| 303 | −1.29 | −22.75 | −70.91 |
| 313 | −0.52 | −22.75 | −70.91 |
As shown in Table 5, the negative values of ΔG0 indicate that the adsorption processes are spontaneous at the studied temperatures. However, the increase in temperature led to a less negative value of ΔG0, indicating that the reaction becomes less spontaneous at high temperatures. This is confirmed by the negative value of ΔH0, which revealed that the adsorption of Cd(II) on BioSeNPs is an exothermic process. The negative values of ΔS0 suggested there is a decrease in the randomness at the solid–liquid interface of the Cd(II) on the BioSeNPs surface and no significant changes occur in the internal structure of the adsorbent through the adsorption. Similar results for thermodynamic parameters were also reported by earlier workers for the adsorption of Cd(II) as well as other heavy metals from aqueous solution.17
Adsorption mechanism
The FTIR spectra of the BioSeNPs and Cd-loaded BioSeNPs in the range of 750–3750 cm−1 are shown in Fig. 9. The characteristic absorption peaks for the BioSeNPs are summarized as follows:26 the peak at 3298 cm−1 is related to N–H stretching vibrations of amine; the peak at 2932 cm−1 is attributed to C–H stretching of aliphatic groups; the peak at 1655 cm−1 mainly represents the stretching vibration of C![[double bond, length as m-dash]](https://www.rsc.org/images/entities/char_e001.gif) O present in proteins (amide I); the peak at 1540 cm−1 corresponds to the N–H bending vibration in the amide linkage of proteins (amide II); the peak at 1387 cm−1 is most likely attributed to the –CH3 umbrella mode in aliphatic groups or O–H in-plane bending in carbohydrates; the peak at 1054 cm−1 is related to C–O–C stretching arising from the carbohydrate groups. The presence of carboxylic groups is also evidenced by the peak observed at 1726 cm−1. The FTIR of Cd-load BioSeNPs had all the key features of the original BioSeNPs with minor shifts and changes in peak intensities. When Cd(II) was adsorbed on the BioSeNPs, the peak at 3298 cm−1 shifted to 3288 cm−1; 1655 cm−1 shifted to 1644 cm−1; 1540 cm−1 shifted to 1530 cm−1. Shifts in these peaks indicated that Cd(II) reacted with the functional groups (CO, N–H, C–N) of the BioSeNPs.
O present in proteins (amide I); the peak at 1540 cm−1 corresponds to the N–H bending vibration in the amide linkage of proteins (amide II); the peak at 1387 cm−1 is most likely attributed to the –CH3 umbrella mode in aliphatic groups or O–H in-plane bending in carbohydrates; the peak at 1054 cm−1 is related to C–O–C stretching arising from the carbohydrate groups. The presence of carboxylic groups is also evidenced by the peak observed at 1726 cm−1. The FTIR of Cd-load BioSeNPs had all the key features of the original BioSeNPs with minor shifts and changes in peak intensities. When Cd(II) was adsorbed on the BioSeNPs, the peak at 3298 cm−1 shifted to 3288 cm−1; 1655 cm−1 shifted to 1644 cm−1; 1540 cm−1 shifted to 1530 cm−1. Shifts in these peaks indicated that Cd(II) reacted with the functional groups (CO, N–H, C–N) of the BioSeNPs.
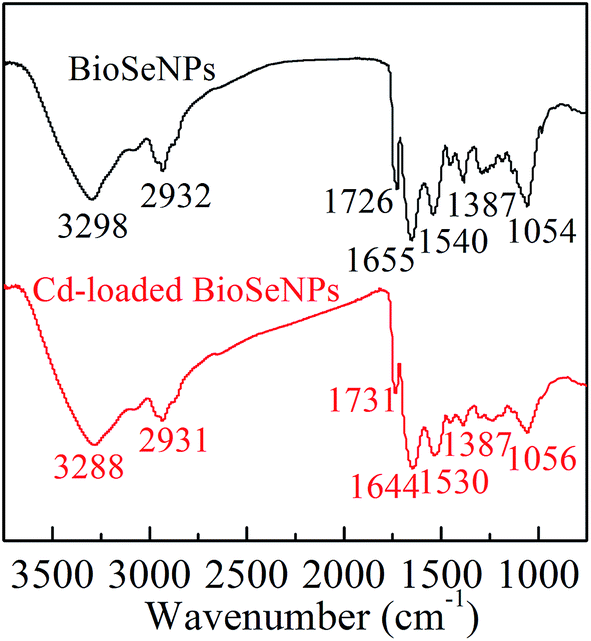 | ||
| Fig. 9 FTIR spectra of BioSeNPs and Cd-loaded BioSeNPs. | ||
XPS analysis was applied to characterize the functional groups involved in the adsorption process. The general spectra for BioSeNPs before and after adsorption are present in Fig. S2.† The scan spectra showed the presence of C 1s, O 1s, N 1s, Se 3d and Cd 3d signals. The presence of C 1s, O 1s and N 1s signals may be attributed to the existence of protein generated during BioSeNP production,27 and the presence of protein was also indicated by the UV-vis spectrum of the BioSeNPs (Fig. S3†). The Cd 3d signal was observed after adsorption which proved the existence of Cd on the BioSeNPs. The signal can be resolved into two peaks with binding energies located at 404.76 eV and 405.40 eV, corresponding to CdO and Cd(OH)2.16 However, the Se 3d signal was very weak, which might be attributed to the protein coating on the BioSeNPs.27
As shown in Fig. 10a–d, the signals of C 1s and O 1s did not show any significant shift before and after adsorption. The C 1s signal can be divided into three peaks with binding energies located at 284.6, 285.9 and 287.7 eV corresponding to C–(C, H), C–(C, N), and CO groups, respectively.28 The O 1s signal can be assigned to three peaks with binding energies located at 530.4, 531.3 and 532.2 eV, corresponding to C–OH, CO, and C–O groups.2 As shown in Fig. S4,† the binding energy for N 1s is centered at 399.5 eV and it may correspond to nitrogen containing groups such as amine and amide groups.6
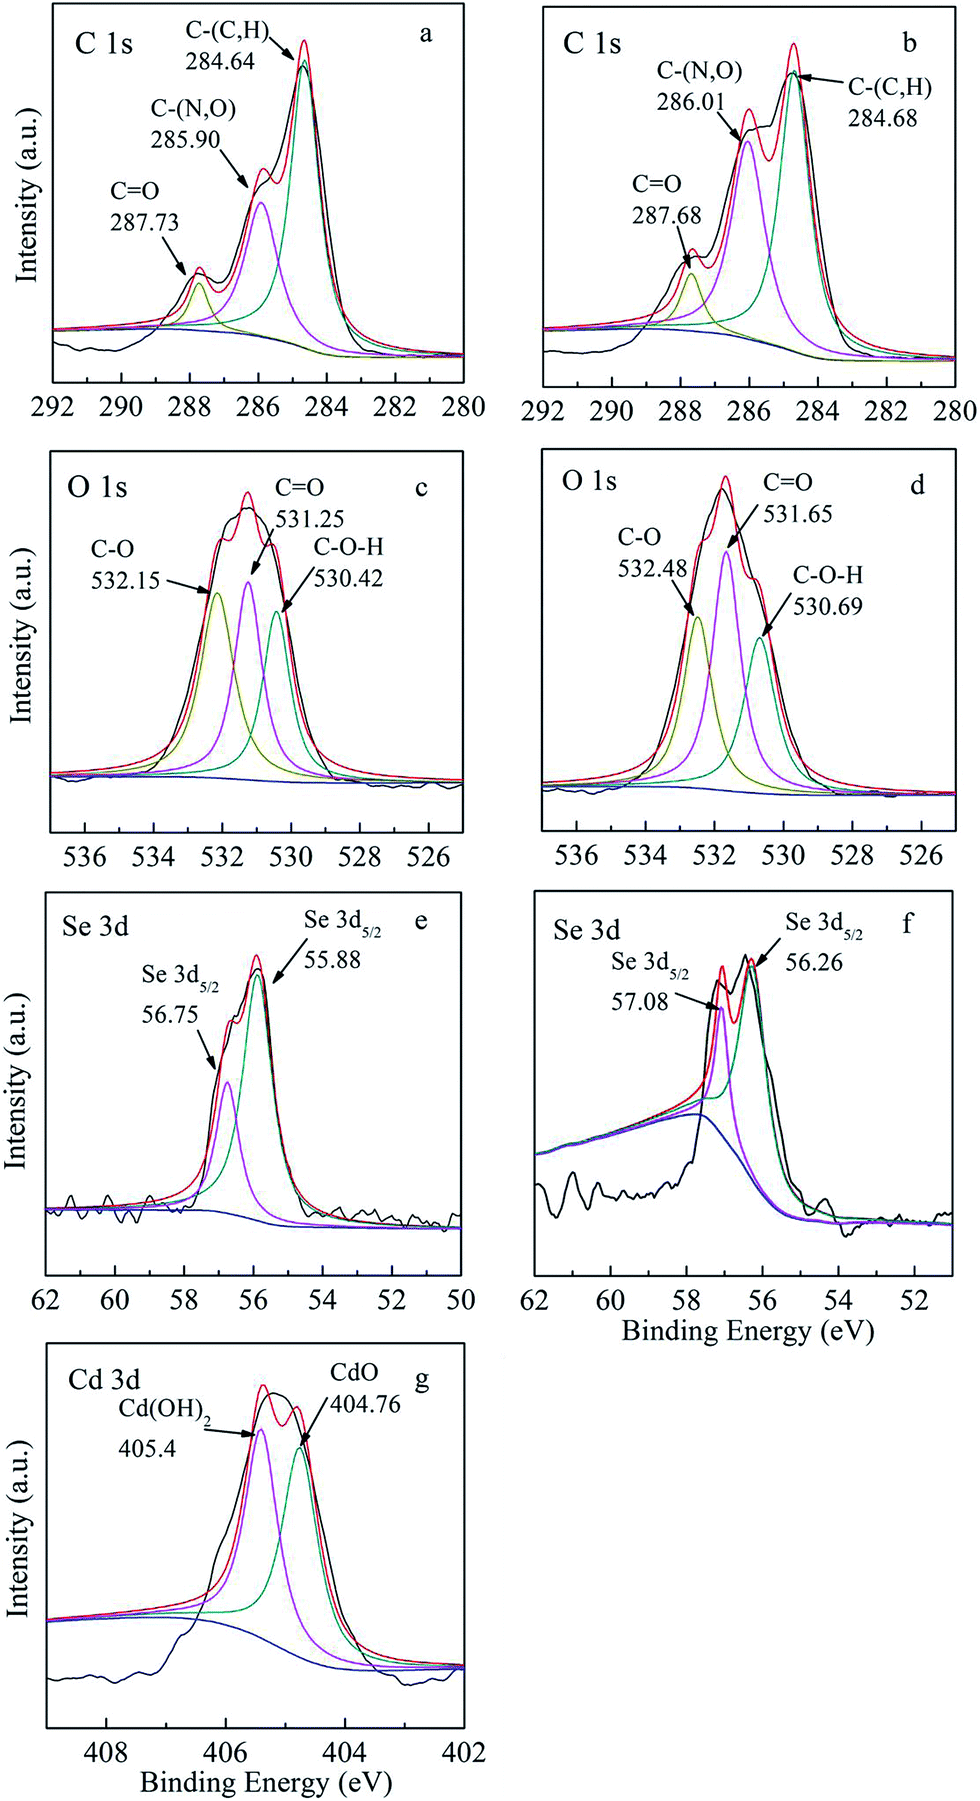 | ||
| Fig. 10 (a) C 1s, (c) O 1s, (e) Se 3d spectra of BioSeNPs and (b) C 1s, (d) O 1s, (f) Se 3d, (g) Cd 3d spectra of Cd-loaded BioSeNPs. | ||
The relative contents of C and O in different groups on the surface of BioSeNPs before and after Cd(II) adsorption are summarized in Table 6. From the relative contents of oxygen, the content of the C–O groups decreased from 38.1% to 29.9% after Cd adsorption, while the amount of CO groups increased from 33.4% to 40.6%. From the relative contents of carbon, the content of CO groups increased from 6.9% to 7.5%, which was consistent with the finding from the relative contents of oxygen. The changes in the C–O and CO groups suggested that these groups were involved in the adsorption of Cd(II) onto the BioSeNPs, which was in accordance with the FTIR analysis. The decrease in C–O groups after Cd adsorption indicated the formation of Cd–O complex species,2 which was supported by the findings we obtained in the XPS spectra of Cd 3d (Fig. 10g).
| Valence state | Proposed components | Binding energy (eV) | Relative content (%) | ||
|---|---|---|---|---|---|
| BioSeNPs | Cd-loaded BioSeNPs | BioSeNPs | Cd-loaded BioSeNPs | ||
| C 1s | C–(C, H) | 284.64 | 284.68 | 60.5 | 51.8 |
| C–(N, O) | 285.90 | 286.01 | 32.8 | 40.7 | |
| CO |
287.73 | 287.68 | 6.7 | 7.5 | |
| O 1s | C–OH | 530.42 | 530.69 | 28.5 | 29.5 |
| CO |
531.25 | 531.65 | 33.4 | 40.6 | |
| C–O | 532.15 | 532.48 | 38.1 | 29.9 | |
As shown in Fig. 10e and f, the signals of the Se 3d showed a little shift before and after adsorption. The Se 3d5/2 peaks at 55.88 eV and 56.75 eV shifted to 56.26 eV and 57.08 eV, respectively.6 This may be explained by Cd(II) adhering on the surface of the negatively charged BioSeNPs by electrostatic attraction10 and can be attributed to the formation of Se–Cd complexes.
Conclusions
The removal of Cd(II) metal ions from aqueous solution by BioSeNPs was investigated. The adsorption capacity increased with increasing solution pH and decreased with increasing adsorbent dosage. EDS analysis confirmed that Cd(II) was adsorbed onto BioSeNPs. After being loaded with Cd(II), the BioSeNPs had less negative zeta potential values and showed no appreciable change in the IEP. The Langmuir model was more suitable to describe the adsorption process than the Freundlich model isotherm. The obtained monolayer maximum adsorption capacity was 59.7 mg g−1 for the adsorption of Cd(II) by BioSeNPs. The equilibrium data were also well described by the Temkin model isotherm, supporting that Cd(II) adsorption was a chemisorptions process. The kinetics of Cd(II) adsorption onto BioSeNPs was accurately described by the pseudo-second-order kinetic model with r2 values exceeding 0.999. The overall rate process was influenced by both external mass transfer and intraparticle diffusion, but was mainly controlled by intraparticle diffusion. The negative values of ΔG0 and ΔH0 indicate that the adsorption process was spontaneous and exothermic. The removal of Cd(II) was a complicated process, in which electrostatic attraction and surface complex formation were involved. Because BioSeNPs were produced by aerobic granular sludge in a SBR, this may provide a new way for treating wastewaters which contain heavy metals and selenium oxyanions.Acknowledgements
This research was funded by the National Natural Science Foundation of China (51178254 and 51208283), Research Award Fund for Outstanding Young Scientists of Shandong Province, China (BS2012HZ008) and China Postdoctoral Science Foundation (2015M570596).References
- L. Zeng, Y. Chen, Q. Zhang, X. Guo, Y. Peng, H. Xiao, X. Chen and J. Luo, Carbohydr. Polym., 2015, 130, 333–343 CrossRef CAS PubMed.
- Q. Li, L. Chai and W. Qin, Chem. Eng. J., 2012, 197, 173–180 CrossRef CAS.
- F. Y. Wang, H. Wang and J. W. Ma, J. Hazard. Mater., 2010, 177, 300–306 CrossRef CAS PubMed.
- O. Abdelwahab, Y. O. Fouad, N. K. Amin and H. Mandor, Environ. Prog. Sustainable Energy, 2015, 34, 351–358 CrossRef CAS.
- L. Semerjian, J. Hazard. Mater., 2010, 173, 236–242 CrossRef CAS PubMed.
- R. Jain, N. Jordan, D. Schild, E. D. van Hullebusch, S. Weiss, C. Franzen, F. Farges, R. Hübner and P. N. L. Lens, Chem. Eng. J., 2015, 260, 855–863 CrossRef CAS.
- H. K. An, B. Y. Park and D. S. Kim, Water Res., 2001, 35, 3551–3556 CrossRef CAS PubMed.
- G. Chen, Y. Liu, R. Wang, J. Zhang and G. Owens, Environ. Sci. Pollut. Res., 2013, 20, 5665–5672 CrossRef CAS PubMed.
- Y. V. Nancharaiah and P. N. L. Lens, Trends Biotechnol., 2015, 33, 323–330 CrossRef CAS PubMed.
- Y. Bai, F. Rong, H. Wang, Y. Zhou, X. Xie and J. Teng, J. Chem. Eng. Data, 2011, 56, 2563–2568 CrossRef CAS.
- W. Zhang, Z. Chen, H. Liu, L. Zhang, P. Gao and D. Li, Colloids Surf., B, 2011, 88, 196–201 CrossRef CAS PubMed.
- H. K. Boparai, M. Joseph and D. M. O’Carroll, J. Hazard. Mater., 2011, 186, 458–465 CrossRef CAS PubMed.
- N. Srivastava and M. Mukhopadhyay, Powder Technol., 2013, 244, 26–29 CrossRef CAS.
- B. Buchs, M. W. H. Evangelou, L. H. E. Winkel and M. Lenz, Environ. Sci. Technol., 2013, 47, 2401–2407 CrossRef CAS PubMed.
- C. Luo, R. Wei, D. Guo, S. Zhang and S. Yan, Chem. Eng. J., 2013, 225, 406–415 CrossRef CAS.
- L. Peng, Q. Zeng, B. Tie, M. Lei, J. Yang, S. Luo and Z. Song, J. Colloid Interface Sci., 2015, 456, 108–115 CrossRef CAS PubMed.
- T. K. Sen and D. Gomez, Desalination, 2011, 267, 286–294 CrossRef CAS.
- T. K. Naiya, A. K. Bhattacharya and S. K. Das, J. Colloid Interface Sci., 2009, 333, 14–26 CrossRef CAS PubMed.
- S. Malamis and E. Katsou, J. Hazard. Mater., 2013, 252–253, 428–461 CrossRef CAS PubMed.
- L. Cheng, L. Ye, D. Sun, T. Wu and Y. Li, Chem. Eng. J., 2015, 264, 672–680 CrossRef CAS.
- S. A. Singh, B. Vemparala and G. Madras, J. Environ. Chem. Eng., 2015, 3, 2684–2696 CrossRef CAS.
- L. Zhang, T. Xu, X. Liu, Y. Zhang and H. Jin, J. Hazard. Mater., 2011, 197, 389–396 CrossRef CAS PubMed.
- M. Harja, G. Buema, L. Bulgariu, D. Bulgariu, D. Sutiman and G. Ciobanu, Korean J. Chem. Eng., 2015, 32, 1804–1811 CrossRef CAS.
- C. Li, H. Duan, X. Wang, X. Meng and D. Qin, Chem. Eng. J., 2015, 262, 250–259 CrossRef CAS.
- G. Tan and D. Xiao, J. Hazard. Mater., 2009, 164, 1359–1363 CrossRef CAS PubMed.
- R. Jain, N. Jordan, S. Weiss, H. Foerstendorf, K. Heim, R. Kacker, R. Hübner, H. Kramer, E. D. van Hullebusch, F. Farges and P. N. L. Lens, Environ. Sci. Technol., 2015, 49, 1713–1720 CrossRef CAS PubMed.
- T. Wang, L. Yang, B. Zhang and J. Liu, Colloids Surf., B, 2010, 80, 94–102 CrossRef CAS PubMed.
- C. Song, X.-F. Sun, S.-F. Xing, P.-F. Xia, Y.-J. Shi and S.-G. Wang, Environ. Sci. Pollut. Res., 2014, 21, 1786–1795 CrossRef CAS PubMed.
Footnote |
| † Electronic supplementary information (ESI) available. See DOI: 10.1039/c5ra26367k |
| This journal is © The Royal Society of Chemistry 2016 |