Facile surface engineering of CuInS2/ZnS quantum dots for LED down-converters†
K. Gugula *a,
L. Stegemannb,
P. J. Cywińskicd,
C. A. Strassertb and
M. Bredola
aDepartment of Chemical Engineering, Muenster University of Applied Sciences, Stegerwaldstr. 39, 48565, Steinfurt, Germany. E-mail: k.gugula@fh-muenster.de; Tel: +49-0255-19-62694
bPhysics Institute and Center for Nanotechnology, Westfaelische Wilhelms-Universitaet Muenster, Heisenbergstr. 11, 48149 Muenster, Germany
cFunctional Materials and Devices, Fraunhofer Institute for Applied Polymer Research, Geiselbergstr. 69, 14476 Potsdam-Golm, Germany
dInstitute of Physical Chemistry, Polish Academy of Sciences, Kasprzaka 44/52, 01-224 Warsaw, Poland
First published on 20th January 2016
Abstract
We present a facile one-pot synthesis and simple surface modification strategies to prepare ternary CuInS2/ZnS quantum dots (CIS/ZnS QDs) functionalized with alkyl-, carboxyl- and hydroxyl-terminated ligands. Photoluminescence quantum yields (PLQY) up to 60% can be achieved for CIS/ZnS QDs synthesized on a gram scale. Aqueous mercaptopropionic acid (MPA) capped QDs are used as a base for further surface modification. On the one hand ligand–solvent interactions have been found to play a major role in the luminescence quenching mechanism of aqueous CIS/ZnS QDs. On the other hand, solvent extraction, immobilization in a polymer matrix or phase transfer greatly enhances the photoluminescence. Quantum yields in solution and in solid matrices differ greatly in the case of aqueous QDs both in polymers and in sol–gel silica. Surface engineered QDs are assessed for their usefulness in LED down-conversion experiments. We demonstrate that down-converter layer properties are not only dependent on the QD type and PLQY, but also on the matrix and the type of ligand shell. Despite significant (up to a factor of two) differences in PLQY between the hydrophobic and hydrophilic dots, their LED conversion efficiencies are comparable and up to 49% and 46% for hydrophobic and for hydrophilic QDs, respectively. Additionally, sol–gel nanocomposites incorporating CuInS2/ZnS QDs with OH-terminated ligands that can withstand 200 h high power blue LED irradiation are presented for the first time.
1. Introduction
LEDs have revolutionized the lighting market thanks to their efficiency, durability, compact design and environmental friendliness.1–4 Commercial white LED (WLED) devices comprise a blue InGaN LED chip and YAG:Ce colour converter generating white light emission more efficiently than incandescent light bulbs, however with unnatural skin tone reproduction.5–7 Weak colour reproduction comes from insufficient emission intensity in the red. Europium-based inorganic phosphors such as, Y2O2S:Eu3+ or CaAlSiN3:Eu2+ improved the colour rendering index (CRI) of WLEDs but those phosphors suffer from low emission efficiency and weak stability.8,9 Therefore, bright, stable, and inexpensive materials are sought to enable the manufacture of robust warm white LEDs. Quantum dots are a promising alternative to inorganic phosphors that can either complement YAG:Ce by increasing LED emission in the red10–12 or replace it entirely using QDs of various sizes to mimic white light emission.13–15 Ternary QDs, most notably cadmium-free CuInS2 (CIS), are potential candidates as colour converters for LEDs owing to their broad-band emission, large Stokes shifts and low environmental toxicity.16 In fact, excellent colour reproduction properties have already been demonstrated for ternary QDs with CRI exceeding 90.17,18 In order for the ternary QDs to compete with the inorganic phosphors they need to be synthesized via inexpensive and scalable methods while retaining their high photoluminescence efficiency and long-term stability. In this regard, methods employing high boiling solvents require high temperatures, often above 250 °C, employ toxic organic solvents and produce large amounts of solvent waste from the QD washing process that in turn limit the scalability.19–21 Aqueous methods on the other hand are potentially more cost-effective and scalable at a cost of reduced QYs associated with low synthesis temperatures.22–24The benefits of organic and aqueous syntheses can be combined by performing an in situ ligand exchange to produce highly luminescent hydrophilic quantum dots with good stability at gram-scale reaction yields. In this approach, toxic organic solvents can be discarded directly after the synthesis and do not need to be washed away by chemical methods. In order to retain the optical properties of the hydrophobic dots, ligand mobility in the surrounding medium, also termed ligand dynamics, and QD-solvent interactions in aqueous solutions need to be taken into account. From a general point of view the emission properties decrease upon ligand exchange due to QD surface damage and subsequent agglomeration. In some cases however, proper ligand-guided preparation can lead to PLQY enhancement, which usually occurs at low growth temperatures.25–28 For QDs, ligand exchange reactions are in majority conducted using bifunctional thiolate ligands that can replace the original long chain alkyl ligands. However, thiolate ligand dynamics can have a negative impact on the PL properties, which is associated with the thiol–thiolate equilibrium and diffusion processes within the ligand shell.29 Indeed, ligand dynamics in aqueous solutions were found to be pH, time and ligand concentration dependent.30 It is therefore important to ensure proper QD preparation and storage conditions to preserve their high PLQY before further surface modification or the preparation of nanocomposites.
The main challenge for QD-based LEDs is to develop materials that exhibit stable long-term PL properties. In order to achieve that goal, QDs should degrade slower or at the same rate as the InGaN chip itself, which is a difficult task to realize considering that QD photodegradation usually takes place rapidly under high illumination powers.31–33 For ternary quantum dots, down-conversion properties were stabilized only at low forward currents of 20 mA measured over up to 70 h, which is still insufficient for commercial applications.34,35
In this study simple and scalable synthetic and modification strategies are presented for CIS/ZnS QDs in view of prospective applications in LED down-converters. Alkyl-, carboxyl- and hydroxyl-terminated ligands are used for stabilization to obtain QDs soluble in the majority of the technically important solvents. QD performance is studied and compared in various technologically relevant polymers in view of their quantum yields and LED conversion efficiencies. Extraordinarily photostable CIS/ZnS dots embedded in a sol–gel silica hybrid matrix are presented for the first time.
2. Experimental
2.1. Materials
Copper iodide (CuI, 99.99%), indium acetate (In(OAc)3, 99.99%), zinc stearate (ZnSt2, 12% Zn basis), 1-dodecanethiol (DDT, 97%), 1-octadecene (ODE, 90%), oleic acid (OA, 90%), 3-mercaptopropionic acid (MPA, 97%), 11-mercapto-1-undecanol (MUD, 97%), oleylamine (OAm, >70%), polyvinylpyrrolidone (PVP, Mw = 40![[thin space (1/6-em)]](https://www.rsc.org/images/entities/char_2009.gif) 000), polystyrene (PS, Mw = 350
000), polystyrene (PS, Mw = 350![[thin space (1/6-em)]](https://www.rsc.org/images/entities/char_2009.gif) 000), tetraethylorthosilicate (TEOS, 98%) and glicydoxypropyltrimethoxysilane (GPTMS, 97%) were obtained from Sigma-Aldrich and used without further purification. Poly(methylmetacrylate) resin (PMMA, Degalan™, Mw = 37
000), tetraethylorthosilicate (TEOS, 98%) and glicydoxypropyltrimethoxysilane (GPTMS, 97%) were obtained from Sigma-Aldrich and used without further purification. Poly(methylmetacrylate) resin (PMMA, Degalan™, Mw = 37![[thin space (1/6-em)]](https://www.rsc.org/images/entities/char_2009.gif) 000) was courteously provided by Evonik Industries.
000) was courteously provided by Evonik Industries.
2.2. Synthesis of OA- and MPA-CuInS2/ZnS
The synthetic approach was adopted from earlier reports36,37 and modified to allow for in situ ligand exchange in large quantities. The quantum dots were synthesized in a one-pot non-injection method. In a typical reaction of yellow-emitting QDs, 95 mg CuI (0.5 mmol), 584 mg In(OAc)3 (2 mmol) and 20 mL of DDT were loaded into a 100 mL 3-neck flask and filled with argon. The mixture was then heated to 120 °C to dissolve the molecular precursors. QDs were grown at 230 °C for 5 min to obtain core crystals emitting at ca. 740 nm. The reaction was quenched in an ice bath and the shell precursors were added directly to the core solution without an intermediate purification step: 12.65 g ZnSt2 (20 mmol), 15 mL OA, 10 mL ODE and 4 mL DDT followed by a slow heating to 230 °C and annealing for 2 h at 230 °C under argon. Half of the solution was extracted to obtain the hydrophobic QD fraction (OA-QDs) and 12 mL MPA was injected into the reaction solution to initiate the ligand exchange. The reaction proceeded further at 170 °C. After 60 min the reaction was left to cool down naturally below 100 °C and 20 mL pH 10 buffer solution was injected to separate the MPA-QDs from the organic solvents. The aqueous phase was collected using a separatory funnel, precipitated with acetone and centrifuged. The QDs were washed two more times with buffer/acetone solvent/non-solvent combinations and the particles were finally dispersed in distilled deionized water (DI). Similarly, the hydrophobic quantum dots were repeatedly washed with hexane/methanol and toluene/isopropanol solvent mixtures. The final emission wavelength could be tuned by changing the Cu![[thin space (1/6-em)]](https://www.rsc.org/images/entities/char_2009.gif) :
:![[thin space (1/6-em)]](https://www.rsc.org/images/entities/char_2009.gif) In ratio, i.e. a 1
In ratio, i.e. a 1![[thin space (1/6-em)]](https://www.rsc.org/images/entities/char_2009.gif) :
:![[thin space (1/6-em)]](https://www.rsc.org/images/entities/char_2009.gif) 1 ratio yielded QDs emitting in the NIR. For details on the synthesis temperatures and stoichiometry to obtain various QD emission peaks see ESI.† The reaction yield of the hydrophilic QDs was about 1.2 g (half of the total reaction volume). MPA-QDs emitting in the visible were stable in solution over 12 months of the testing period when stored at 4 °C. Deep red and NIR emitters were stable for up to 5 months.
1 ratio yielded QDs emitting in the NIR. For details on the synthesis temperatures and stoichiometry to obtain various QD emission peaks see ESI.† The reaction yield of the hydrophilic QDs was about 1.2 g (half of the total reaction volume). MPA-QDs emitting in the visible were stable in solution over 12 months of the testing period when stored at 4 °C. Deep red and NIR emitters were stable for up to 5 months.
2.3. Ligand exchange with MUD
60 mg MPA-QDs were dispersed in 3 mL pH 10.2 buffer. In a separate container 180 mg MUD was dissolved in 3 mL methanol. MUD solution was then added dropwise to the QDs under stirring. The turbid solution was stirred for 10 min and then put into an ultrasonic bath for additional 40 min. The MUD-QDs were precipitated by centrifugation and washed 2 times with methanol/toluene mixtures. The precipitate was finally dispersed in ethanol (∼20 mg mL−1) and stored at 4 °C.2.4. Phase transfer with OAm
MPA-QDs were conjugated with OAm to redisperse them in organic solvents. 60 mg MPA-QDs in 3 mL distilled water were mixed with 0.2 mL OAm in 3 mL chloroform and stirred at room temperature for 30 min. The organic phase was then collected and precipitated with ethanol. The OAm-QDs were washed one more time with chloroform/ethanol mixture and finally redispersed in toluene.2.5. Polymer nanocomposites (PNCs)
The hydrophobic polymers (PS and PMMA) were dissolved in toluene and concentrated (50–100 mg mL−1) QDs in toluene were added dropwise to form 5–10% QD/polymer solutions according to dry QD mass. PVP was dissolved directly in aqueous QD solutions to form composites containing 5–20% QDs. The polymer/QD stock solutions were then drop-cast either directly on the LED chips or glass plates and dried at 40 °C over several hours.2.6. Sol–gel nanocomposites
The GPTMS/TEOS sol preparation was adopted from an earlier report.38 First, 55 mL GPTMS (0.25 mol), 56 mL TEOS (0.25 mol) and 6 mL ethanol were mixed together and refluxed under stirring at 80 °C for 30 min. Then 0.7 mL 65% HNO3 and 18 mL water were added dropwise to the alkoxide solution placed in an ice bath. The precursors were then hydrolyzed at 80 °C for 18 h. The molar ratios of TEOS![[thin space (1/6-em)]](https://www.rsc.org/images/entities/char_2009.gif) :
:![[thin space (1/6-em)]](https://www.rsc.org/images/entities/char_2009.gif) GPTMS
GPTMS![[thin space (1/6-em)]](https://www.rsc.org/images/entities/char_2009.gif) :
:![[thin space (1/6-em)]](https://www.rsc.org/images/entities/char_2009.gif) H2O
H2O![[thin space (1/6-em)]](https://www.rsc.org/images/entities/char_2009.gif) :
:![[thin space (1/6-em)]](https://www.rsc.org/images/entities/char_2009.gif) HNO3 were 1
HNO3 were 1![[thin space (1/6-em)]](https://www.rsc.org/images/entities/char_2009.gif) :
:![[thin space (1/6-em)]](https://www.rsc.org/images/entities/char_2009.gif) 1
1![[thin space (1/6-em)]](https://www.rsc.org/images/entities/char_2009.gif) :
:![[thin space (1/6-em)]](https://www.rsc.org/images/entities/char_2009.gif) 4
4![[thin space (1/6-em)]](https://www.rsc.org/images/entities/char_2009.gif) :
:![[thin space (1/6-em)]](https://www.rsc.org/images/entities/char_2009.gif) 0.05. QD solutions of ca. 30 mg mL−1 were added dropwise to a certain amount of sol under vigorous stirring. Samples with MPA-QDs were then subject to ultrasonic treatment for 1 h to produce transparent hybrids. Gelation was induced by addition of 50 μL 2 M NaOH. Gels were dried at 35 °C for a certain amount of time. Hybrids with 1–5% MPA-QDs and 5–30% MUD-QDs were fabricated with a dry thickness of ca. 0.5–3 mm.
0.05. QD solutions of ca. 30 mg mL−1 were added dropwise to a certain amount of sol under vigorous stirring. Samples with MPA-QDs were then subject to ultrasonic treatment for 1 h to produce transparent hybrids. Gelation was induced by addition of 50 μL 2 M NaOH. Gels were dried at 35 °C for a certain amount of time. Hybrids with 1–5% MPA-QDs and 5–30% MUD-QDs were fabricated with a dry thickness of ca. 0.5–3 mm.
2.7. Characterization
UV-Vis spectra were obtained using an Analytik Jena Specord 200 Plus spectrometer. Emission and decay times were measured on a PicoQuant FluoTime300 spectrometer equipped with a 300 W ozone-free Xe lamp, diode lasers with pulse width <80 ps and a R5509-42 NIR-photomultiplier tube. PLQYs were measured via an absolute method on a Hamamatsu Photonics absolute PL quantum yield measurement system (C9920-02) equipped with a 150 W/CW Xenon light source, a photonic multi-channel analyzer, and an integrating sphere and in a relative method with Coumarin 153 (QY = 54.4% (ref. 39)) as a standard. Hydrodynamic diameters and zeta potentials were assessed using a Malvern Zetasizer NanoZS. HRTEM measurements were conducted on a Zeiss LIBRA 200 FE at an accelerating voltage of 200 kV. XRD patterns were obtained on a Rigaku Mini Flex II Desktop diffractometer (λCuKα = 1.5406 Å). FTIR measurements were done on a Perkin Elmer spectrum 100 on pressed KBr pellets with ca. 1![[thin space (1/6-em)]](https://www.rsc.org/images/entities/char_2009.gif) :
:![[thin space (1/6-em)]](https://www.rsc.org/images/entities/char_2009.gif) 200 (w/w) QDs to KBr. An Ocean Optics USB4000 spectrometer corrected for the spectral sensitivity and coupled with an integrating sphere was utilized to assess the properties of LED down-converters (See Fig. S1 in ESI†). LED colour quality was assessed by the CIE (Commission Internationale de L'Eclairage 1931) colorimetry system using Color Calculator software (ver. 5.37, OSRAM Sylvania). FE-SEM pictures were taken with a Zeiss-LEO 982 Gemini at 3 kV.
200 (w/w) QDs to KBr. An Ocean Optics USB4000 spectrometer corrected for the spectral sensitivity and coupled with an integrating sphere was utilized to assess the properties of LED down-converters (See Fig. S1 in ESI†). LED colour quality was assessed by the CIE (Commission Internationale de L'Eclairage 1931) colorimetry system using Color Calculator software (ver. 5.37, OSRAM Sylvania). FE-SEM pictures were taken with a Zeiss-LEO 982 Gemini at 3 kV.
3. Results and discussion
High quality CIS/ZnS quantum dots were synthesized through a facile and scalable one-pot non-injection method. Up to 2.4 g MPA-capped CIS/ZnS QDs could be obtained using only 60 mL organic solvents, which were then simply separated from the aqueous QD phase via density differences (phase separation) eliminating the need for tedious purification processes involving toxic organic solvents. Electronic absorption and PL emission spectra taken for the hydrophilic QDs are depicted in Fig. 1. The first excitonic transition is screened by particle size broadening, and was determined according to the literature.40,41 The relatively large polydispersity is typical for non-injection syntheses and can be partially attributed to a continuous decomposition of DDT providing a steady flux of sulfur ions throughout the reaction33 and more nucleation events as compared to “burst nucleation” ascribed to hot-injection methods42 leading to compositional inhomogeneity between QDs. Optical band gaps were between 2.52 and 1.95 eV indicating strongly quantum confined QDs. Synthesizing aqueous dots emitting deeper in the NIR was difficult due to their strong tendency to agglomerate. Large Stokes shifts of ca. 50–100 nm and broad-band emission spectra with 90–150 nm FWHM are particularly appealing for LED down-conversion layers limiting reabsorption between adjacent QDs and allowing for high quality white light emission easier than with narrow band emitters. PL decay times for OA-QDs and MPA-QDs did not differ significantly and amounted to 311 ns and 380 ns for OA-capped and MPA-capped QDs (see Fig. S2 in ESI†) being in the range typically reported for alloyed ternary nanocrystals.43 Slightly higher lifetimes of ligand-exchanged QDs probably arose due to the presence of small local agglomerates in MPA-QDs appearing during prolonged storage.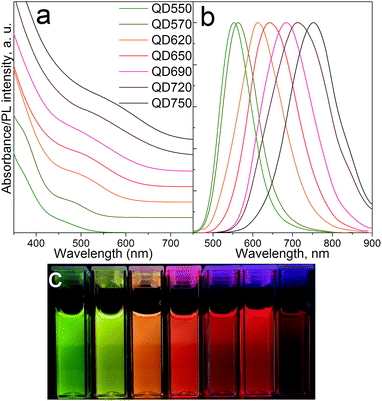 | ||
| Fig. 1 (a) Electronic absorption and (b) photoluminescence spectra of MPA-QDs; (c) aqueous QDs under UV irradiation at 366 nm. | ||
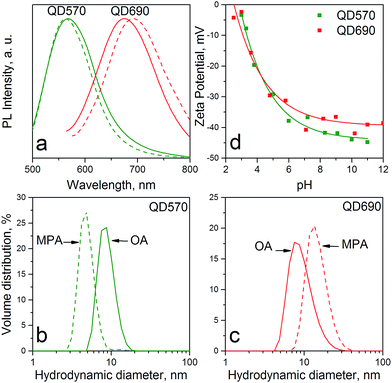
Both the smallest (ca. 5 nm) and the largest (ca. 10 nm) QDs changed their optical properties slightly after hydrophilization as shown in Fig. 2a. A slight blue-shift for the yellow QD PL was a result of size down-narrowing rather than surface etching, which would otherwise be observed in all QD samples regardless of the particle size. However, the red and NIR-emitting QDs exhibited a reverse phenomenon, where hydrophilic samples were ca. 15–20 nm red-shifted with respect to the hydrophobic ones. Because it is impossible to increase the core size after the ZnS shell growth in a zinc-rich environment, the peak shift had to appear due to the formation of local agglomerates between smaller and larger QDs that then act as FRET emitters. This hypothesis is supported by the particle size distribution of hydrophobic and hydrophilic QDs as presented in Fig. 2b and c, respectively. Moreover, larger QDs were more affected by the ligand dynamics with faster ligand desorption as indicated by lower overall surface charge depicted on the zeta potential curves in Fig. 2d. Small, yellow-emitting QDs exhibited higher surface charge and stability than the red ones due to a larger conical volume available for each ligand and hence a more rigid ligand shell.44
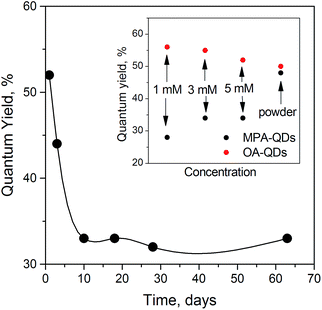
To ensure long-term stability in aqueous solution, the QDs were stored at high concentrations between 0.1 M and 0.25 M. We observed detrimental ligand dynamics effects both at lower and higher concentrations associated with faster ligand desorption and irreversible agglomeration. Some reports suggest that ligand dynamics can positively affect the PL properties28,45 but the effect is most likely temporary and would eventually lead to PL quenching as shown by Wang et al.29 In our case, a decline in PLQY for MPA-QDs at long storage times was observed as presented in Fig. 3. Concentration dependency on the PL QY of OA- and MPA-capped QDs is presented in the inset. Concentration quenching was the obvious reason for the decrease in PLQY for the hydrophobic QDs, but a similar tendency should be observed in the case of hydrophilic ones. However, MPA-QDs showed an opposite trend with the QY increasing with concentration. This fact can be associated with ligand dynamics dominating the PL properties at low concentrations and an equilibrium between inner filler effects and ligand concentration-related PL enhancement reached at higher concentrations. At lower concentrations the amount of free MPA ligands in solution was reduced and hence ligand desorption was accelerated. PL QYs after prolonged storage were ca. 20–35% for hydrophilic and 36–60% for the hydrophobic QDs.
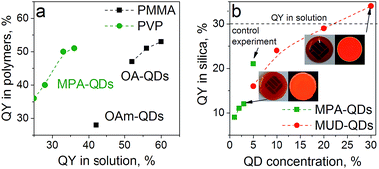
Further surface modification was conducted on the aqueous dots under basic (pH ≥ 10) conditions via simple ligand exchange reactions. Reactions with MUD and OAm were conducted ex situ. Oleylamine is a primary amine that can easily form salt bridges with the carboxylate group of MPA. 11-Mercapto-1-undecanol is a bifunctional thiolate ligand with a hydroxyl group bearing similarity to MPA, which has a shorter chain and a carboxylate terminal group. Optically clear MUD-QD and OAm-QD solutions were obtained simply via agitation. Oleylamine coordinated spontaneously to the carboxylate QD functional groups but FTIR measurements (see Fig. S3 in ESI†) revealed a non-covalent nature of the MPA–OAm bond, which may be broken in an aggressive polymeric environment. Noticeably, MUD-stabilized QDs were insoluble in alcohols higher than ethanol due to incomplete surface coverage – MPA ligands could still be detected on the QD surface using IR spectroscopy. Ex situ ligand exchange procedures conducted on the original hydrophobic QDs were largely unsuccessful and severely impacted the PL properties. Because oleate and stearate ligands are among the strongest capping agents,46 replacing them with thiolate moieties was difficult under mild conditions. MUD-QDs retained the PL properties from before the ligand exchange with no change in the PLQY or emission peak position. Interestingly, OAm-functionalized QDs featured their QY enhanced by one third with respect to the aqueous QDs (Fig. 4). This observation along with greatly increased emission efficiency from MPA-QD powders proves that the aqueous phase transfer has no lasting negative effect on the PLQY. Ligand dynamics rather than surface oxidation are responsible for PL quenching. It means that MPA ligand desorption and subsequent PL signal deterioration is photoinduced and occurred during the measurement or storage under ambient light. An additional OAm ligand shell successfully suppressed the mobility of MPA ligands bound to the crystalline surface. Because both MPA and OAm are soluble in toluene, ligand dynamics is strongly solvent dependent and is much more pronounced the higher the solvent's polarity. Hence, the QYs were much higher for MPA-OAm QD dispersions in toluene than aqueous MPA- or ethanolic MUD-QD dispersions.
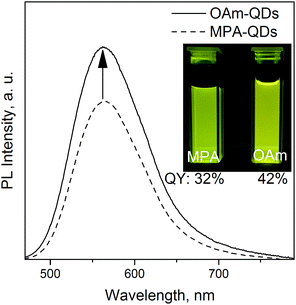 | ||
| Fig. 4 Emission spectra for QD570 before and after phase transfer from polar back to non-polar environment, inset: MPA- and OAm-QDs with the same optical density at 366 nm under a UV lamp. | ||
Oleic acid (OA), mercaptopropionic acid (MPA), Oleylamine (OAm) and 11-mercapto-1-undecanol (MUD) capped QDs were used to prepare color converter layers with polymers and sol–gel silica. Poly(vinylpyrrolidone) (PVP) was chosen as a model hydrophilic polymer due to excellent miscibility with MPA-QDs. Low molecular weight poly(methyl metacrylate) (PMMA) and high molecular weight polystyrene (PS) were used to immobilize the hydrophobic QDs. GPTMS-TEOS hybrid matrix was employed for MUD- and MPA-QDs. Transparent nanocomposites were obtained with up to 10% QD loading in polymers and up to 3% and 30% in silica hybrids for water- and alcohol-soluble QDs, respectively. PLQY for the nanocomposites compared with QYs in solution are presented in Fig. 5. Despite large differences in QYs in solution, the values obtained in hydrophobic and hydrophilic polymers are similar proving that ligand dynamics is dominating the PL properties only in diluted solutions and that aqueous ligand-exchanged QDs are on par with hydrophobic QDs for most optical applications. The weak QY in PMMA with OAm capping means that the amine-carboxylate salt bridges were too weak to maintain a rigid ligand shell in a polymeric matrix. Slightly lower emission efficiency for the hydrophobic QDs in PMMA than in solution can be attributed to non-radiative fluorescence resonance energy transfer (FRET) between tightly packed QDs or their agglomerates.47
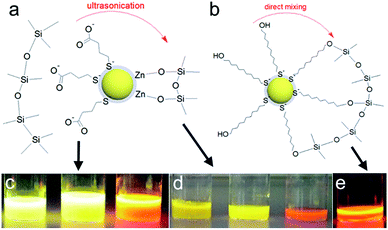
In the sol–gel matrix PLQYs were strongly dependent on the QD concentration and the type of ligand with only 30% QD-containing composite reaching the QY measured from solution. The same QDs emitted with over 50% efficiency in PVP. It is a known fact that TEOS can replace the original ligands on the nanoparticle surface leading to surface reconstruction and ultimately causing emission quenching.48,49 The extent of PL quenching related to surface damage was much more prominent for aqueous dots. Initially the MPA-QDs were insoluble in the GPTMS/TEOS sol and became transparent only after prolonged ultrasonication. MUD-QDs immediately produced transparent solutions upon mixing with the sol. Due to the incompatibility of MPA with alkoxide precursors and a relatively weak thiolate ligand binding strength with the QD surface, the original ligands were most likely cleaved off and replaced with TEOS during sonication as proposed in Fig. 6a. Hydroxyl terminal groups on the other hand, could bind directly to the alkoxide matrix as presented in Fig. 6b. Visual inspection of the as-prepared sols confirms this hypothesis. The sols with MPA-QDs before and after sonication are depicted in Fig. 6c and d showing a decrease in emission intensity after sonication, whereas MUD-QDs remained unaffected by the alkoxides (Fig. 6e). The extent of surface damage in aqueous dots was comparable for QD series emitting in the visible. Sols with hydroxyl-terminated QDs did not exhibit such properties. Some PL quenching sites could be introduced into MUD-QDs as well due to incomplete MPA to MUD ligand exchange as measured by FTIR. Nevertheless, hydroxyl-terminated QDs retained most of their emission intensity after incorporation into silica. A control experiment was performed by mixing the aqueous dots with GPTMS/TEOS and immediately initiating gelation without the sonication step. The turbid dry gel retained over two thirds of the QY of particles in solution meaning that TEOS can indeed replace the MPA ligands and introduce surface quenching sites mostly during homogenization but also during gel drying. NIR emission of aqueous QDs could not be preserved in the sol–gel matrix presumably due to a thinner and less rigid ZnS shell coating protecting the luminescent core.
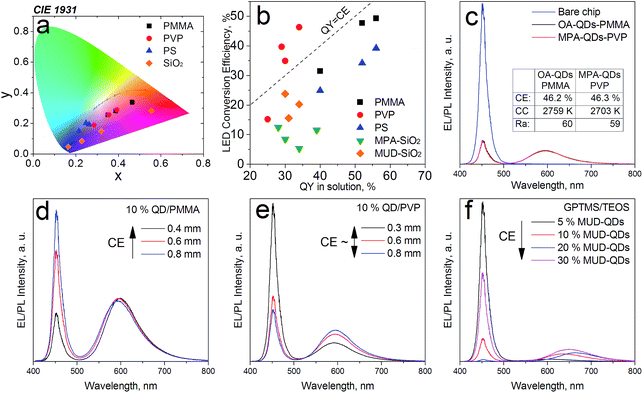
The down-converter layers were then measured for their LED conversion efficiencies (CEs) on a blue SMD LED operated at 20 mA. The optimal QD concentration in polymers was found to be 10% at ca. 500 μm layer thickness for maximal QD-LED brightness and sufficient blue photon scavenging. Such converters were transparent minimizing efficiency losses from multiple scattering within the layer (Fig. S5 in ESI†). The QD-LED chromaticity coordinates and their conversion efficiencies (CEs) are presented in Fig. 7a and b, respectively. It becomes evident that despite much lower PLQYs in solution, the CEs are comparable for both hydrophobic and hydrophilic QDs. Analogous LEDs with MPA- and OA-QDs with matching x, y coordinates also delivered similar efficiencies (Fig. 7c). Best down-converters obtained with MPA- and OA-QDs had CEs of 46.3% and 49.3%, respectively. Additionally, in PMMA the CEs were inversely proportional to the percentage of blue photon absorption meaning that the thicker the converter layer was, the lower CEs were obtained (Fig. 7d). No such trend was observed for MPA-QDs in PVP (Fig. 7e) proving excellent blend quality without EL signal attenuation from multiple scattering within the down-converter. The trend was observed for visible converters only, deep red and NIR-emitting MPA-QDs exhibited CEs lower than their PLQYs in solution, presumably due to a larger degree of agglomeration in polymers and lower stability overall. Polystyrene down-converters featured slightly decreased efficiencies due to lower blend quality resulting from a worse QD dispersion in the high molecular weight polymer. Sol–gel layers were generally less efficient due to surface damage induced by TEOS and the difficulty in controlling their actual thickness resulting in increased reabsorption within the converter. Unlike in polymers, higher luminescent filler loading resulted in enhanced conversion efficiencies in the GPTMS/TEOS gels (Fig. 7f). Most likely, QDs were overcoated with silica and, as proven before, the thickness of the silica shell itself plays a major role in the PL quenching of the sol–gel composites.50 Obviously, at higher QD loadings the silica coating would be relatively thinner. FE-SEM investigations (see Fig. S6 in ESI†) revealed large, ca. 50 nm in diameter silica spheres in the gels with aqueous QDs, whereas no spherical or other features could be distinguished in gels containing the hydroxyl-terminated QDs, which means that in the latter case, silica particles were smaller than ca. 20 nm. The differences in gel morphologies can be explained by the large excess of water added along with the aqueous QDs and prolonged ultrasonication changing the gelation kinetics.51 Sols not treated by sonication were 50–100% more efficient than sonicated ones even despites being completely opaque.
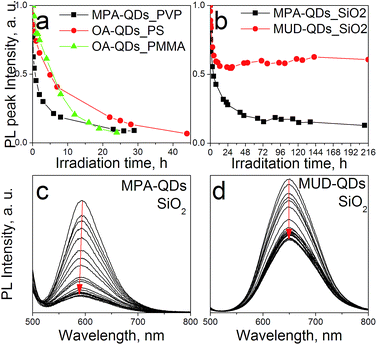
The stability of down-converter layers were assessed using a blue HP LED array operated at 3 W to simulate LED emission lifetime under accelerated conditions (higher photon fluxes) over 9 days testing period. PL peak intensity changes over time for polymeric and silica composites are depicted in Fig. 8a. QDs embedded in polymers showed degradation within 24 h, which may prove insufficient even at low driving currents to match the lifetime of the LED chip itself. PS matrix yielded better results due to a higher glass transition temperature Tg = 95 °C, as compared to 85 °C for low molecular weight PMMA, and hence better thermal stability. The even more rapid drop in PL intensity observed for PVP layers could be attributed to its hygroscopic properties and the resultant QD surface damage by water molecules at high photon fluxes. Sol–gel layers in comparison, showed remarkably improved stability over the whole testing period although with initial degradation taking place. The gel containing aqueous QDs featured a blue-shift in emission with increasing irradiation time (Fig. 8b) indicating etching of the luminescent core and therefore a decrease in the apparent core size. Such a degradation pathway suggests photooxidation in the presence of oxygen molecules, as described previously.52 Photooxidation can take place under anaerobic conditions under high photon fluxes as well but without the accompanying blue-shift in emission.53 We suggest that degradation of the silica down-converters with aqueous QDs is due to oxygen present in the silicate precursors assuming that QDs are shielded from the environment owing to thick silica shells. Because the ligand coating was destroyed in MPA-QD gels, oxidation was accelerated due to the lack of barrier between the luminescent material and the matrix. Similar emission blue-shift was observed also for QDs embedded into PMMA (see Fig. S7 in ESI†), which possesses a high oxygen transmission rate. Polymer layers should be protected by an additional oxygen barrier of i.e. silica to be able to withstand long term LED illumination. Hydroxyl-terminated QDs were more resistant towards photobleaching because ligands formed a more rigid organic shell impermeable towards oxygen molecules. Also MUD ligands can bind directly with the matrix providing better encapsulation. Initial degradation of MUD-QDs may be due to incomplete MPA to MUD ligand exchange. A rigid hydroxyl-terminated ligand coating was obtained elsewhere after several surface exchange procedures including pyridine surface cleaning.54
4. Conclusions
In this report, we presented the synthesis, surface modification and application of CIS QDs for LED down-converters. We demonstrated that with further optimization of the ligand shells and through refining the ligand exchange procedures, cost-effective QD-LEDs can become a viable alternative to the existing bulk phosphors. Ligand dynamics were found to dominate the aqueous QD properties at low concentrations but the original emission efficiency of the hydrophobic dots was recovered in solid matrices and under LED illumination. The highest LED conversion efficiencies were 46.3% and 49.3% in hydrophilic PVP and hydrophobic PMMA matrix, respectively. On the one hand silica color converters were less efficient than polymeric layers, but on the other hand rigid ligand shells and compatibility with the inorganic matrix efficiently shielded the luminescent material from oxygen-induced degradation. As a result, the stability of QD emission under high photon fluxes was remarkably improved. Optimized ligand exchange procedures should increase the stability even further.Acknowledgements
This research was supported by a grant from the German Federal Ministry of Higher Education (FH ProfUnt 03FH028PX3). The authors gratefully acknowledge the help of Prof. Helmut Kohl and Michael Entrup (Muenster University) for performing the HRTEM measurements and Dr Lydia Lammers and Holger Uphoff (Muenster University of Applied Sciences) for FE-SEM investigations.References
- D. Graham-Rowe, Nat. Photonics, 2009, 3, 307 CrossRef CAS.
- H. V. Demir, S. Nizamoglu, T. Erdem, E. Mutlugun, N. Gaponik and A. Eychmüller, Nano Today, 2011, 6, 632 CrossRef CAS.
- C.-C. Tu, Q. Zhang, L. Y. Lin and G. Cao, Opt. Express, 2012, 20, A69 CrossRef CAS PubMed.
- H. S. Jang, H. Y. Kim, Y.-S. Kim, H. M. Lee and D. Y. Jeon, Opt. Express, 2012, 20, 2761 CrossRef CAS PubMed.
- P. Schlotter, R. Schmidt and J. Schneider, Appl. Phys. A: Mater. Sci. Process., 1997, 64, 417 CrossRef CAS.
- H. S. Jang, Y. H. Won and D. Y. Jeon, Appl. Phys. B: Lasers Opt., 2009, 95, 715 CrossRef CAS.
- M. Nyman, L. E. Shea-Rohwer, J. E. Martin and P. Provencio, Chem. Mater., 2009, 21, 1536 CrossRef CAS.
- K. Uheda, N. Hirosaki and H. Yamamoto, Phys. Status Solidi A, 2006, 203, 2712 CrossRef CAS.
- J. Dhanaraj, R. Jagannathan and D. C. Trivedi, J. Mater. Chem., 2003, 13, 1778 RSC.
- I. S. Sohn, S. Unithrattil and W. B. Im, ACS Appl. Mater. Interfaces, 2014, 6, 5744 CAS.
- A. Aboulaich, M. Michalska, R. Schneider, A. Potdevin, J. Deschamps, R. Deloncle, G. Chadeyron and R. Mahiou, ACS Appl. Mater. Interfaces, 2014, 6, 252 CAS.
- C. Shen, J. Chu, F. Qian, X. Zou, C. Zhong, K. Li and S. Jin, J. Mod. Opt., 2012, 59, 1199 CrossRef CAS.
- Q. Dai, C. E. Duty and M. Z. Hu, Small, 2010, 6, 1577 CrossRef CAS PubMed.
- E. Jang, S. Jun, H. Jang, J. Lim, B. Kim and Y. Kim, Adv. Mater., 2010, 22, 3076 CrossRef CAS PubMed.
- X. Wang, W. Li and K. Sun, J. Mater. Chem., 2011, 21, 8558 RSC.
- H. Zhong, Z. Bai and B. Zou, J. Phys. Chem. Lett., 2012, 3, 3167 CrossRef CAS PubMed.
- W. Chung, H. Jung, C. H. Lee and S. H. Kim, J. Mater. Chem. C, 2014, 2, 4227 RSC.
- X. Yuan, R. Ma, W. Zhang, J. Hua, X. Meng, X. Zhong, J. Zhang, J. Zhao and H. Li, ACS Appl. Mater. Interfaces, 2015, 7, 8659 CAS.
- L. Qu and X. Peng, J. Am. Chem. Soc., 2002, 124, 2049 CrossRef CAS PubMed.
- F. C. J. M. van Veggel, Chem. Mater., 2014, 26, 111 CrossRef CAS.
- K. Gugula and M. Bredol, Z. Naturforsch., B: J. Chem. Sci., 2014, 69, 217 CAS.
- V. Lesnyak, N. Gaponik and A. Eychmüller, Chem. Soc. Rev., 2013, 42, 2905 RSC.
- Y. Chen, S. Li, L. Huang and D. Pan, Nanoscale, 2014, 6, 1295 RSC.
- X. Kang, L. Huang, Y. Yang and D. Pan, J. Phys. Chem. C, 2015, 119, 7933 CAS.
- H. Bao, Y. Gong, Z. Li and M. Gao, Chem. Mater., 2004, 16, 3853 CrossRef CAS.
- S. F. Wuister, C. de Mello Donegá and A. Meijerink, J. Phys. Chem. B, 2004, 108, 17393 CrossRef CAS.
- D. R. Baker and P. V. Kamat, Langmuir, 2010, 26, 11272 CrossRef CAS PubMed.
- D. Zhou, H. Zou, M. Liu, K. Zhang, Y. Sheng, J. Cui, H. Zhang and B. Yang, ACS Appl. Mater. Interfaces, 2015, 7, 15830 CAS.
- C. Wang, H. Zhang, J. Zhang, N. Lv, M. Li, H. Sun and B. Yang, J. Phys. Chem. C, 2008, 112, 6330 CAS.
- S. Jeong, M. Achermann, J. Nanda, S. Ivanov, V. I. Klimov and J. A. Hollingsworth, J. Am. Chem. Soc., 2005, 127, 10126 CrossRef CAS PubMed.
- H. Kim, J. Y. Han, D. S. Kang, S. W. Kim, D. S. Jang, M. Suh, A. Kirakosyan and D. Y. Jeon, J. Cryst. Growth, 2011, 326, 90 CrossRef CAS.
- L. E. Shea-Rohwer, J. E. Martin, X. Cai and D. F. Kelley, ECS J. Solid State Sci. Technol., 2013, 2, R3112 CrossRef CAS.
- P. Sang-Yul, K. Hyo-Sun, Y. Jeseung, K. Suyong, S. Tae Joo, K. Kyungnam, J. Sohee and S. Young-Soo, Nanotechnology, 2015, 26, 275602 CrossRef PubMed.
- J. Eun-Pyo, S. Woo-Seuk, L. Ki-Heon and Y. Heesun, Nanotechnology, 2013, 24, 045607 CrossRef PubMed.
- W.-S. Song, J.-H. Kim and H. Yang, Mater. Lett., 2013, 111, 104 CrossRef CAS.
- L. Li, A. Pandey, D. J. Werder, B. P. Khanal, J. M. Pietryga and V. I. Klimov, J. Am. Chem. Soc., 2011, 133, 1176 CrossRef CAS PubMed.
- Y.-K. Kim, S.-H. Ahn, G.-C. Choi, K. Chung, Y.-S. Cho and C.-J. Choi, Trans. Electr. Electron. Mater., 2011, 12, 218 CrossRef.
- L. D. S. Alencar, V. Pilla, A. A. Andrade, D. A. Donatti, D. R. Vollet and F. S. De Vicente, Chem. Phys. Lett., 2014, 599, 63 CrossRef CAS.
- K. Rurack and M. Spieles, Anal. Chem., 2011, 83, 1232 CrossRef CAS PubMed.
- M. Booth, A. P. Brown, S. D. Evans and K. Critchley, Chem. Mater., 2012, 24, 2064 CrossRef CAS.
- L. Qin, D. Li, Z. Zhang, K. Wang, H. Ding, R. Xie and W. Yang, Nanoscale, 2012, 4, 6360 RSC.
- C. B. Murray, C. R. Kagan and M. G. Bawendi, Annu. Rev. Mater. Sci., 2000, 30, 545 CrossRef CAS.
- W. Zhang and X. Zhong, Inorg. Chem., 2011, 50, 4065 CrossRef CAS PubMed.
- A. J. Morris-Cohen, M. Malicki, M. D. Peterson, J. W. J. Slavin and E. A. Weiss, Chem. Mater., 2013, 25, 1155 CrossRef CAS.
- Y. He, L.-M. Sai, H.-T. Lu, M. Hu, W.-Y. Lai, Q.-L. Fan, L.-H. Wang and W. Huang, Chem. Mater., 2007, 19, 359 CrossRef CAS.
- F. Knittel, E. Gravel, E. Cassette, T. Pons, F. Pillon, B. Dubertret and E. Doris, Nano Lett., 2013, 13, 5075 CrossRef CAS PubMed.
- M. Lunz, A. L. Bradley, V. A. Gerard, S. J. Byrne, Y. K. Gun'ko, V. Lesnyak and N. Gaponik, Phys. Rev. B: Condens. Matter Mater. Phys., 2011, 83, 115423 CrossRef.
- R. Koole, M. M. van Schooneveld, J. Hilhorst, C. de Mello Donegá, D. C. Hart, A. van Blaaderen, D. Vanmaekelbergh and A. Meijerink, Chem. Mater., 2008, 20, 2503 CrossRef CAS.
- P. Yang, M. Ando and N. Murase, Langmuir, 2011, 27, 9535 CrossRef CAS PubMed.
- H. Yang, P. H. Holloway and S. Santra, J. Chem. Phys., 2004, 121, 7421 CrossRef CAS PubMed.
- J. C. Pouxviel, J. P. Boilot, J. C. Beloeil and J. Y. Lallemand, J. Non-Cryst. Solids, 1987, 89, 345 CrossRef CAS.
- W. G. J. H. M. van Sark, P. L. T. M. Frederix, D. J. Van den Heuvel, H. C. Gerritsen, A. A. Bol, J. N. J. van Lingen, C. de Mello Donegá and A. Meijerink, J. Phys. Chem. B, 2001, 105, 8281 CrossRef CAS.
- W. G. J. H. M. van Sark, P. L. T. M. Frederix, A. A. Bol, H. C. Gerritsen and A. Meijerink, ChemPhysChem, 2002, 3, 871 CrossRef CAS.
- S. Jun, J. Lee and E. Jang, ACS Nano, 2013, 7, 1472 CrossRef CAS PubMed.
Footnote |
| † Electronic supplementary information (ESI) available: FTIR spectra of the surface engineered QDs, decay times of OA- and MPA-QDs, XRD and HRTEM results, transmittance spectra of the hydrophilic QDs, SEM pictures of the silica hybrids, emission spectra of QDs embedded in PS, PMMA and PVP during HP LED illumination. See DOI: 10.1039/c5ra26331j |
| This journal is © The Royal Society of Chemistry 2016 |

