Artificial extracellular matrix delivers TGFb1 regulating myofibroblast differentiation

Weilu Chengab, Ruodan Xub, Dalong Liab, Christian Bortolinib, Jinmei Hea, Mingdong Dongb, Flemming Besenbacherb, Yudong Huang*a and Menglin Chen*b
aSchool of Chemical Engineering and Technology, State Key Laboratory of Urban Water Resource and Environment, Harbin Institute of Technology, Harbin, 150001, China. E-mail: ydhuang.hit1@aliyun.com; Fax: +86-451-8622-1048; Tel: +86-451-8641-4806
bInterdisciplinary Nanoscience Center (iNANO), Aarhus University, DK-8000, Aarhus C, Denmark. E-mail: Menglin@inano.au.dk; Tel: +45-87155859

Received 10th December 2015 , Accepted 11th February 2016

First published on 15th February 2016


Abstract

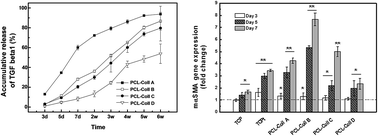
During wound healing, the contractile activity of myofibroblasts differentiated from fibroblasts in active transforming growth factor β1 (TGFβ1) conditions has vital functions. In wound dressing biomaterials, it is crucial to mimic the extracellular matrix to deliver the right amount of TGFβ1 in a spatiotemporally controlled manner. We report here, for the first time, a zero-order, sustained TGFβ1 release from electrospun biomimetic nanofibers realizing optimal cell viability and myofibroblast differentiation capacity, confirmed by cell metabolic activity CCK assay, gene expression level through real-time PCR and protein expression level through immunochemical staining.

1. Introduction

After accidental exterior injury or surgical operation, wound healing and tissue repair of an open wound mainly depend on two major phenomena, epithelialization and contraction of granulation tissue.1–3 The latter is essential for maintaining tissue continuity and reducing the size of the wound.2,4 Upon contraction, adjacent fibroblasts quickly transform to myofibroblasts which are characterized by the presence of stress fibers, α smooth muscle actin (αSMA), as hallmark.5,6 Particularly, fibroblast-to-myofibroblast differentiation represents a key event during wound contraction, which is reciprocally influenced by mechanical stress and transforming growth factor beta (TGFβ) signaling.7,8 In particular, the cytokine TGFβ1 is considered as a direct inducer of the transition from fibroblasts to myofibroblasts, which results in smad2 and smad3 activation,6,9 translocation of the smad complex into the nucleus and up-regulation of αSMA expression.10,11 Lee et al.12 reported that myofibroblast-like cells significantly contracted collagen gel matrix in vitro only when the fibroblasts were stimulated with a moderate concentration of TGFβ1 for a short period of time. Otherwise, there would be a perpetual fibrosis, which could further lead to fibrotic diseases.10,13 Therefore, delivery of TGFβ1 in a temporally controlled manner is beneficial for proper wound healing.

Recent strategies in regenerative medicine focus on making extracellular matrix (ECM) mimicking scaffolds to spatially and temporally control the availability of bioactives for regulating cellular functions.14–16 Electrospinning is a versatile polymer nanofabrication technique that enables facile production of bioactive-incorporated, submicron fabric scaffolds that share similar dimensions and functions with the ECM. Representative polymers that have been widely fabricated into fibers include synthetic polyesters such as polylactic acid (PLA),17 polyglycolic acid (PGA),18 poly(lactic-co-glycolic acid) (PLGA),19 polycaprolactone (PCL),20 and natural polymers such as gelatin,21 silk,22 chitosan23 and collagen.24 Collagen, a major structural protein of the ECM, has been widely used in many medical applications, such as wound dressing,25,26 skin regeneration27,28 and drug delivery.29

In contrast to systemically delivered drugs, drug delivery systems in tissue engineering strategies act as depots of drugs localized to treatment sites, which can increase drug effectiveness while reducing side effects and conferring protection to labile drugs.30 Here, PCL/Coll electrospun fibers delivering TGFβ1 were used as an artificial ECM for regulating myofibroblast differentiation. Mechanisms of the spatiotemporal control of the release were investigated. By tuning PCL/Coll blending ratios and determining the TGFβ1 release, the effects of the delivered TGFβ1 on NIH3T3 fibroblast viability, proliferation and differentiation were optimized in vitro using colorimetric cell metabolic activity CCK assay, real-time PCR and immunostaining.

2. Experimental

2.1 Materials

Polycaprolactone (PCL) (Mw = 80[thin space (1/6-em)]000), hexafluoroisopropanol (HFIP) were purchased from Sigma-Aldrich. Type I collagen (Coll) was prepared from bovine tendons in our laboratory.31 The experiment was carried out in accordance with the approved guideline in Animal Experiments Inspectorate, China. All the chemicals in the work were used without further purification.

2.2 Electrospinning

First, PCL and Coll were each dissolved at a concentration of 10% (w/w) in HFIP at room temperature (RT), and stirred for 6 h until homogeneous PCL solution and Coll solution formed. Second, different ratios of PCL and Coll solutions were blended. Third, TGFβ1 was added to the mixed solutions to reach either 10−3% (w/w, high concentration) or 10−4% (w/w, low concentration). Different PCL/Coll blend fibers were fabricated by electrospinning: PCL/Coll A (33.3%/66.7%, w/w), PCL/Coll B (40%/60%, w/w), PCL/Coll C (50%/50%, w/w) and PCL/Coll D (66.7%/33.3%, w/w). The detailed electrospinning process followed these conditions: applied voltage, 20 kV; feeding rate, 1 ml h−1; deposition time, 3 h; distance between the tip of needle and collector, 10 cm; relative humidity, 20–35%; RT. The obtained fibers were lastly freeze-dried overnight and stored at −20 °C.

2.3 Scanning electron microscopy

The surface morphologies of the electrospun fibers were characterized by scanning electron microscopy (SEM) (FEI, Nova 600 NanoSEM) with a low vacuum detector. The fibers were placed directly into the SEM chamber without any metal sputtering or coating; all the images were captured using a secondary electron detector with an acceleration voltage of 5 kV.

2.4 Infrared (IR) spectroscopy

Infrared (IR) spectra of the electrospun PCL/Coll blend fibers were obtained by using a VERTEX 70v vacuum FTIR spectrometer (Bruker Optics Inc., Billerica, MA, USA). FT-IR spectra were recorded at 4 cm−1 resolution, at room temperature and in vacuum (pressure of 2 mbar). Samples were directly placed on the metal sample holder without the need of supporting materials or IR windows (e.g. KBr, CaF2). The wavenumber range was from 400 to 4000 cm−1 (2.5 μm to 25 μm).

2.5 Differential scanning calorimetry

The thermal behavior of the polymer fibers was analyzed using a differential scanning calorimeter (Pyris 6 DSC). Approximately 10 mg of each sample were placed in aluminum pans under a nitrogen atmosphere, heated to 150 °C, cooled to −100 °C, and then heated to 350 °C. Thermograms were recorded at a rate of 10 °C min−1.

2.6 Contact angle measurements

3 μl water was dropped on the surfaces of the fibers at RT, and the contact angles (CAs) were recorded in continuous shooting mode with intervals of 5 ps−1 up to 30 s by means of a Kr[greek upsilon with two dots above]ss drop shape analysis system DSA 100. All analyses were done in triplicate.

2.7 TGFβ1 release

The 100 mg fibers were cut into pieces and submerged in 500 μl of phosphate buffered saline (PBS, pH 7.4) and kept at 37 °C in humidified conditions for day 3, day 5, week 1, week 2, week 3, week 4, week 5 and week 6, respectively. The quantitative sandwich enzyme immunoassay technique (Quantikine Mouse TGFβ1 enzyme linked immunosorbent assay kit, R&D Systems, USA) was used to determine the tiny amount of TGFβ1 release from the fibers. Briefly, 50 μl of the standards, control and activated samples were pipetted into the wells and incubated for 2 h at RT. After washing away any unbound substances, an enzyme linked polyclonal antibody specific for TGFβ1 was added to the wells to couple with the TGFβ1 immobilized during the first incubation. After washing again to remove any unbound antibody enzyme reagent, a substrate solution was added to the wells and incubated for 30 min in the dark at RT. After adding the stop solution, the absorbance of each well was determined at 450 nm within 30 min, using a microplate reader (VICTOR X5 Perkin-Elmer, USA).

2.8 Cell culture

The mouse fibroblast NIH3T3 cell line (ATCC, USA) was expanded in a growth medium of DMEM–Glutamax (GIBCO, Grand Island, NY) supplemented with 10% bovine calf serum (BioWhittaker, Walkersville, MD) and 1% penicillin/streptomycin (Gibco, Grand Island, NY) at 37 °C in a humidified atmosphere of 5% CO2. The NIH3T3 cells were passaged every 7 days. Passage 131–133 were used.

The fibers were punched into circular pieces with diameter of 12 mm and weight of ∼8 mg; then, the fibers were sterilized for 30 min under a 245 nm UV lamp, and placed on the bottom of a 48-well plate. Cells were seeded on each fiber or tissue culture plastic (TCP) at a density of 5 × 10³ cells per well and treated with growth medium for 24 h. All cells on fibers and the negative control on TCP (TCP) were cultured with growth medium (DMEM–Glutamax supplemented with 5% bovine calf serum, 1% penicillin/streptomycin) from day 2 to day 7. The positive control on TCP (TCPt) was cultured with differentiation medium (DMEM–Glutamax supplemented with 5% bovine calf serum, 1% penicillin/streptomycin and 10 ng ml−1 TGFβ1).

2.9 Cell viability assay

The cell viability was determined after 3, 5, and 7 days of culturing using a cell counting kit (CCK-8, Dojindo, Japan). The CCK-8 reagent was diluted 1/20 with the cell culture medium. 300 μl of the mixture was pipetted into each well; after 2 h culture, 100 μl of the mixture was transferred into a 96-well plate, and the absorbance was determined at 450 nm. Each experiment was performed in six replicate wells and independently repeated three times.

2.10 RNA isolation and real-time PCR

The effects of TGFβ1 loaded into different ratios of PCL/Coll blend fibers on NIH3T3 cell gene expression were measured at day 3, day 5 and day 7. Total RNA was isolated from cells using TRIzol reagent (Invitrogen Life technologies, USA), according to the manufacturer’s protocol. The RNA was quantified at 260 nm using a Nanodrop spectrophotometer (IMPLE AH Diagnostics, Helsinki, Finland). 0.8 μg RNA was reverse transcribed to cDNA at 37 °C for 60 min using high capacity RNA to cDNA kit (Applied Biosystems, Foster City, CA), according to the protocol of the supplier. Aliquots of each cDNA were frozen (−20 °C) until the PCR reactions were carried out. Real-time PCR was performed in the Lightcycler 480® (Roche Diagnostics, Mannheim, Germany) using SYBR green detection. Real time RT-PCR was done for the reference gene (m18S rRNA) and two target genes (mFSP1 and mαSMA). The primer sequences were as follows: m18S-F: 5′-GTAACCCGTTGAACCCCATT-3′, 18S-R: 5′-CCATCCAATCGGTAGTAGCG-3′; mFSP1-F: 5′-GGAGCTGCCTAGCTTCCTG-3′, mFSP1-R: 5′-GCTGTCCAAGTTGCTCATCA-3′; mαSMA-F: 5′-CAGAGTGGAGAAGCCCAGC-3′, mαSMA-R: 5′-CCAACCATTACTCCCTGATGTCT-3′.

Each reaction contained 7 μl Lightcycler 480 SYBR GREEN I Master (containing Fast Start Taq polymerase, reaction buffer, dNTPs mix, SYBR Green I dye, MgCl2 and antisense primers) and 3 μl of the cDNA dilution in a total volume of 10 μl. The amplification program consisted of a pre-incubation step for denaturation of the template cDNA (10 min 95 °C), followed by 45 cycles consisting of a denaturation step (10 s 95 °C), an annealing step (10 s 60 °C) and an extension step (10 s 72 °C). After each cycle, fluorescence was measured at 72 °C (λex = 470 nm, λem = 530 nm). Fold differences were calculated using the standard ΔΔCt method with m18S as the housekeeping gene. The amount of internal reference gene relative to calibrator (fold change between two Ct values) is given by the equation:

Fold difference = 2−ΔΔCt

2.11 Immunostaining and fluorescence microscopy

Cell morphology was visualized at day 3, day 5 and day 7 using a Zeiss LSM 700 laser confocal microscope (Carl Zeiss Micro-Imaging GmbH, Germany). Cells adhered to the fibers and TCP were fixed with 4% paraformaldehyde (PFA) in PBS (pH 7.4) for 15 min at RT. For staining, the cells were permeabilized in 0.5% (v/v) Triton in PBS (pH 7.4), then blocked with 1% BSA in PBS for 1 h at RT. Immunostaining with primary antibodies mouse monoclonal αSMA (Abcam, Cambridge, UK) in PBS (1/500) was performed at 4 °C overnight, and Alexa Fluor 594 conjugated donkey anti mouse IgG secondary antibody (Life technologies, CA) in 3% BSA/PBS (1/800) was performed at RT in the dark for 1 h. The cytoskeletons of the cells were stained using Phalloidin Atto 488 (Sigma Aldrich, Schnelldorf, Germany) in PBS (1/200) and the nuclei with Hoechst 33258 (Life technologies, CA) in PBS (1/5000).

2.12 Statistical analysis

For graphs and text, values are presented as mean ± standard error. For comparison of two groups, a student’s t-test with a p-value of 0.05 was used to measure statistical significance. For more than one comparison, a one-way ANOVA was performed followed by Dunnett’s post hoc test.

3. Results and discussion

3.1 Fabrication and characterization of PCL/Coll electrospun fibers

As seen in Fig. 1, 100% Coll has poor spinnability, while the 100% PCL fibers were homogeneous with a diameter of 0.78 ± 0.54 μm. When PCL was blended with Coll, the obtained fiber morphology varied and the diameters of the fibers decreased when the PCL component increased: PCL/Coll A (33.3%/66.7%, w/w) fibers with diameter 1.67 ± 0.72 μm were not uniform; PCL/Coll B (40%/60%, w/w) fibers with diameter 1.49 ± 0.87 μm; PCL/Coll C (50%/50%, w/w) fibers with diameter 1.19 ± 0.38 μm; PCL/Coll D (66.7%/33.3%, w/w) fibers with diameter 1.08 ± 0.44 μm were straight, uniform and continuous solid fibers. The diameter distributions of all the fibers are summarized in a histogram. The tiny amount of TGFβ1 had no effect on the morphology of the electrospun fibers, compared to the fibers without the TGFβ1.
image file: c5ra26164c-f1.tif
Fig. 1 SEM images of the electrospun PCL/Coll blend fibers loaded with TGFβ1 and the fiber diameter distribution histogram, scale bar, 10 μm.

Fourier transform infrared spectroscopy (FT-IR) was applied to analyze PCL/Coll chemical composition. Fig. 2 presents the FT-IR spectra of PCL/Coll fibers, with wavelength ranging from 1800 to 1000 cm−1. As shown in Fig. 2a, it is possible to distinguish the typical absorption bands from both PCL and Coll: the strong C–O stretching band (1170 cm−1), the C–O–C stretching vibration (1048 cm−1, 1105 cm−1 and 1220 cm−1) and the strong carboxylic acid absorption (1730 cm−1) originated from PCL; the amide bands (1525 cm−1 amide II, 1650 cm−1 amide I) are characterized from Coll. Fig. 2b details the three bands from carboxylic and amide groups: an increasing amount of PCL together with a decreasing amount of Coll corresponds to an augmentation of the carboxylic absorption and a decrease of the amide I and II absorption signals.


image file: c5ra26164c-f2.tif
Fig. 2 FT-IR spectra of electrospun PCL/collagen blend fibers. The PCL/Coll ratio varies from sample A to sample D: the content of PCL is increasing while the content of collagen is decreasing. (a) Stacked FT-IR spectra showing different PCL/Coll blends: PCL/Coll A (blue line), PCL/Coll B (black line), PCL/Coll C (green line) and PCL/Coll D (red line). (b) Detailed superimposed FT-IR spectra: the three main absorption bands are highlighted (carboxylic acid at 1730 cm−1, amide bands at 1650 and 1525 cm−1 respectively).

The miscibility of blends of PCL and Coll was established on the basis of differential scanning calorimetry (DSC) analysis (Fig. 3). It shows that the endothermic denaturation of collagen occurred at around 215 °C, which is generally observed in literature32 for pure freeze-dried collagen, and pure PCL gave an endothermic peak at around 56 °C, which corresponds to its melting point (Tm). All four PCL/Coll blends prepared by electrospinning from their solution in HFIP possessed a single endotherm around the Tm of PCL. Thus, PCL and Coll were miscible in the amorphous state in HFIP at all compositions and no phase separation occurred during the solidification process in the electrospinning step.


image file: c5ra26164c-f3.tif
Fig. 3 DSC measurements of PCL/Coll blend fibers compared to pure PCL and Coll fibers.

The macroscopic wettability of the fibers, determined by the interaction between the delivery matrix and aqueous media, was characterized by CA measurements. As seen in Fig. 4, the PCL/Coll fibers had moderate CA values compared to 100% PCL and 100% Coll, which embodied hydrophobic and hydrophilic properties, respectively. The increase of the Coll component resulted in improved hydrophilicity.


image file: c5ra26164c-f4.tif
Fig. 4 Contact angle (CA) measurements of PCL/Coll blend fibers compared to pure PCL and Coll fibers. The average CA values were obtained from measurements at six different positions on the same fibers.

3.2 Release of TGFβ1 in vitro

Drug release is a dynamic process involving physical/chemical interactions among the drug, the delivery matrix and delivery media/environment (such as water molecules).
Ci/∂t = D2Ci − ∇Civ + Ri

The above equation30 represents how the concentration of a drug changes over time as a function of its diffusion, convection and chemical reactions. Ci is the concentration of drug i, t is time, D is the diffusivity of the drug through the carrier, v is the volume-averaged velocity, and Ri accounts for chemical reactions (such as drug/carrier degradation, or drug–vehicle affinity interactions). In the absence of flow, which is the case here, the convection term is zero.

The temporal release of TGFβ1 in PBS at 37 °C was determined using ELISA. As shown in Fig. 5a, 100% Coll fibers cannot withstand water and the fast wetting of Coll and consequent drug–matrix dissociation resulted in a 69.94% burst TGFβ1 release in the beginning 8 h, followed by a further 5.68% release up to the seventh day. As a degradation-controlled system, the chemical-reaction term dominates, with drug being released following carrier breakdown in the beginning burst release phase. Meanwhile, TGFβ1 binding to Coll retards the drug from freely diffusing from the carrier, which explains the sustained slow release phase.


image file: c5ra26164c-f5.tif
Fig. 5 The cumulative release of TGFβ1 from 100% Coll fibers and 100% PCL fibers (a) and different PCL/Coll ratio fibers (b) after incubation in PBS at 37 °C up to 7 days or six weeks. Values represent mean ± SD (n = 6 for each time point).

On the other hand, only 7.82% was slowly released from the 100% PCL fibers during the first week, due to the slow diffusion process in the highly hydrophobic PCL matrix. Diffusion control occurs here, as the timescale of diffusion is longer than that of drug–carrier dissociation (low affinity between PCL and TGFβ1), yet shorter than that of material degradation (hydrolytic degradation of PCL is very slow). Steric interactions and the tortuosity of the release path control the release kinetics.

When Coll was blended with PCL, the release profile of TGFβ1 was sensitively regulated by the change of the blending ratio (Fig. 5b). The Coll dominant PCL/Coll A fibers demonstrated an initial burst release of 60.01% in the first week, and then 33.73% sustained release from the second week to the sixth week. While for the PCL dominant PCL/Coll D fibers, there started a negligible release of 0.93% on day 3, followed by a slow release up to 2 weeks, due to the slow wetting process, prior to a burst release between week 2 and week 4. Cumulatively 52.86% TGFβ1 was released up to the sixth week. As both diffusion and matrix degradation controlled, both PCL/Coll B and PCL/Coll C demonstrated a nearly zero-order release profile where 86.63% and 79.68% were released up to six weeks, respectively.

3.3 Cell viability

CCK-8, a colorimetric assay based on tetrazolium dye reduction, was used to monitor the relative numbers of viable cells after 3 days, 5 days and 7 days of cell culture. TGFβ proteins are pleiotropic cytokines that regulate extracellular matrix production, wound healing, cell proliferation and differentiation.

As shown in Fig. 6a, all the cells proliferated during the 7 days’ culture, while the cells in the TGFβ1 conditioned TCPt group demonstrated higher growth speed than those on TCP. Remarkably, the relatively low loading of TGFβ1 (1 ng mg−1) in the Coll L fibers significantly stimulated NIH3T3 fibroblast growth. While with a 10 times higher loading of TGFβ1 (10 ng mg−1) in the Coll H fibers, cell proliferation was inhibited, indicating the high concentration of TGFβ1 has induced certain cytotoxicity. Thus the TGFβ1 loading density of 1 ng mg−1 was applied for the PCL/Coll fiber groups.


image file: c5ra26164c-f6.tif
Fig. 6 Cell proliferation on TCPs, pure Coll fibers loaded with different concentrations of TGFβ1 (a) and PCL/Coll blend fibers loaded with 1 ng mg−1 TGFβ1 (b) measured by CCK-8. Data were expressed as percentage of each group at day 1, respectively. Statistical significances between corresponding groups and time points are denoted as *p < 0.05, **p < 0.005.

As shown in Fig. 6b, PCL/Coll A fibers induced a marked proliferation at day 5 followed by a regression, in accordance with its burst release of TGFβ1 in the first week. Among the groups, the cells on PCL/Coll B demonstrated a steady and significant increase in proliferation compared with both other PCL/Coll groups and the TCPt positive control.

3.4 Differentiation of NIH3T3 fibroblasts in vitro

The fibroblasts respond to TGFβ1 stimulation rapidly and differentiate towards myofibroblasts. In particular, myofibroblasts show the neoexpression of αSMA, which has become the hallmark of myofibroblasts. Using RT-PCR, the gene expression of myofibroblastic marker αSMA and fibroblastic marker, fibroblast specific protein 1 (FSP1), were quantitatively measured and the data were summarized as fold changes in comparison to the undifferentiated NIH3T3 fibroblasts grown on TCP at day 3 (*p < 0.05, **p < 0.005).

Overall, the mαSMA expression dramatically increased (Fig. 7a); meanwhile the mFSP1 expression was gradually down-regulated Fig. 7b upon TGFβ1 stimulation, either in the TGFβ1 conditioned TCPt positive control group, or in all TGFβ1 loaded PCL/Coll fiber groups. After 7 days’ culture, mαSMA gene expression was significantly up-regulated on PCL/Coll B (7.67 fold increase), compared to PCL/Coll A (4.25 fold increase), PCL/Coll C (4.99 fold increase), PCL/Coll D (2.34 fold increase), and TCPt (3.43 fold increase).


image file: c5ra26164c-f7.tif
Fig. 7 RT-PCR gene expression was measured using myofibroblast marker mαSMA (a) and NIH3T3 fibroblast marker mFSP1 (b) on day 3, day 5 and day 7. The statistical significances between the corresponding groups and time points are denoted as *p < 0.05, **p < 0.005. Immunofluorescence analysis of the myofibroblast marker αSMA (red) after culturing on TCP (without TGFβ1), TCPt (with 10 ng ml−1 TGFβ1) and different PCL/Coll fibers loaded with TGFβ1 (1 ng mg−1) for 3 days (c–h), 5 days (i–n) and 7 days (o–t), respectively. Nuclei were stained with Hoechst (blue); cell cytoskeletons were stained with Phalloidin Atto 488 (green). Scale bar = 50 μm.

The cell morphology changes and protein marker expression during the differentiation process were qualitatively evaluated using immunostaining, where we stained the nuclei with Hoechst (blue), the actin filament with phalloidin (green), the myofibroblast marker with first antibody (mouse αSMA) and second antibody (red). The immunofluorescence images showed the progress of differentiation from fibroblasts to myofibroblasts on various samples (Fig. 7c–t). No significant αSMA expression was observed on the first three days (Fig. 7c–h). On day 5, compared to cells cultured on the negative control TCP (Fig. 7i), small quantities of αSMA were found both from the TCPt (Fig. 7j) and PCL/Coll B fibers (Fig. 7l). After 7 days’ culture, abundant αSMA was expressed from the cells on TCPt (Fig. 7p), PCL/Coll A (Fig. 7q) and PCL/Coll B fibers (Fig. 7r); however, only the cells on TCP (Fig. 7o) and PCL/Coll B fibers (Fig. 7r) presented normal and healthy morphology. Consist with RT-PCR data, cells on PCL/Coll B fibers demonstrated the optimal myofibroblast differentiation.

4. Conclusions

In this study, NIH3T3 fibroblasts were directed to differentiate towards myofibroblasts effectively on TGFβ1 loaded polycaprolactone (PCL)/collagen (Coll) electrospun fibers. The release profile of TGFβ1 was tuned by varying the ratio of hydrophobic PCL and hydrophilic Coll. Among all the fibers, TGFβ1 loaded PCL/Coll B (40%/60%, w/w) with a nearly zero-order release profile demonstrated the optimal cell viability and myofibroblast differentiation capacity, confirmed by a metabolic activity CCK assay, gene expression and immunofluorescence imaging. The proper delivery of TGFβ1 in a spatiotemporally controlled manner from an ECM mimicking scaffold holds great potential for proper wound healing.

Acknowledgements

We gratefully acknowledge the funding for project ElectroMed (11-115313) from the Danish council for strategic research, and Aarhus University Research Foundation, the China Scholarship Council, Weihai Science and Technology Development Plan Project (2013GNS028) and Carlsberg Foundation for the financial support.

Notes and references

  1. J. V. Jester, W. M. Petroll and H. D. Cavanagh, Prog. Retinal Eye Res., 1999, 18, 311–356 CrossRef CAS.
  2. J. L. Balestrini, S. Chaudhry, V. Sarrazy, A. Koehler and B. Hinz, Integr. Biol., 2012, 4, 410 RSC.
  3. E. Fuchs, J. Cell Biol., 1994, 124, 511–516 Search PubMed.
  4. A. Desmoulière, C. Chaponnier and G. Gabbiani, Wound Repair Regener., 2005, 13, 7–12 CrossRef PubMed.
  5. V. S. LeBleu, G. Taduri, J. O’Connell, Y. Teng, V. G. Cooke, C. Woda, H. Sugimoto and R. Kalluri, Nat. Med., 2013, 19, 1047–1053 CrossRef CAS PubMed.
  6. S. K. Masur, H. S. Dewal, T. T. Dinh, I. Erenburg and S. Petridou, Proc. Natl. Acad. Sci. U. S. A., 1996, 93, 4219–4223 CrossRef CAS.
  7. T. M. Freyman, I. V. Yannas, R. Yokoo and L. J. Gibson, Exp. Cell Res., 2002, 272, 153–162 CrossRef CAS PubMed.
  8. G. Gabbiani, J. Pathol., 2003, 200, 500–503 CrossRef CAS PubMed.
  9. M. B. Vaughan, E. W. Howard and J. J. Tomasek, Exp. Cell Res., 2000, 257, 180–189 CrossRef CAS PubMed.
  10. Y. Kono, T. Nishiuma, Y. Nishimura, Y. Kotani, T. Okada, S.-I. Nakamura and M. Yokoyama, Am. J. Respir. Cell Mol. Biol., 2007, 37, 395–404 CrossRef CAS PubMed.
  11. L. Yang, N. Chang, X. Liu, Z. Han, T. Zhu, C. Li, L. Yang and L. Li, Am. J. Pathol., 2012, 181, 85–97 CrossRef CAS PubMed.
  12. C. H. Lee, B. Shah, E. K. Moioli and J. J. Mao, J. Clin. Invest., 2010, 120, 3340–3349 CAS.
  13. R. A. Evans, Y. C. Tian, R. Steadman and A. O. Phillips, Exp. Cell Res., 2003, 282, 90–100 CrossRef CAS PubMed.
  14. J. M. Holzwarth and P. X. Ma, J. Mater. Chem., 2011, 21, 10243 RSC.
  15. D. Poncelet, P. de Vos, N. Suter and S. N. Jayasinghe, Adv. Healthcare Mater., 2012, 1, 27–34 CrossRef CAS PubMed.
  16. E. Ehler and S. N. Jayasinghe, Analyst, 2014, 139, 4449–4452 RSC.
  17. S. Shao, S. Zhou, L. Li, J. Li, C. Luo, J. Wang, X. Li and J. Weng, Biomaterials, 2011, 32, 2821–2833 CrossRef CAS PubMed.
  18. K. E. Park, H. K. Kang, S. J. Lee, B. M. Min and W. H. Park, Biomacromolecules, 2006, 7, 635–643 CrossRef CAS PubMed.
  19. M. Chen, S. Gao, M. Dong, J. Song, C. Yang, K. A. Howard, J. Kjems and F. Besenbacher, ACS Nano, 2012, 6, 4835–4844 CrossRef CAS PubMed.
  20. M. Rubert, J. Dehli, Y.-F. Li, M. B. Taskin, R. Xu, F. Besenbacher and M. Chen, J. Mater. Chem. B, 2014, 2, 8538–8546 RSC.
  21. S. Panzavolta, M. Gioffrè, M. L. Focarete, C. Gualandi, L. Foroni and A. Bigi, Acta Biomater., 2011, 7, 1702–1709 CrossRef CAS PubMed.
  22. H. Liu, X. Li, G. Zhou, H. Fan and Y. Fan, Biomaterials, 2011, 32, 3784–3793 CrossRef CAS PubMed.
  23. N. Bhattarai, D. Edmondson, O. Veiseh, F. A. Matsen and M. Zhang, Biomaterials, 2005, 26, 6176–6184 CrossRef CAS PubMed.
  24. L. Yang, C. F. C. Fitié, K. O. van der Werf, M. L. Bennink, P. J. Dijkstra and J. Feijen, Biomaterials, 2008, 29, 955–962 CrossRef CAS PubMed.
  25. J. P. Chen, G. Y. Chang and J. K. Chen, Colloids Surf., A, 2008, 313–314, 183–188 CrossRef.
  26. K. Kodaira, T. Miyata, M. Furuse and Y. Noishiki, Artif. Organs, 1988, 12, 452–453 Search PubMed.
  27. M. Trojanowska, E. C. LeRoy, B. Eckes and T. Krieg, J. Mol. Med., 1998, 76, 266–274 CrossRef CAS PubMed.
  28. H. M. Powell, D. M. Supp and S. T. Boyce, Biomaterials, 2008, 29, 834–843 CrossRef CAS PubMed.
  29. W. Friess, Eur. J. Pharm. Biopharm., 1998, 45, 113–136 CrossRef CAS PubMed.
  30. C. J. Kearney and D. J. Mooney, Nat. Mater., 2013, 12, 1004–1017 CrossRef CAS PubMed.
  31. D. Li, J. He, W. Cheng, Y. Wu, Z. Hu, H. Tian and Y. Huang, J. Mater. Chem. B, 2014, 2, 6089 RSC.
  32. V. Samouillan, F. Delaunay, J. Dandurand, N. Merbahi, J.-P. Gardou, M. Yousfi, A. Gandaglia, M. Spina and C. Lacabanne, J. Funct. Biomater., 2011, 2(3), 230–248 CrossRef CAS PubMed.

This journal is © The Royal Society of Chemistry 2016