DOI:
10.1039/C5RA26128G
(Paper)
RSC Adv., 2016,
6, 22476-22487
Molecular dynamics studying on welding behavior in thermosetting polymers due to bond exchange reactions
Received
8th December 2015
, Accepted 15th February 2016
First published on 16th February 2016
Abstract
Covalent adaptable network (or dynamic covalent network) polymers can alternate their network topology through bond exchange reactions, whereby an active atom replaces an atom in an existing bond, resulting in a new bond and a new active atom. This process repeats itself numerous times in the network, bestowing interesting material behaviors, such as stress relaxation, surface welding, self-healing and recycling, upon the network. In this paper, molecular dynamics simulations are used to investigate surface welding due to bond exchange reactions in an epoxy system. Two epoxy networks are constructed and brought into contact, and bond exchange reactions are then activated. The trajectory of active atoms is tracked, which shows how the active atoms cross the interface. Based on simulation results, this work analyzes the influence of welding conditions, such as welding time, welding temperature, degree of polymerization and crosslinking density of original networks, on the mechanical properties of welded materials. These parameters determine the number of connected bonds on the interface, which consequently affects the welding performance. Eventually, with a sufficiently long welding time, the system can fully recover the same modulus and yielding stress as those of a fresh network. Finally, the active atoms' penetration depth, obtained from MD simulation, shows good agreement with the predictions of some existing theories.
1. Introduction
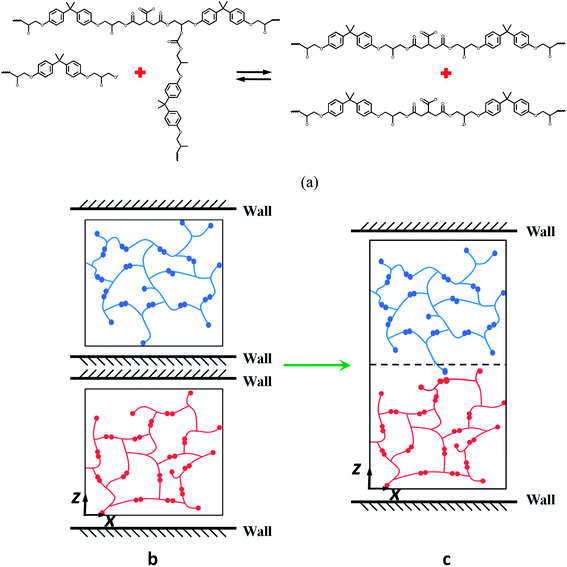
Thermosetting polymers are ideal candidates for various structural or composite applications1 due to their stable thermomechanical properties at high temperatures and their excellent resistance to environmental attacks, such as heat, chemicals, UV irradiation, etc.2 However, reforming and recycling these materials is inherently difficult because of their permanently cross-linked networks. Recently, controllable and reversible bond structures have been incorporated into thermosetting networks to render covalent adaptable networks (CANs) (also known as dynamic covalent networks (DCNs)). Such polymers combine the desirable attributes of conventional thermosets with malleability and recyclability.3–8 CANs are classified into two types, where the dynamic structures are achieved either by reversible depolymerization with equilibrium shifting, as in the classic Diels–Alder (DA) reaction,9–13 or through the recently developed bond exchange reactions (BERs). No matter which mechanism is chosen, CANs exhibit two features not found in traditional thermosetting polymers: malleability resulting from significant stress relaxation,14–16 and surface welding.15,17 To further illustrate the process of BER-based surface welding effect, we drew a schematic graph as shown in Fig. 1. An active unit crosses the interface (Fig. 1a) and attaches to an existing bond on the other side of the interface (Fig. 1b); this leads to the release of an active unit and a newly formed bond. The new active unit continues to repeat the reaction (Fig. 1c), and polymer chains gradually accumulate and weld the interface.
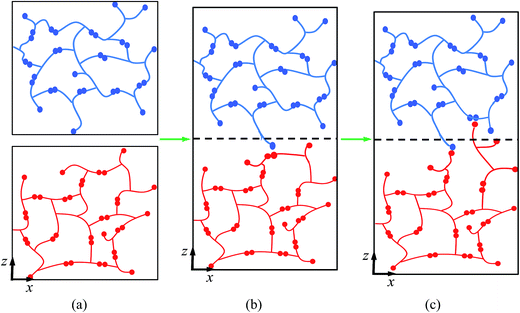 |
| | Fig. 1 Schematic graphs of surface welding due to bond exchange reactions. (a) Two networks with active atoms; (b) an active atom crosses the interface and reacts with an existing bond on the other side of the interface; (c) the newly formed units continue to react with other existing bonds. | |
The surface welding effect in CANs enables self-healing, reprocessing and recycling of thermosetting polymer.18–22 For example, Chen et al.13 described a remendable material capable of multiple cycles of crack healing using a DA reaction. This method does not need additional ingredients such as catalysts, monomers or special treatment of the fracture interface. Amamoto et al.19 investigated a light sensitive CAN based on an addition–fragmentation chain transfer. Photo-induced self-healing was achieved where the BERs occur upon exposure to light in the presence of a radical-based photo-initiator. Recently, Leibler and his co-workers15 introduced thermal sensitive CAN epoxy that employs transesterification type BERs, which can be easily controlled by temperature. Such a polymer system does not require additional monomers or radical generators, and enables complete reprocessing and recycling of the thermosetting network.23
While the plastic flow and stress relaxation in CANs have been intensively studied recently,6,24,25 our understanding of the surface welding effect is still limited. Previously, Stukalin et al.17 studied welding kinetics by using a scaling theory. There, the diffusion of polymer chains across the interface is correlated with their pervaded volume during the Rouse-type motion, which is subsequently used to scale the interfacial chain density and network penetration. A similar approach is employed in the recent work of Yu et al. (Yu et al., 2015), where the crosslinking feature of CANs is generalized into a lattice geometry. The diffusivity of polymer chains is based on the BER kinetics, and an explicit expression of chain density evolution is derived. In these theoretical studies, a general conclusion is that the surface welding in CANs is a diffusion driven process. The welding efficiency can be directly related with the BER kinetics, and hence depends on the processing conditions, such as welding time and temperature.
The macromolecular level details can be further illustrated by molecular dynamics (MD) simulations. For example, Ge et al.26 investigated the entanglement and inter-diffusion of polymer chains across the interface during the welding of thermoplastics. For bond exchange reactions (BERs), Rottach et al.27 used MD simulations to investigate stress relaxation of sequential crosslinking and scission of polymer networks. However, their method was a coarse-grained approach with spring-bead models that ignore detailed macromolecular structures. In addition, their work focused mainly on stress relaxation. To account for the detailed macromolecular structures of CANs with BERs, we recently developed a new MD simulation approach for the epoxy system by Leibler and his coworkers,15 where the transesterification reaction was used as the exchange reaction.28 Our MD simulations in the bulk material confirmed the diffusion nature of BER in the crosslinked network. In this paper, we study the surface welding behavior of thermally activated CANs by using the MD simulation method developed in our previous work, with the goal of describing how the active atoms cross the interface via BERs and of understanding how different processing conditions can affect the efficiency of surface welding. The material chosen is the epoxy network. We use our previous simulation method to construct two epoxy networks with a small gap between them; then we allow BERs to cross the interface to weld the two surfaces. After welding, we compare the mechanical properties of the welded materials with those of the fresh sample. In addition, systems with different degree of crosslinking, crosslink density, and welding temperatures are built to investigate their influences on the welding efficiency. Finally, the number of connected interfacial bonds and the penetration depths of polymer chains across the interface in the MD simulations are compared with those predicted by existing theoretical works.
2. Simulation details
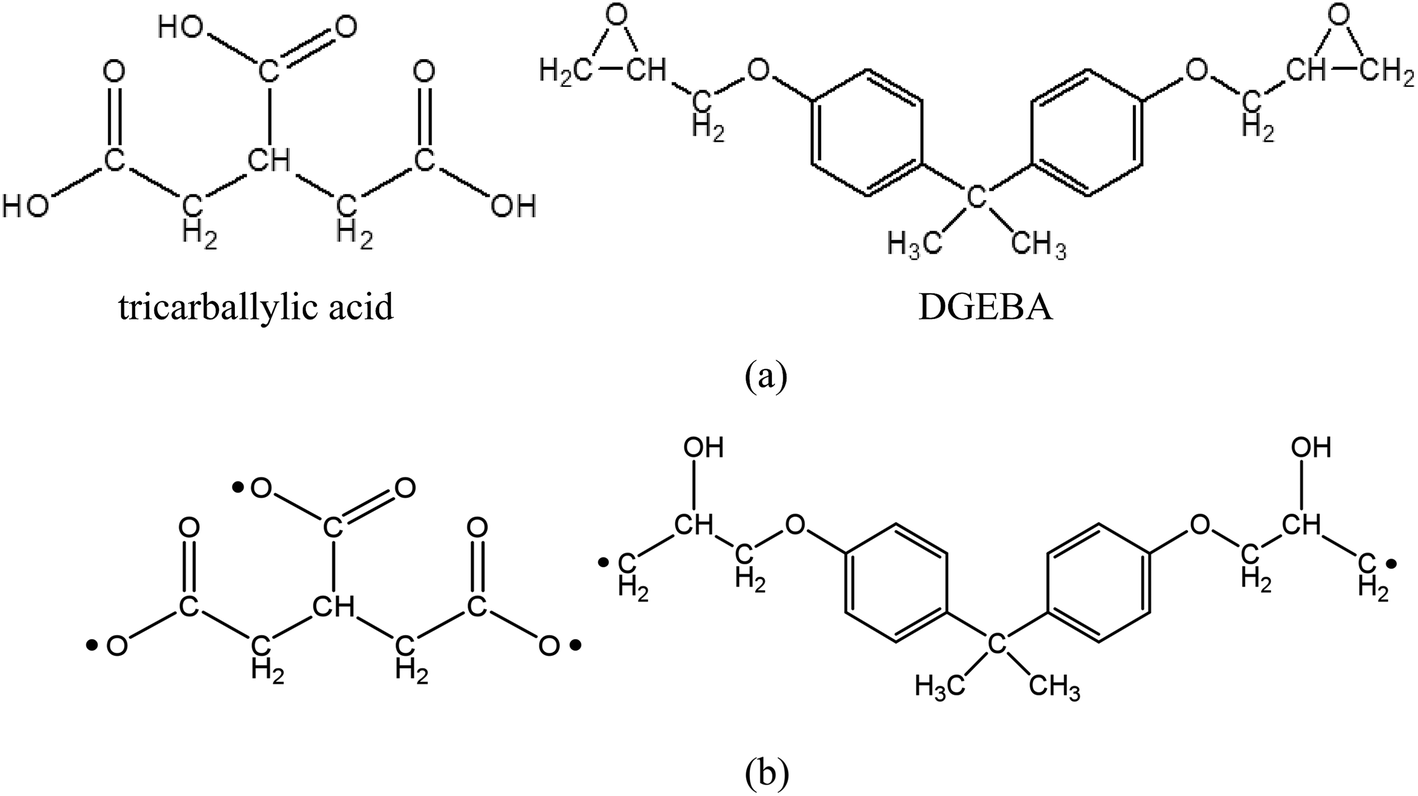
Before the simulation of surface welding, two epoxy networks with exchangeable bonds are built, with diglycidyl ether of bisphenol A (DGEBA) as the monomer and tricarballylic acid as the crosslinking agent. They will respectively provide ester and hydroxyl groups for bond exchanging in transesterification reactions. The molecular structures are shown in Fig. 2. All the simulations are performed using PCFF forcefield29 and LAMMPS MD software30 as provided by Sandia National Laboratories. The Nose–Hoover thermostat and barostat31,32 are used for temperature and pressure control respectively.
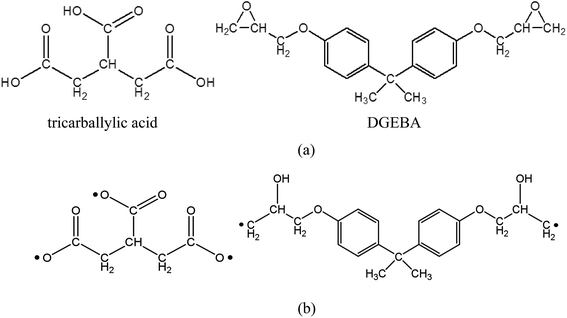 |
| | Fig. 2 (a) Molecular structure of tricarballylic acid and DGEBA (b) activation of tricarballylic acid and epoxy ends for the crosslinking reaction. | |
Each network consists of 90 un-crosslinked epoxy resin DGEBA molecules and 60 crosslinking agent tricarballylic acid molecules. The total number of atoms for the two films is 10![[thin space (1/6-em)]](https://www.rsc.org/images/entities/char_2009.gif) 860. The molecular structures are shown in Fig. 2a, where a DGEBA has two active sites, and a tricarballylic acid has three active sites to be crosslinked. The coordinate system is shown in Fig. 1a, where the x-direction is the horizontal direction, z is the vertical direction, and y is the direction point inside of the paper. Periodic boundary conditions are applied along the x- and y-directions. For each film, the z-direction height is maintained at 36 Å using two repulsive confining walls. The structure is first equilibrated at a temperature T = 450 K and the atmosphere pressure. The crosslinking procedure uses the methodology we previously developed,28 which combines the methods by Wu and Xu33 and by Varshney et al.34 Briefly, the distances between two active units are measured in each iteration; any two active atoms whose distance is less than the cutoff distance (4.5 Å) are bonded together; then an energy minimization procedure and an MD procedure are performed to relax the structure. After 32 iterations of the crosslinking simulation, 97.22% percent of the active atoms are crosslinked. The x- and y-directions' dimensions are 42 Å and 46 Å after crosslinking. The glass transition temperature (Tg), which is measured by the change in thermal expansion coefficients through a MD simulation of temperature scan, is 330 K.
860. The molecular structures are shown in Fig. 2a, where a DGEBA has two active sites, and a tricarballylic acid has three active sites to be crosslinked. The coordinate system is shown in Fig. 1a, where the x-direction is the horizontal direction, z is the vertical direction, and y is the direction point inside of the paper. Periodic boundary conditions are applied along the x- and y-directions. For each film, the z-direction height is maintained at 36 Å using two repulsive confining walls. The structure is first equilibrated at a temperature T = 450 K and the atmosphere pressure. The crosslinking procedure uses the methodology we previously developed,28 which combines the methods by Wu and Xu33 and by Varshney et al.34 Briefly, the distances between two active units are measured in each iteration; any two active atoms whose distance is less than the cutoff distance (4.5 Å) are bonded together; then an energy minimization procedure and an MD procedure are performed to relax the structure. After 32 iterations of the crosslinking simulation, 97.22% percent of the active atoms are crosslinked. The x- and y-directions' dimensions are 42 Å and 46 Å after crosslinking. The glass transition temperature (Tg), which is measured by the change in thermal expansion coefficients through a MD simulation of temperature scan, is 330 K.
The BER is the transesterification reaction, which is shown in Fig. 3a. In order to simulate the welding process, a small gap of 1 Å is first created between the two networks by placing two rigid walls (Fig. 3b) when each network is built. Once the crosslinked epoxy systems with a gap of 1 Å are built, transesterification reactions are allowed for bond exchange. We use the same method to simulate the BER process in bulk materials in our previous work.28 If the distance of the active atoms is below the cutoff distance we defined, we connect the active atom to the existing bond; we then check the bond energy in both the new and the old bonds. If the new bond has lower bond energy, the BER occurs. For the simulations that consider temperature effect, an additional Monte-Carlo procedure is taken. Specifically, a probability is calculated based on temperature and is compared with a random number. If the number is smaller than the probability, the BER occurs. After the first BER occurs between the two epoxies, the wall in the middle is removed (Fig. 3c). The total volume is held constant, and 300 BER iterations are performed on the system.
 |
| | Fig. 3 Schematic graphs of the MD simulation of the welding process. (a) The transesterification reaction; (b) the initial model with repulsive walls; (c) the model after the first BER occurs between the two films. | |
3. Simulation results
3.1 Stress relaxation behavior
When the covalent adaptable network is stretched, BERs cause stress relaxation, which is a measurable process that can be used to characterize BERs in both macroscopic material testing as well as MD simulations. We first conduct the stress relaxation simulation to obtain the stress relaxation time due to BERs. Here, a crosslinked system consisting of 10860 atoms is built to investigate the stress relaxation behavior. The Tg of such a system is measured as 334 K. The system is stretched in the z-direction to 30% strain at the temperature of 450 K with the loading rate of 1 × 10⁹ s−1. Then the BER process is performed at 450 K. After each BER iteration, the stress in the z-direction is calculated, as shown in Fig. 4. By using an exponential function for fitting,23 the stress relaxation time is estimated to be 4.2 ns, which is slightly higher than that measured in our previous work. This might be due to the different boundary conditions used. In our previous work, the z-direction periodic boundary condition was used; in the current work, the surface welding consideration rules out the periodic boundary condition in the z-direction.
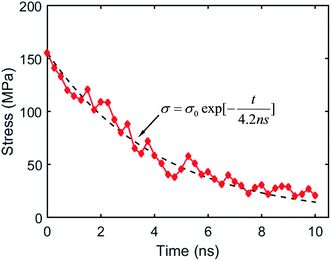 |
| | Fig. 4 Stress relaxation during BER processes at 450 K. | |
3.2 The trajectory of active atoms across the interface during welding
In a BER, an active atom reacts with an existing functional group first, leading to one atom of the functional group being kicked off, resulting in a new functional group and an active atom. Fig. 5 presents the relay of the active atoms during the BER iterations. The active atom (oxygen, purple color) at the end of a chain (blue color) in the upper film approaches a functional group (green color in the red chain) in Fig. 5a, then reacts with it by forming a new connected chain (blue color and red color) and a new chain (red color) with an active atom (Fig. 5b shows atoms at the moment of new bond formation). The tertiary structure in Fig. 5b is not stable and the old bond breaks, releasing a new active atom (oxygen, green, Fig. 5c), which continues to search for another functional group and react with it (cyan pair) in Fig. 5d. Once the red atom forms a new bond with one cyan atom (carbon), another cyan atom (oxygen) is kicked off and becomes active again. This process continues. Because of this relay, the active atoms can cross the interface and make the two films weld together. Fig. 6 shows the trajectories of two BER relays, with the dots representing the positions of the active atoms right after the BER reaction. In Fig. 6, the two networks are plotted in their initial configurations to show the trajectory of active atoms crossing the interface. It can be seen that the movements of active atoms occur in both directions: one BER relay moves from the lower material to the upper material, whereas the other one moves from the upper to the lower one. It should be noted during the BER iterations, the upper and lower materials also slightly penetrate into each other, as shown in Fig. 5. However, as will be shown later, these penetrations do not offer welding, because each material is a crosslinked network.
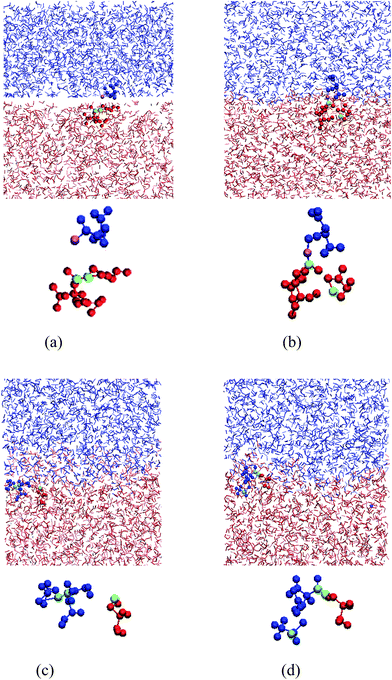 |
| | Fig. 5 The relay of active atoms in BERs: (a) the purple active atom meets a green atom pair (a bond); (b) the purple atom reacts with the green atom pair by creating a new bond with one green atom and releasing the other green atom; (c) the released green atom meets a cyan atom pair; (d) the green atom reacts with the cyan pair by forming a new bond with one cyan atom and releasing the other cyan atom. | |
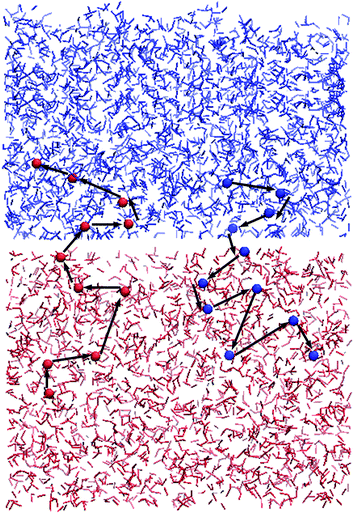 |
| | Fig. 6 The trajectories of active atoms in two BER relays. The dots represent the locations of the active atoms right after the BER reactions. | |
3.3 Bonds that cross the interface
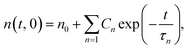
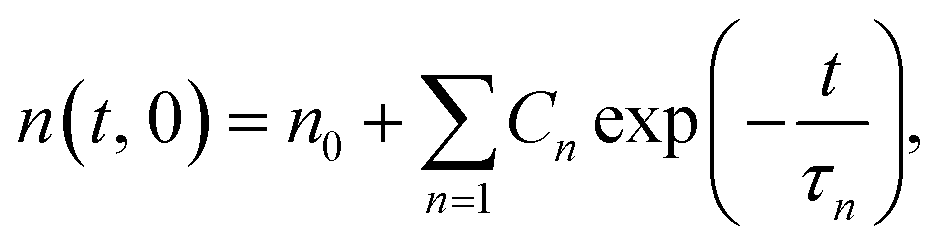
During surface welding, the number of bonds that cross the interface increases with welding time. Yu et al. (2015) recently developed a lattice model to capture the evolution of chain density across the interface, which depended on the BER kinetics in the bulk material. There, N lattice layers with a distance of Δx on each side were considered, and the evolution of normalized chain density on the interface was expressed as:| |
 | (1) |
with  , and
, and  , where N = 2 is the number of lattice layers parallel to the interface. N is determined to be the network thickness in the following MD simulation divided by the size of each lattice, which is comparable to the radius of gyration of polymer chains. n0 is the chain density and is used to normalize the bonds crossing the interface.
  , and τ represents the relaxation time and is taken to be 4.2 ns, as measured by the stress relaxation curve in the MD simulation (Fig. 4). Fig. 7 plots the normalized number of bonds crossing the interface in both the MD simulation and the theoretical prediction. Here, the normalized number of bonds is calculated by using their respective saturation values, and the time is normalized by the stress relaxation time. The consistency between the two curves verifies the effectiveness of the theory of Yu et al. (2015).
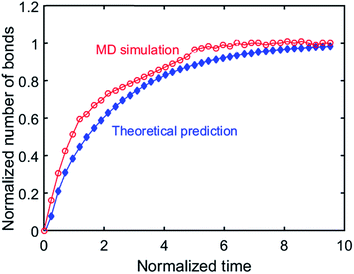 |
| | Fig. 7 Normalized number of bonds cross the interface during BER process. | |
3.4 Mechanical properties during welding process
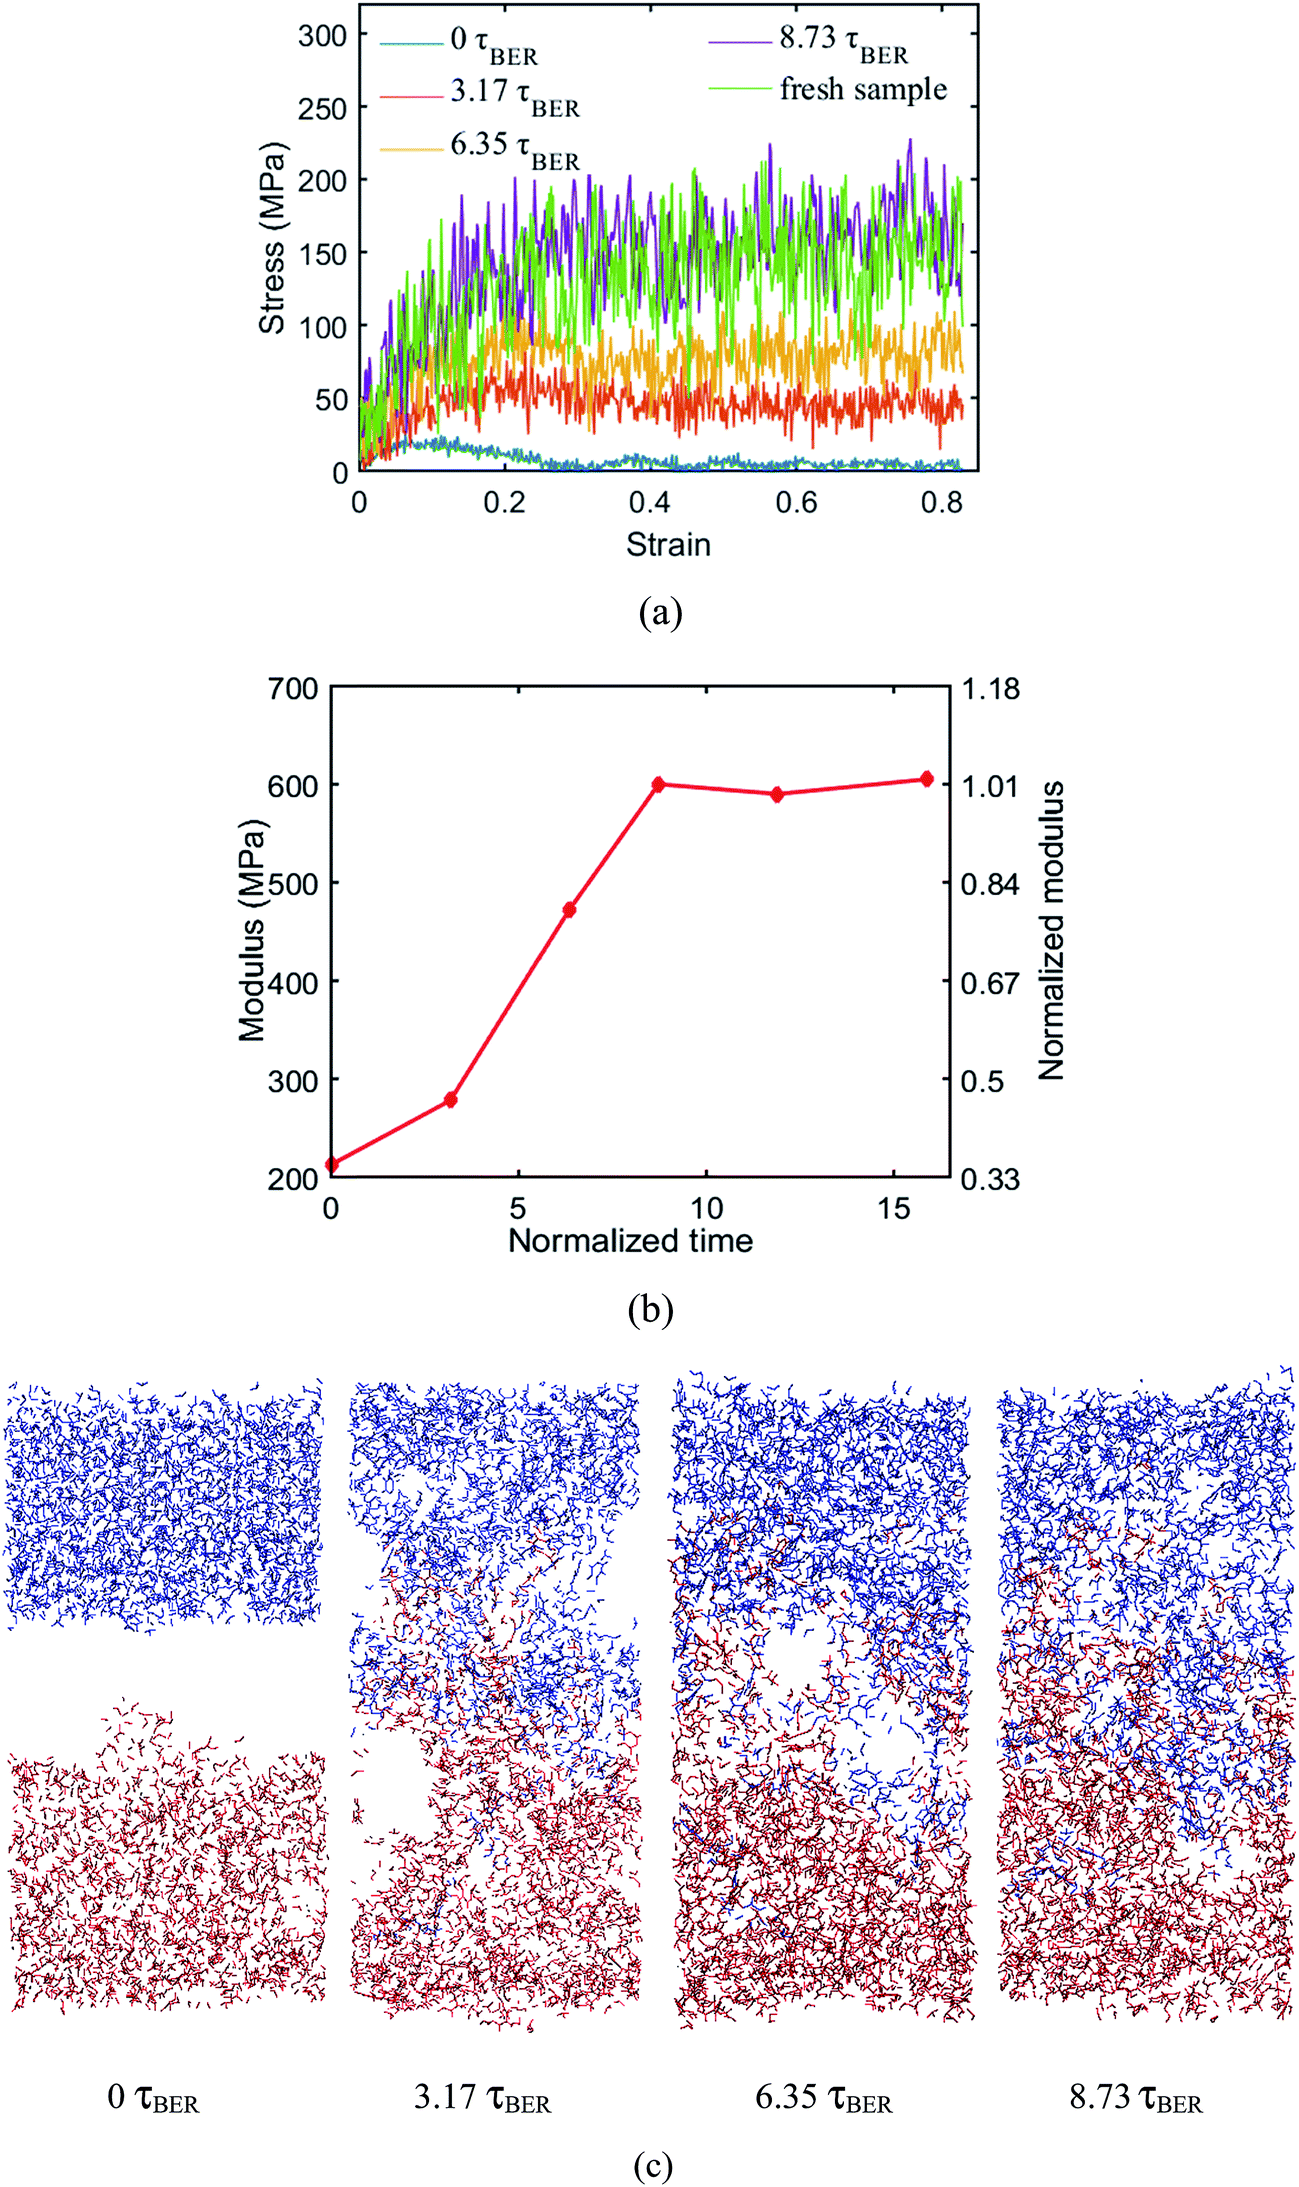
MD simulations are performed at 450 K to examine the uniaxial tension behavior of the fresh epoxy network and the welded network after a given number of BER iterations is finished. During the simulation, the length of the simulation box is continuously stretched along the z-direction. In all the cases, the loading strain rate is 1 × 10⁹ s−1 and the maximum strain is up to 80%. The stress–strain curves are shown in Fig. 8a. Here, we normalize the time by the BER relaxation time τBER; this is based on the definition in our previous work, where τBER is calculated as the average time required for a BER to occur per active unit in the material. In this case, we have 360 active units and there are 2850 BERs in 10 ns. Therefore, τBER = 1.26 ns. At the welding time of 8.73τBER (11 ns with ∼110 iterations of BERs), the stress–strain behavior of the welded network is almost the same as that of the fresh network, which indicates a complete welding between the two films. For the sake of convenience, we refer to such networks as the fully welded networks. Fig. 8b shows the initial Young's modulus as a function of the normalized time (measured from the beginning of BER reactions; the time is normalized by τBER). It can be seen that the modulus of the welded system increases with time. The modulus reaches its maximum value of 600 MPa at ∼8.73τBER. It should be noted that even at 0τBER, when there is no BER in the welding system, the interaction between the two films can still provide some resistance to deformation, as evidenced by the small stress for the 0 ns curve. The structure configurations of the system after different numbers of BERs occurred at the strain of 40% are presented in Fig. 8c. It can be seen at 0 ns, the two materials can be separated easily. For the systems with 3.17τBER and 6.35τBER of welding times, the two surfaces are still partially connected at 40% strain. Increasing the welding time will reduce the size of the unconnected region on the interface during the stretching, which improves the mechanical properties of the welded sample.
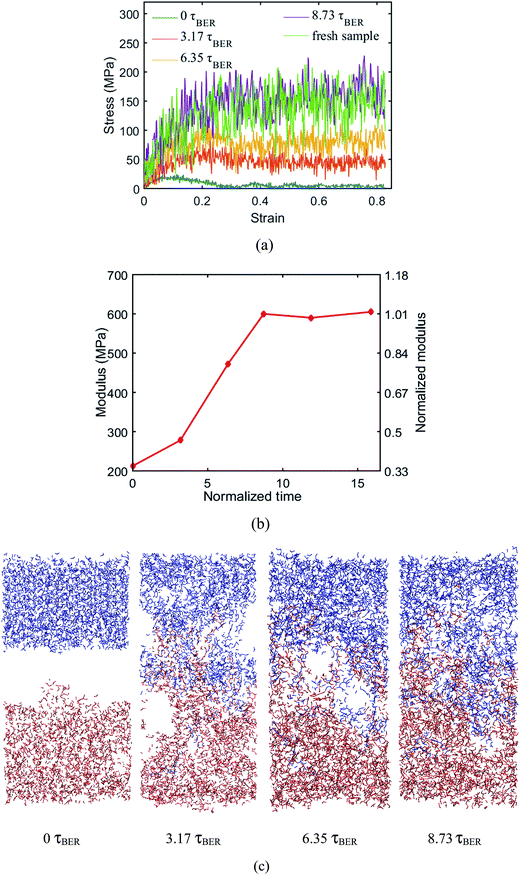 |
| | Fig. 8 (a) Stress–strain curves of the fresh sample and the systems after different numbers of BERs (b) modulus change during the welding process (c) structures under 40% strain during welding process. | |
3.5 Effect of degree of polymerization
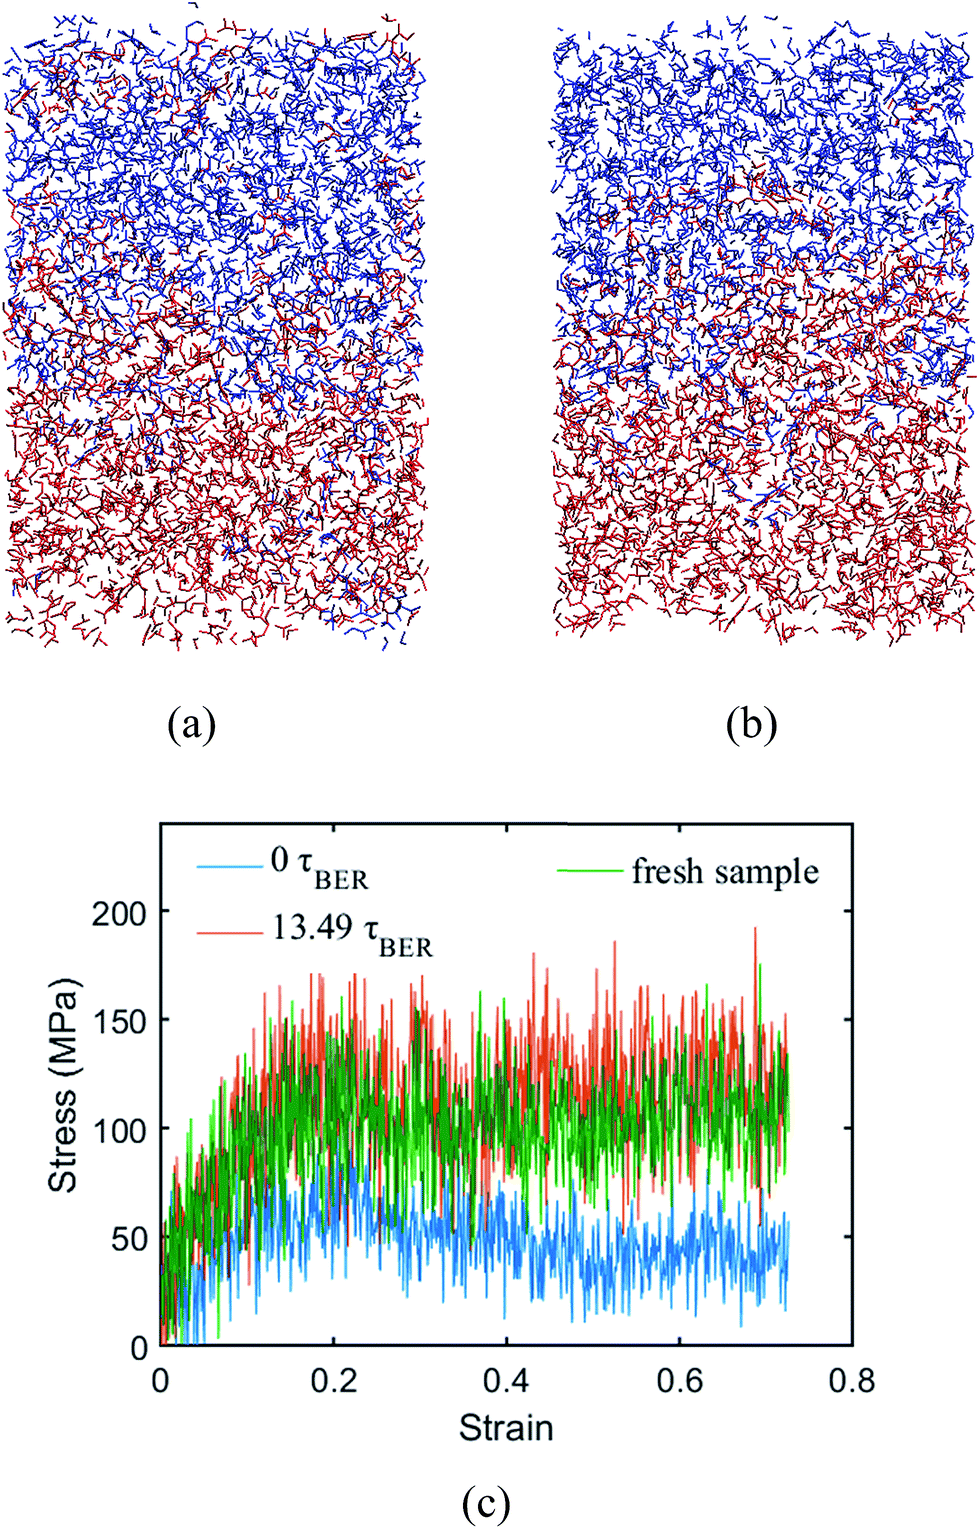
Two systems with different degrees of polymerization (DOP) (80.96% and 97.22%) are built to investigate its effect on the welding behavior. Here, the DOP is defined as the fraction of crosslinked monomers in the bulk material. In order to investigate the effects of DOP, we let it remain a constant without invoking the crosslinking procedure during the BER simulations. The Tgs of the two systems are 316 K and 330 K, respectively. Fig. 9 shows the welded structures of the 80.96% DOP system at 13.49τBER (∼170 iterations), and the 97.22% DOP system at 8.73τBER (∼110 iterations), respectively. It can be seen that the lower DOP leads to more penetration of two materials than that in the higher DOP system. However, the stress–strain behaviors show that it takes more time for the lower DOP system to be welded together. The stress–strain behaviors of the system with the lower DOP shows ∼13.49τBER for welding the two networks; only 8.73τBER is needed for system with a higher DOP (Fig. 8a). This might be because the system with a lower DOP has a larger average distance among monomers, which reduces the chance for BERs and requires a longer time period to weld.
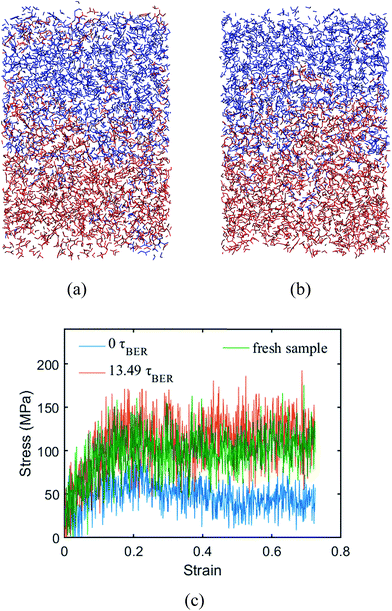 |
| | Fig. 9 Welded structures of different degree of polymerization. (a) The system with degree of polymerization of 80.96%; (b) the system with degree of polymerization of 97.22%. (c) The stress–strain curves of the fresh sample and the systems after different numbers of BERs. | |
3.6 Effect of crosslinking density
Two systems with different crosslinking densities (CDs) are built to investigate its influence on the surface welding behavior. The CD is changed by adjusting the stoichiometry of the reaction system. In particular, one system has one DGEBA monomer between two crosslinking sites (S1 system), while the other system has two DGEBA monomers (S2 system). The densities of two systems are 1.04 g cm−3 and 1.02 g cm−3, respectively. The relative molecular masses of the two systems are 340 and 680, respectively, designated as Mc. Crosslinking density can be expressed as follows:35| |
 | (2) |
where ν is the crosslink density, ρ is the density of the system. Therefore, the crosslink density of the two systems are 0.003 cm−3 and 0.0015 cm−3, respectively. The Tgs of the two systems are 330 K and 320 K, respectively. For S1, it takes 8.73τBER (∼110 iterations) for the two surfaces to be welded together; for S2, it takes 6.35τBER (∼80 iterations). After a given number of BERs is finished in both systems, the comparison of welded structures is shown in Fig. 10a. The number of BERs is plotted in Fig. 10b; it can be seen that more BERs occurred in the S2 system. This is because the ratio of active oxygen to active carbon is 1:1 in the S1 system; however, their ratio is 2:1 in the S2 system, which leads to more probabilities for BERs to occur.
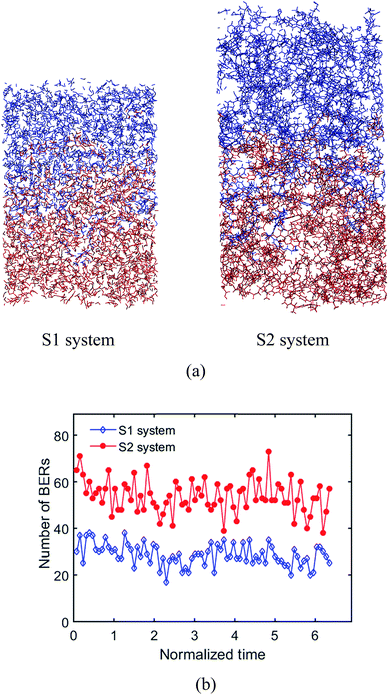 |
| | Fig. 10 Effects of crosslinking density. (a) Welded structures of the S1 system and the S2 system, (b) number of BERs occurring in the S1 system and the S2 system. | |
3.7 Effects of temperature
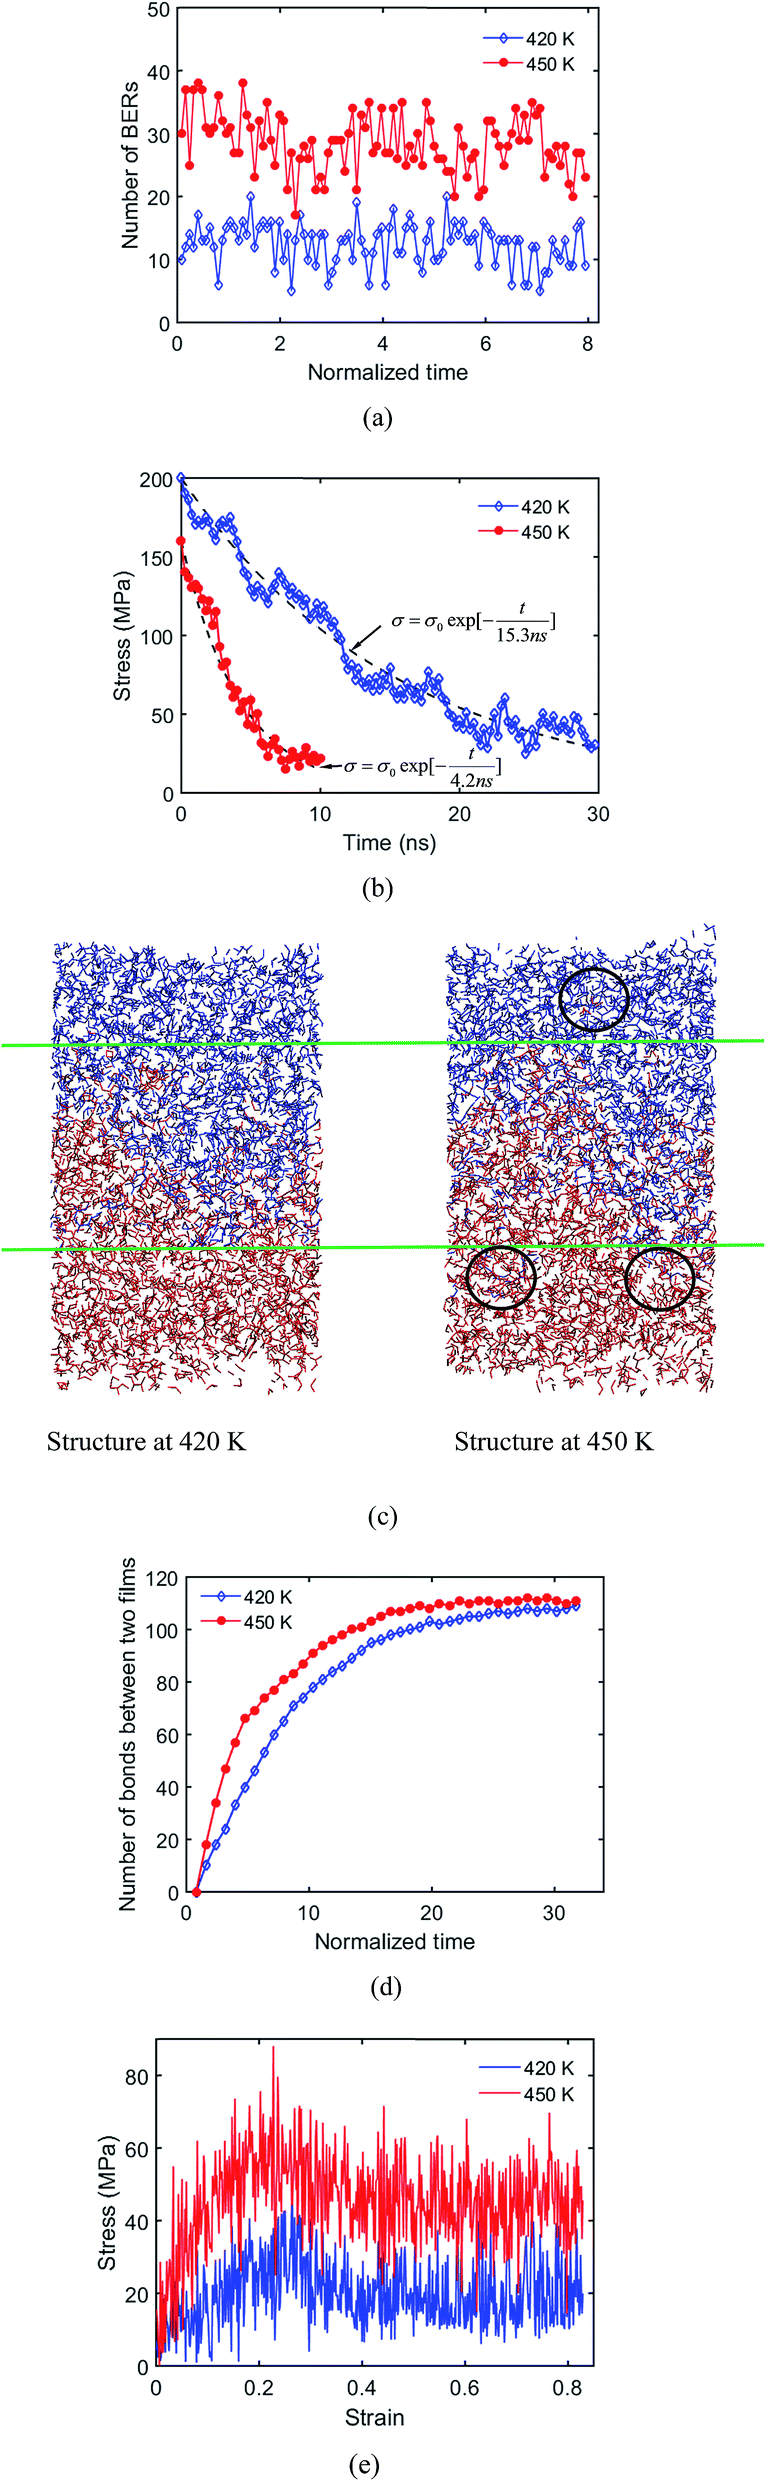
It is well known that increasing the welding temperature increases the mobility of polymer chains. However, a larger free volume at a higher temperature also increases the distance that active atoms must travel before reaching another available site. In this manner, the rate of exchange reactions, stress relaxation and surface welding in adaptive networks depend on the competition between these two effects. In previous theoretical studies,17 the thermal expansion of a polymer network is usually assumed to be minimal, so the second effect is neglected. To study this assumption, we investigate the temperature dependency of stress relaxation and surface welding by setting the temperature to be 420 K and 450 K respectively. The rate of BERs follows an Arrhenius law:| | |
k = Aexp(−Ea/(RT))
| (3) |
where k is the rate constant of a chemical reaction, T is the absolute temperature in kelvin, A is a prefactor, Ea is the activation energy, R is the universal gas constant. By setting Ea = 68.18 kJ mol−1, and R = 8.314 J (mol K)−1, we determine that the reaction rate at 420 K is 27% of that at 450 K. In order to consider the temperature dependency of BERs, in addition to the previously mentioned distance and energy level judgment criterion, we add a Monte-Carlo procedure to determine the occurrence rate of BERs. Specifically, a probability is calculated based on eqn (3) and is normalized to 1 at T = 450 K. To enable Monte-Carlo procedure, a random number is generated and compared with the probability. If the random number is smaller than the probably, BER occurs. The number of BERs at 450 K and 420 K during the BER process are plotted in Fig. 11a. The total number of BERs after 7.94τBER (∼100 iterations) is 1242 and 2850 at 420 K and 450 K, respectively, which shows clearly that a higher temperature leads to more BERs. It is noted that τBER at 450 K is used to record the welding time. Fig. 11b plots the stress relaxation curves at 420 K and 450 K. It can be seen that the stress is relaxed slower at the lower temperature. By using a simple exponential function, we are able to measure the relaxation time and energy barrier according to the method developed by Yu et al.,23 where the stress relaxation time is calculated as| |
 | (4) |
From eqn (4), the calculated energy barrier is ∼67.67 kJ mol−1, which is close to the Ea used in eqn (3). Therefore, we can confirm that the increased free volume in the network has a negligible effect on the rate of BERs and surface welding.
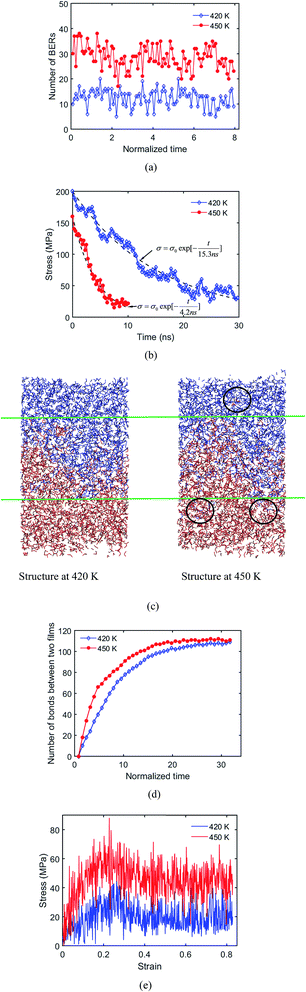 |
| | Fig. 11 (a) Number of BERs at 420 K and 450 K; (b) stress relaxation times at 420 K and 450 K; (c) structures at 420 K and 450 K after 10 ns welding time; (d) number of bonds between two films at 420 K and 450 K; (e) stress–strain curves at 420 K and 450 K after 8 ns welding process. | |
Fig. 11c shows the welded structures at 450 K and 420 K, where the welding time is 6.35τBER. It is seen that the deepest penetration length at 450 K (∼31.04 Å) is higher than that at 420 K (∼20.97 Å), which results from the increased chain mobility and rate of BERs at the higher temperature. This also leads to more bonds being formed between two films at the temperature of 450 K, as shown in Fig. 11d. Our simulation results are consistent with the previous study by Shojaei et al.,36 on the healing behavior of shape memory polymers, where a higher temperature leads to faster chain diffusion and faster healing process.
The system with deeper penetration also leads to a higher strength of the welded system. As seen from stress–strain curves in Fig. 11e, when the welding time is 6.35τBER, the yielding stress of the system at 450 K is nearly two times that at 420 K. However, after 8.73τBER (∼110 iterations) and 24.6τBER (∼310 iterations) at 450 K and 420 K, respectively, the two welded systems have the same mechanical properties as the fresh sample (results not shown). This indicates that a high welding temperature promotes a faster welding speed, but will not affect the ultimate properties of the welded sample.
4. Discussion
4.1 Effect of initial gap
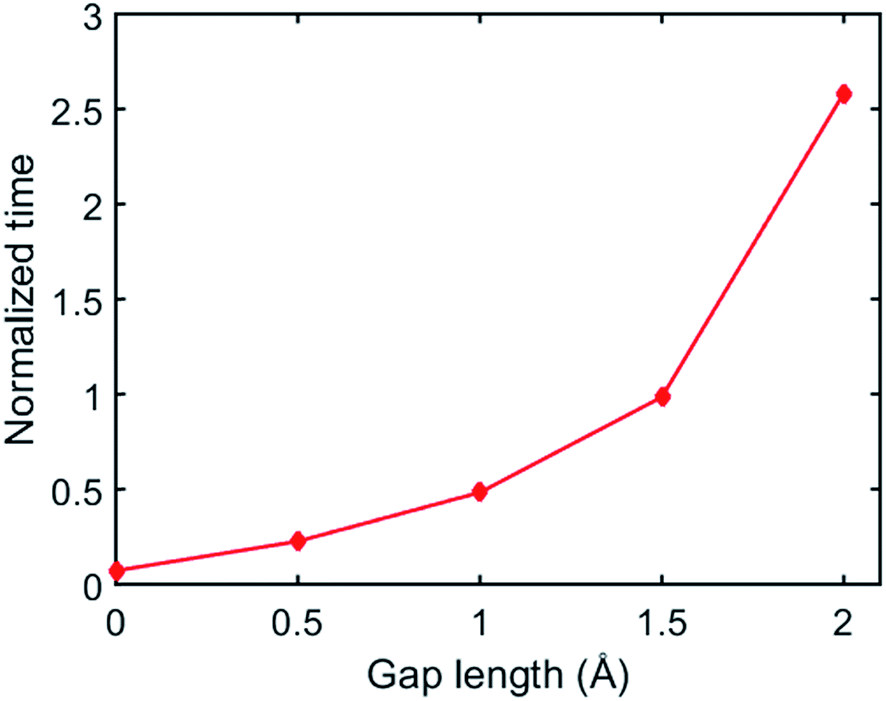
In our simulations, we set an initial gap between the two surfaces before the BER simulation starts. The gap is defined as the distance between the lowest atom of the upper material and the highest atom of the bottom material. Here, we further examine how the initial gap affects the simulated welding process. Fig. 12 plots the normalized time required before the first BER occurred between the two networks at different gap distances where the time is normalized by τBER. It is seen that if the gap is increased, the time required for the first BER is exponentially increased. For example, when the gap length is 0.5 Å, the first BER takes only ∼0.2τBER, while this number is increased to ∼2.58τBER when the gap length is 2 Å. Such an increased idling time before the first BER will lead to a lower welding efficiency in the adaptive networks. This also agrees with experimental observations that a higher pressure can promote a faster welding process, as the pressure can enhance a closer contact between the two surfaces.23,37
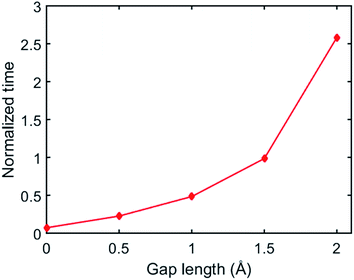 |
| | Fig. 12 The simulation time before the first BER occurred between two films in the systems with different gap length. | |
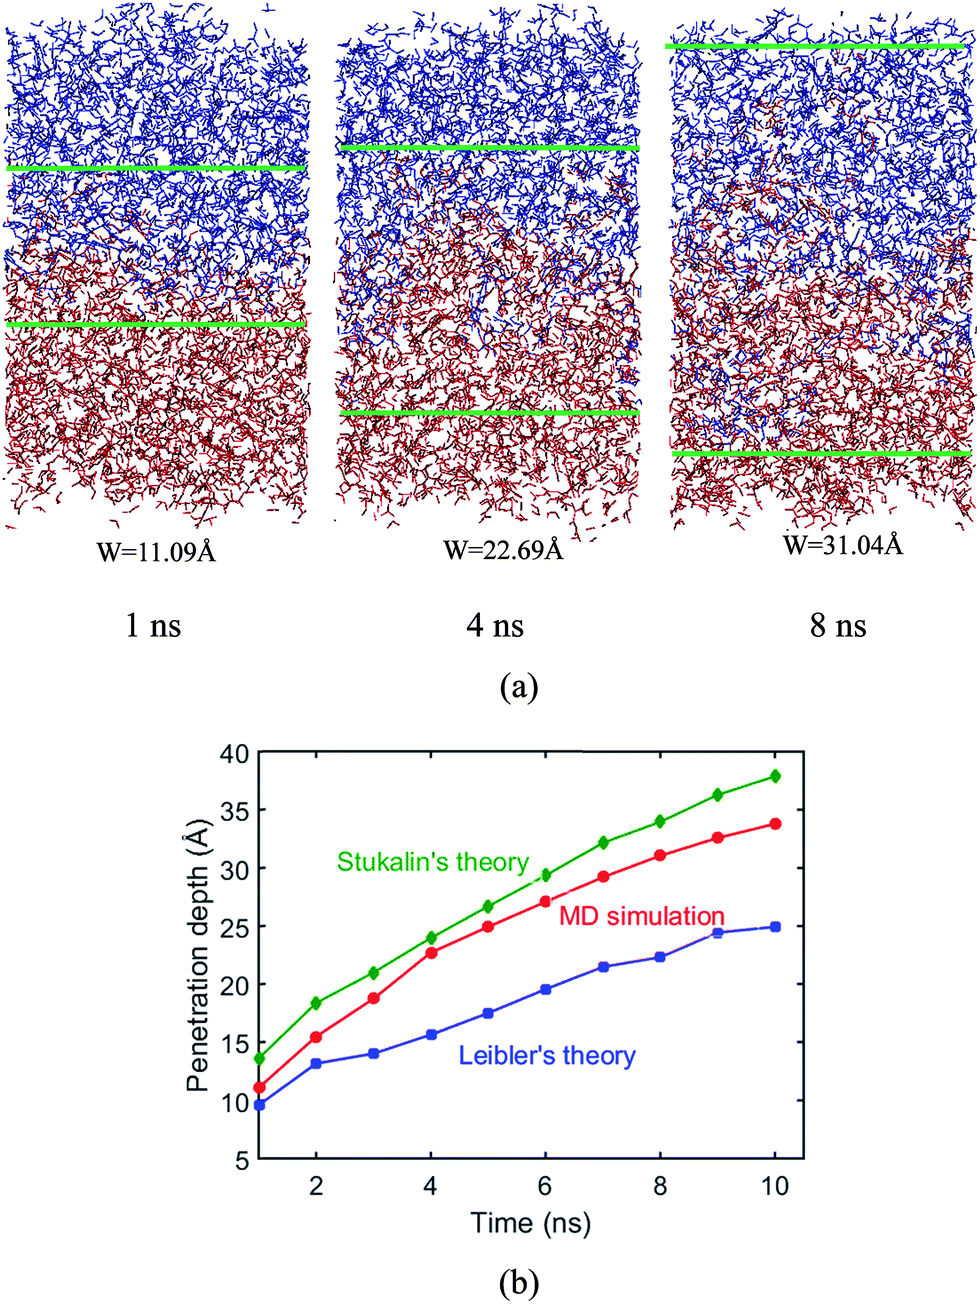
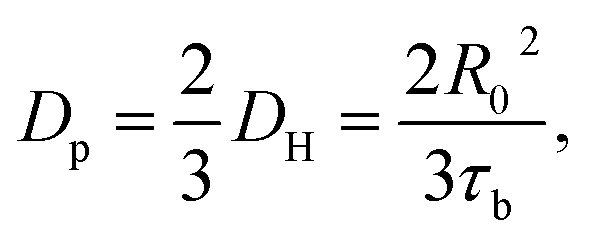
4.2 Penetration depth during the welding process
In the following, we examine the penetration depth of polymer chains during the surface welding, and compare the simulation results with the predictions from existing theories. The structure configurations during welding process are presented in Fig. 13a, which shows clearly that the penetration of active atoms into the two films increases with the welding time. The measured penetration depth is plotted in the red curve in Fig. 13b as a function of time.
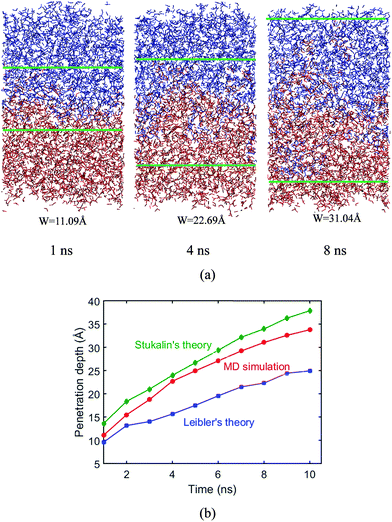 |
| | Fig. 13 Penetration depth. (a) Structural configurations during welding process. (b) Penetration depths from theoretical predictions and MD simulations. | |
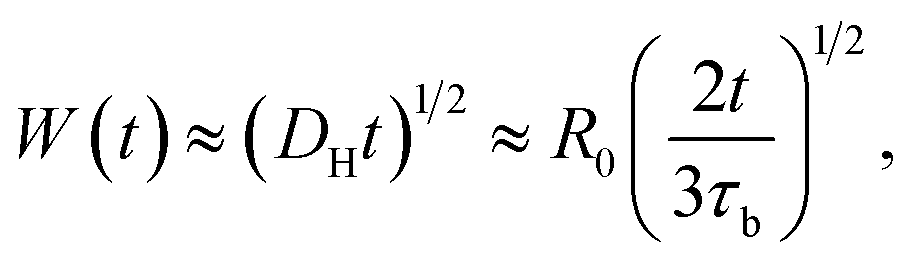
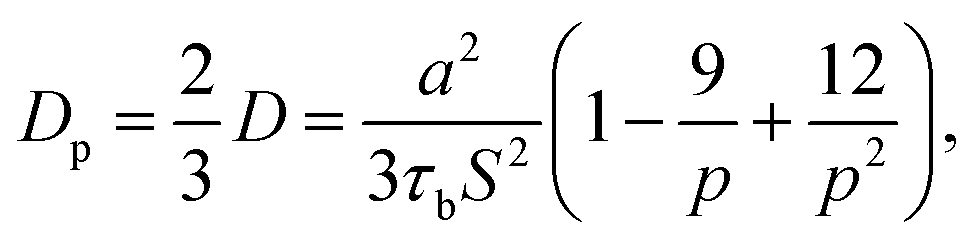
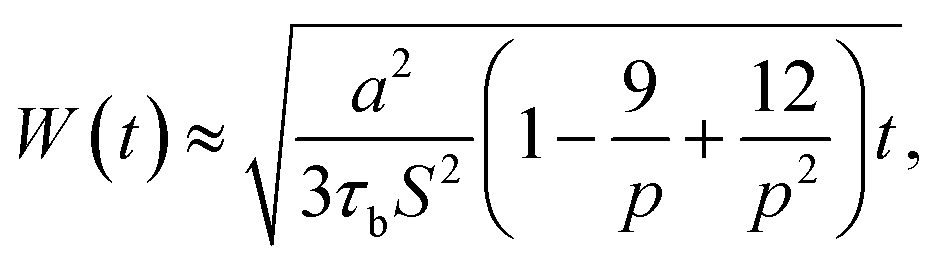
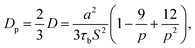
Previously, Stukalin's et al.17 studied the surface welding of unentangled polymer networks. If we assume relatively higher bonding strength, the surface welding is dominated by hopping diffusion of exchangeable bonds, and the diffusivity DH is written as:
| |
 | (5) |
where
R0 ≈
bN1/2,
τb is the average time two stickers spend in a bonded state before a successful separation on molecular distance. The deepest penetration depth of polymer chains during the surface welding is related to the diffusivity as:
| |
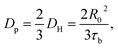 | (6) |
| |
 | (7) |
Leibler and coworkers24 considered that the motion of polymer chains is confined in a tube, with a diameter of a ≅ bN1/2. Here a is average end to end distance, with b denoting monomer length, and N denoting the number of monomers between two crosslink sites. By considering the Rouse type diffusion of single polymer chains in the confining tube, the network diffusivity is written as:
| |
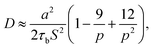 | (8) |
where
S is number of stickers attached to each chain, according to Stukalin
et al.,
17 p can also be calculated as the fraction of lifetime of closed stickers,
i.e. p =
τb/(
τb +
τo), where
τb is the lifetime of the closed stickers and
τo is the lifetime of the free (open) ones. The average lifetimes of free stickers and closed stickers are shown in
Table 1. For the epoxy network,
a = 14.4 Å,
S = 5. If we only consider the diffusion in the normal direction of the interface, the diffusivity should be written as:
| |
 | (9) |
Table 1 Average lifetime of closed stickers and free stickers during BER process, fraction of closed stickers during BER process
| Iteration |
10 |
20 |
30 |
40 |
50 |
60 |
70 |
80 |
90 |
100 |
| Average lifetime of closed stickers (ps) |
745 |
820 |
942 |
963 |
971 |
964 |
936 |
959 |
945 |
964 |
| Average lifetime of free stickers (ps) |
621 |
703 |
715 |
701 |
714 |
729 |
711 |
707 |
728 |
713 |
| p |
0.55 |
0.54 |
0.57 |
0.58 |
0.58 |
0.57 |
0.57 |
0.58 |
0.56 |
0.57 |
The average penetration depth of polymer chains during the surface welding can be expressed as:
| |
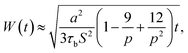 | (10) |
During the MD simulation, the lifetime of free stickers during the BER process is shown in Table 1. Based on the measured life times, we are able to predict the penetration depths by using eqn (6). This prediction, together with the prediction obtained by using eqn (8), is compared with the simulation results as shown in Fig. 13b. It is seen that the penetration depth from MD simulation matches very closely with the prediction from Stukalin's theory, but the Leibler's theory predicts a relatively smaller penetration. This observation is consistent with our previous demonstration that the diffusivity measured from MD simulation is close to Stukalin's work. In such case, Stukalin's theory serves as a good supplement to consider the interactions and restrictions between neighboring polymer chains.
5. Conclusions
In this paper, we investigated the surface welding behavior of covalent adaptable network polymers with thermally induced bond exchange reactions by using a full atomistic molecular dynamics simulation. The simulations revealed how an exchangeable bond undergoes bond exchange reactions, as well as the trajectory of active atoms across the interface during surface welding. Based on the simulations, we analyzed the influence of welding conditions and material properties, such as welding time, temperature, network crosslinking density and degree of polymerization etc., on the performance of welded samples. Specifically, it was found that both modulus and yield strength will increase with the welding time and temperature, and eventually they will reach the same level as those of the fresh sample. For the crosslinking density, a lower crosslinking density will result in a shorter welding time. It is also interesting to found that a lower degree of polymerization will lead to a slower surface welding between covalent adaptable networks. Finally, the penetration depth of a polymer chain across an interface is obtained from molecular dynamics simulations and compared with theoretical predictions. It is concluded that the entanglement of polymer chains will notably reduce the diffusivity. When such a network is considered, both Leibler's theory and Stukalin's theory can predict the penetration depth and the Stukalin's theory is close to our molecular dynamic simulations.
Acknowledgements
HY acknowledges the financial support from Chinese Scholarship Council. HJQ and HY acknowledge the financial support from US National Science Foundation (CMMI-1404627). HJQ also acknowledges the support from National Natural Science Foundation of China (11472207).
References
- F. W. Billmeyer, Textbook of Polymer Science, Wiley, New York, 3rd edn, 1984 Search PubMed
 .
. - J. D. Ferry, Viscoelastic properties of polymers, John Wiley & Sons., 1980 Search PubMed .
- C. J. Kloxin, T. F. Scott, B. J. Adzima and C. N. Bowman, Covalent Adaptable Networks (CANS): A Unique Paradigm in Cross-Linked Polymers, Macromolecules, 2010, 43(6), 2643–2653 CrossRef CAS PubMed .
- R. J. Wojtecki, M. A. Meador and S. J. Rowan, Using the dynamic bond to access macroscopically responsive structurally dynamic polymers, Nat. Mater., 2011, 10(1), 14–27 CrossRef CAS PubMed .
- C. N. Bowman and C. J. Kloxin, Covalent Adaptable Networks: Reversible Bond Structures Incorporated in Polymer Networks, Angew. Chem., Int. Ed., 2012, 51(18), 4272–4274 CrossRef CAS PubMed .
- R. Long, H. J. Qi and M. L. Dunn, Modeling the mechanics of covalently adaptable polymer networks with temperature-dependent bond exchange reactions, Soft Matter, 2013, 9(15), 4083–4096 RSC .
- D. A. Roberson, R. B. Wicker and E. MacDonald, Ohmic Curing of Printed Silver Conductive Traces, J. Electron. Mater., 2012, 41(9), 2553–2566 CrossRef CAS .
- J. Ma, X. Mu, C. N. Bowman, Y. Sun, M. L. Dunn, H. J. Qi and D. Fang, A Photoviscoplastic Model for Photo Activated Covalent Adaptive Networks, J. Mech. Phys. Solids, 2014, 70, 84–103 CrossRef CAS .
- J. R. Mcelhanon, E. M. Russick, D. R. Wheeler, D. A. Loy and J. H. Aubert, Removable foams based on an epoxy resin incorporating reversible Diels–Alder adducts, J. Appl. Polym. Sci., 2002, 85(7), 1496–1502 CrossRef CAS .
- B. J. Adzima, H. A. Aguirre, C. J. Kloxin, T. F. Scott and C. N. Bowman, Rheological and Chemical Analysis of Reverse Gelation in a Covalently Cross-Linked Diels–Alder Polymer Network, Macromolecules, 2008, 41(23), 9112–9117 CrossRef CAS PubMed .
- N. W. Polaske, D. V. McGrath and J. R. McElhanon, Thermally Reversible Dendronized Step-Polymers Based on Sequential Huisgen 1,3-Dipolar Cycloaddition and Diels–Alder “Click” Reactions, Macromolecules, 2009, 1270–1276 Search PubMed .
- R. J. Sheridan, B. J. Adzima and C. N. Bowman, Temperature Dependent Stress Relaxation in a Model Diels–Alder Network, Aust. J. Chem., 2011, 64(8), 1094–1099 CrossRef CAS .
- X. X. Chen, M. A. Dam, K. Ono, A. Mal, H. B. Shen, S. R. Nutt, K. Sheran and F. Wudl, A thermally re-mendable cross-linked polymeric material, Science, 2002, 295(5560), 1698–1702 CrossRef CAS PubMed .
- T. Scott, A. Schneider, W. Cook and C. Bowman, Photoinduced plasticity in cross-linked polymers, Science, 2005, 308(5728), 1615–1617 CrossRef CAS PubMed .
- D. Montarnal, M. Capelot, F. Tournilhac and L. Leibler, Silica-Like Malleable Materials from Permanent Organic Networks, Science, 2011, 334(6058), 965–968 CrossRef CAS PubMed .
- J. Ryu, M. D'Amato, X. Cui, K. N. Long, H. J. Qi and M. L. Dunn, Photo-origami—bending and folding polymers with light, Appl. Phys. Lett., 2012, 100(16), 161908 CrossRef .
- E. B. Stukalin, L.-H. Cai, N. A. Kumar, L. Leibler and M. Rubinstein, Self-Healing of Unentangled Polymer Networks with Reversible Bonds, Macromolecules, 2013, 46(18), 7525–7541 CrossRef CAS PubMed .
- Y. Zhang, A. A. Broekhuis and F. Picchioni, Thermally Self-Healing Polymeric Materials: The Next Step to Recycling Thermoset Polymers?, Macromolecules, 2009, 42(6), 1906–1912 CrossRef CAS .
- Y. Amamoto, J. Kamada, H. Otsuka, A. Takahara and K. Matyjaszewski, Repeatable Photoinduced Self-Healing of Covalently Cross-Linked Polymers through Reshuffling of Trithiocarbonate
Units, Angew. Chem., 2011, 123(7), 1698–1701 CrossRef .
- J. Canadell, H. Goossens and B. Klumperman, Self-Healing Materials Based on Disulfide Links, Macromolecules, 2011, 44(8), 2536–2541 CrossRef CAS .
- M. Capelot, D. Montarnal, F. Tournilhac and L. Leibler, Metal-Catalyzed Transesterification for Healing and Assembling of Thermosets, J. Am. Chem. Soc., 2012, 134(18), 7664–7667 CrossRef CAS PubMed .
- G. H. Deng, C. M. Tang, F. Y. Li, H. F. Jiang and Y. M. Chen, Covalent Cross-Linked Polymer Gels with Reversible Sol–Gel Transition and Self-Healing Properties, Macromolecules, 2010, 43(3), 1191–1194 CrossRef CAS .
- K. Yu, P. Taynton, W. Zhang, M. L. Dunn and H. J. Qi, Reprocessing and recycling of thermosetting polymers based on bond exchange reactions, RSC Adv., 2014, 4(20), 10108–10117 RSC .
- L. Leibler, M. Rubinstein and R. H. Colby, Dynamics of reversible networks, Macromolecules, 1991, 24(16), 4701–4707 CrossRef CAS .
- F. Smallenburg, L. Leibler and F. Sciortino, Patchy particle model for vitrimers, Phys. Rev. Lett., 2013, 111(18), 699–704 CrossRef PubMed .
- T. Ge, F. Pierce, D. Perahia, G. S. Grest and M. O. Robbins, Molecular Dynamics Simulations of Polymer Welding: Strength from Interfacial Entanglements, Phys. Rev. Lett., 2013, 110(9), 430–440 CrossRef PubMed .
- D. R. Rottach, J. G. Curro, J. Budzien, G. S. Grest, C. Svaneborg and R. Everaers, Molecular dynamics simulations of polymer networks undergoing sequential cross-linking and scission reactions, Macromolecules, 2007, 40(1), 131–139 CrossRef CAS .
- H. Yang, K. Yu, X. Mu, X. Shi, Y. Wei, Y. Guo and H. Jerry Qi, A molecular dynamics study of bond exchange reactions in covalent adaptable networks, Soft Matter, 2015, 6305–6317 RSC .
- H. Sun, Ab Initio Calculations and Force-Field Development for Computer-Simulation of Polysilanes, Macromolecules, 1995, 28(3), 701–712 CrossRef CAS .
- S. Plimpton, Fast Parallel Algorithms for Short-Range Molecular-Dynamics, J. Comput. Phys., 1995, 117(1), 1–19 CrossRef CAS .
- S. Nose, A Unified Formulation of the Constant Temperature Molecular-Dynamics Methods, J. Chem. Phys., 1984, 81(1), 511–519 CrossRef CAS .
- W. G. Hoover, Canonical Dynamics – Equilibrium Phase-Space Distributions, Phys. Rev. A, 1985, 31(3), 1695–1697 CrossRef .
- C. Wu and W. Xu, Atomistic molecular modelling of crosslinked epoxy resin, Polymer, 2006, 47(16), 6004–6009 CrossRef CAS .
- V. Varshney, S. S. Patnaik, A. K. Roy and B. L. Farmer, A molecular dynamics study of epoxy-based networks: cross-linking procedure and prediction of molecular and material properties, Macromolecules, 2008, 41(18), 6837–6842 CrossRef CAS .
- P. J. Flory and J. Rehner, Statistical Mechanics of Cross-Linked Polymer Networks II. Swelling, J. Chem. Phys., 1943, 11(11), 521–526 CrossRef CAS .
- A. Shojaei, S. Sharafi and G. Q. Li, A multiscale theory of self-crack-healing with solid healing agent assisted by shape memory effect, Mech. Mater., 2015, 81, 25–40 CrossRef .
- K. Yu, P. Taynton, W. Zhang, M. L. Dunn and H. J. Qi, Influence of Stoichiometry on the Glass Transition and Bond Exchange Reactions in Epoxy Thermoset Polymers, RSC Adv., 2014, 4, 48682–48690 RSC .
|
| This journal is © The Royal Society of Chemistry 2016 |
Click here to see how this site uses Cookies. View our privacy policy here. 


 , and
, and  , where N = 2 is the number of lattice layers parallel to the interface. N is determined to be the network thickness in the following MD simulation divided by the size of each lattice, which is comparable to the radius of gyration of polymer chains. n0 is the chain density and is used to normalize the bonds crossing the interface.
  , and τ represents the relaxation time and is taken to be 4.2 ns, as measured by the stress relaxation curve in the MD simulation (Fig. 4). Fig. 7 plots the normalized number of bonds crossing the interface in both the MD simulation and the theoretical prediction. Here, the normalized number of bonds is calculated by using their respective saturation values, and the time is normalized by the stress relaxation time. The consistency between the two curves verifies the effectiveness of the theory of Yu et al. (2015).