Gabriela Blanita*,
Gheorghe Borodi,
Mihaela D. Lazar,
Alexandru-Radu Biris,
Lucian Barbu-Tudoran,
Ioan Coldea and
Dan Lupu
National Institute for Research and Development of Isotopic and Molecular Technologies, 67-103 Donat Str., 400293 Cluj-Napoca, Romania. E-mail: Gabriela.Blanita@itim-cj.ro; Tel: +40 264 58 40 37
First published on 25th February 2016
A new method for the preparation of HKUST-1 using a microwave-assisted non-solvothermal synthesis is presented. The influence of the reaction parameters (concentration of reactant mixtures, solvent, temperature, reaction time and microwave power) on the material’s textural properties and yields has been investigated and the synthetic method was optimized. By exposing the reaction mixture to microwaves for up to 10 minutes HKUST-1 with a surface area and pore volume close to the theoretical values and a yield of about 70% was obtained. In addition, yields could reach around 90% if the product formed in the mother liquor is counted.
For industrial scale applications, MOFs with desired properties must be synthesized and processed in high yields and purities by streamlined methods. MOFs are synthesized by diverse synthetic strategies7,8: solvothermal, ambient pressure (non-solvothermal), slow interdiffusion of the respective building-block solutions,9 microfluidics,10 ionic liquids, mechano-11,12 and electro-chemistry,13,14 etc. The most commonly used synthetic method is synthesis under solvothermal conditions. Various solvothermal techniques were developed depending on the source of energy used, from electric heating (conventional synthesis) to microwave irradiation (microwave-assisted synthesis) and high-energy ultrasound (sonochemical synthesis).
Although novel approaches like the high-throughput strategies, continuous flow15 or spray-drying,16 were presented, HKUST-1 is produced almost exclusively by solvothermal techniques, mostly using electric heating,17 except for two microwave-assisted examples.18,19 Regarding synthesis at atmospheric pressure, the literature only shows examples using electric heating20 and ultrasound.19,21
We propose a new method for HKUST-1 preparation; a microwave assisted non-solvothermal synthesis, that combines the advantages of microwaves (power efficiency, rapid nucleation, accelerated crystal growth, phase selectivity and high yields) with those of reactions at atmospheric pressure which simplifies the synthetic requirements.22 The influence of reaction parameters such as concentration of reactant mixtures, solvent, temperature, reaction time and microwave power on the product has been investigated and optimized for HKUST-1 synthesis.
Scanning electron microscopy (SEM) was undertaken using a FEI Quanta 3D FEG SEM and a Hitachi SU 8230 SEM at an accelerating voltage of 20 and 30 kV, respectively.
The samples’ textural properties were estimated from nitrogen adsorption/desorption isotherms obtained at −196 °C using a Sorptomatic 1990 (Thermo Electron Corporation) apparatus. The Brunauer–Emmett–Teller (BET) surface area (SBET) was calculated using the multiple-point method in the relative pressure range p/p0 of 0.02–0.15. The specific pore volume was determined according to Gurvich’s rule at p/p0 of 0.95. Before measurement, each sample was degassed at 220 °C for 18 hours under dynamic vacuum.
The thermogravimetric analysis (TGA) of the samples was performed on a SDT Q600 V20.9 Build 20 instrument in air (100 ml min−1) between 20 and 600 °C at a constant heating rate of 10 °C min−1.
FT-IR spectra of the samples were recorded by a KBr pellet method using a Jasco FT/IR 6100 spectrometer from 4000 to 400 cm−1 and a resolution down to 4 cm−1.
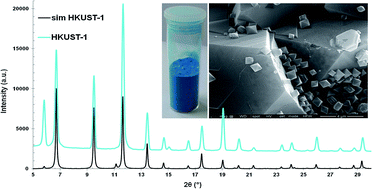
The identity of the prepared samples was confirmed by the comparison of each PXRD pattern with the simulated diffraction pattern of HKUST-1 from the crystallographic data (Fig. 1).24 The patterns are in good agreement with the simulated one and coincide well with each other. Each HKUST-1 sample was obtained as a pure sample with a high degree of crystallinity as evidenced by the presence of the sharp peaks in their PXRD patterns.
![]() | ||
Fig. 1 The PXRD patterns of samples 1, 2, 3 and 4 compared with the HKUST-1 simulated diffraction pattern from the crystallographic data.24 |
Further confirmations of HKUST-1 formation are provided by the FT-IR spectra presented in Fig. 2. The most significant features in the FT-IR spectra of samples 1, 2 and 3 are the asymmetric and symmetric stretching peaks near to 1630 and 1370 cm−1, respectively indicating the presence of carboxylate within the framework.25,26 Also the C–C stretches in the aromatic ring (∼1570 and 1440 cm−1) can be observed, as well as the in-plane C–H bending (∼1100 cm−1), and C–H out-of-plane (∼725 and 735 cm−1).27 The FTIR spectra of the subsequent samples have similar characteristics.
The crystals of the HKUST-1 material usually have a typical octahedral morphology. As shown in Fig. 3, the size and shape of the crystal samples are influenced by the concentration of the reaction mixture. While the crystals of the first two samples had a mostly granular aspect with undefined forms, sample 3 crystallized into large octahedra with well-defined faces and edges, together with polycrystalline agglomerates. Regarding the size, the crystals increase in size with the increase of the reaction mixture concentration. The 10000× magnified image of sample 3 shows crystals of different sizes proving that they continuously nucleate over the reaction time.
The BET surface areas and pore volumes of the HKUST-1 samples, estimated from nitrogen adsorption isotherms (Fig. 4), are summarized in Table 1. Samples 1 and 2 have similar surface areas, but these are lower than 1200 m2 g−1, while the surface areas of the other samples (3 and 4) are greater than 1700 m2 g−1. This grouping highlights the relationship between the surface area of the samples and the concentration of each reaction mixture: the sample surface area increases with the increase of the reaction mixture concentration. The type I isotherms recorded for samples 2, 3 and 4 prove their microporous nature. Two steps can be observed in the adsorption isotherm of samples 3 and 4, associated with the bimodal pore size distribution of the samples.28 The same step-like fashion of the nitrogen adsorption isotherms is exhibited by MIL-101.29 Unlike the other three samples, sample 1 shows a type IV(a) adsorption isotherm which is obtained with mesoporous adsorbents.30 The pore size distributions of all of the samples calculated from the nitrogen adsorption measurements using the Horvath–Kawazoe method are presented in Fig. 5. The samples exhibit a narrow distribution in the microporous domain with maxima at 0.5 nm (samples 1 and 2) and 0.7 nm (samples 3 and 4) and amplitudes that follow the observed trend of surface areas. Sample 1 has nearly 45% of its pore volume in mesopores.
![]() | ||
Fig. 4 Adsorption (filled symbol) and desorption (empty symbol) isotherms for nitrogen at −196 °C of HKUST-1 samples 1, 2, 3 and 4. |
![]() | ||
Fig. 5 Horvath–Kawazoe pore size distribution of samples 1, 2, 3 and 4 determined from the adsorption branches of the nitrogen isotherms depicted in Fig. 4. |
The thermogravimetric curves of samples 1, 2 and 3 are depicted in Fig. 6. Each curve of the first two samples shows three distinct regions: (1) weight losses of 8 and 6% until 100 °C corresponding to the surface solvent loss, (2) weight losses of 26 and 28% between 100 and 290 °C corresponding to the loss of the solvent molecules trapped in pores and (3) weight losses of 41 and 43% between 290 and 320 °C indicating the framework decomposition. Sample 3 loses 9% of its weight until 50 °C, a further 3% between 50 and 100 °C, a further 50% between 100 and 300 °C and a further 39% between 300 and 350 °C. The weight loss corresponding to framework decomposition is most apparent at 300 °C for samples 1 and 2 and 330 °C for sample 3 (Fig. 6 right).
In conclusion, the reaction mixture concentrations of 4c and 5c are most suitable for HKUST-1 synthesis because the corresponding samples (3 and 4) have similar and better characteristics than the other two samples.
The PXRD patterns of samples 5 and 6 match perfectly with the calculated pattern from the HKUST-1 crystal data. Regardless of the solvent or solvent mixture used for the synthesis by microwave activation at atmospheric pressure, HKUST-1 was obtained (ESI, Fig. S1†).
The surface areas of samples 5 and 6 have declined drastically compared to that of sample 2, at 536 and 844 m2 g−1, respectively. The pore volumes followed the same trend. All of the samples have adsorption isotherms of type I (ESI, Fig. S3†). The isotherm of sample 6 has a type H4 hysteresis, indicative of microporosity.31 As shown in Fig. 7, sample 5 has about 70% of its pore volume in micropores and the rest in mesopores.
![]() | ||
Fig. 7 Horvath–Kawazoe pore size distribution of samples 2, 5 and 6 determined from the adsorption branches of the nitrogen isotherms depicted in Fig. S3.† |
The TGA analyses reveal that samples 5 and 6 are stable up to 275 and 260 °C respectively, indicating lower thermal stabilities than sample 2 (ESI, Fig. S4†).
Sample 2 exhibits the best textural characteristics, therefore the solvent mixture based on DMF/EtOH/H2O (at 1:
1
:
1 volume ratio) was selected for performing the following studies.
The PXRD patterns of samples 7 and 8, compared with those of sample 3 and of the simulated one from crystallographic data, confirm that they are also highly crystalline HKUST-1 (ESI, Fig. S5†).
As we expected, the octahedral crystals of sample 7 are smaller than those of sample 3 because the lower temperature slows down crystal growth (ESI, Fig. S7† and Fig. 3).32
Based on the estimated values of surface area and pore volume from nitrogen measurements at −196 °C (Table 1, ESI, Fig. S8†), we concluded that the textural characteristics of the samples improved from 60 to 70 °C and decreased drastically at 80 °C. Each sample has a type I adsorption isotherm, a feature of microporous compounds (ESI, Fig. S8†). The isotherm of sample 8 has a type H4 hysteresis like sample 6 (ESI, Fig. S3†).
A temperature of 70 °C leads to sample 3 which has the best textural characteristics and properties of all of the three samples, so the next studies of the influence of the reaction parameters were performed at this temperature.
The PXRD patterns of samples 9, 10 and 11 also match well with that of the simulated HKUST-1 confirming their identities (ESI, Fig. S10†).
As you can see in Table 1, there is a relationship between the textural characteristics of the samples and the duration of the microwave treatment. Thus, the surface areas increased from sample 9 to sample 3 in parallel with the increase of microwave treatment duration from 5 to 10 minutes. The extension of the exposure time from 10 to 15 minutes results in the halving of the surface area and pore volume values. The surface areas and pore volumes of samples 10 and 3 have close values, being the highest of all four samples.
The type I nitrogen adsorption/desorption isotherms for this selection of samples are presented in Fig. S13 (ESI).† The nitrogen adsorption isotherm of sample 10 has also got a two step appearance, like sample 3. Sample 11 has a type H4 hysteresis like samples 6 and 8 (ESI, Fig. S3 and S8†).
Thermal analysis confirms the relationship between the duration of exposure to microwaves and the samples’ properties. Thermal stabilities of samples 9 and 10 are similar and lower than that of sample 3, but better than that of sample 11 (Fig. 8 left). The loss of weight corresponding to framework decomposition is most apparent at 299 °C for samples 10 and 11, 305 °C for sample 9 and 330 °C for sample 3 (Fig. 8 right).
In conclusion, reaction times of 7.5 and 10 minutes allow the synthesis of samples with close textural characteristics. The following syntheses will be undertaken with microwave exposure for 10 minutes.
All of the synthesized samples are crystalline HKUST-1 as revealed by the unchanged PXRD pattern compared with the simulated patterns from crystallographic data (Fig. 9).
![]() | ||
Fig. 9 The PXRD patterns of samples 3, 12, 13 and 14 compared with the simulated diffraction patterns from the crystallographic data.24 |
Fig. 10 presents the SEM micrographs of sample 14. Most of the crystals of sample 14 have a typical octahedron shape, but there are also some with a more irregular shape. Compared to sample 3 (Fig. 3) sample 14’s crystals are less uniform in shape and have smaller dimensions.
Samples 12, 13 and 14 have also a type I nitrogen adsorption/desorption isotherm (ESI, Fig. S15†). Their estimated surface areas and pore volumes presented in Table 1 show an interesting evolution with the change of microwave power. As the power increased from 360 to 630 W, surface areas and pore volumes decreased from sample 3 to sample 12 and then increased to samples 13 and 14. In fact, the surface area (1863 m2 g−1) and pore volume (0.8 cm3 g−1) of sample 14 are the highest of all of the samples presented in this work. A possible and plausible explanation for this evolution of textural properties could be the specific harmonics generated by the microwave magnetron at different powers. Fig. 11 presents a comparison between the pore size distributions of the samples. All of the samples exhibit a narrow distribution of pore size with maxima at 0.7 nm. Around 95% of the pore volume of sample 14 is in micropores.
![]() | ||
Fig. 11 Horvath–Kawazoe pore size distribution of samples 3, 12, 13 and 14 determined from the adsorption branches of the nitrogen isotherms depicted in Fig. S15.† |
As we expected, the yield increases with the microwave power applied to the reaction mixture (Table 1) from 33% (sample 3) to 56% (sample 14).
What happens with the textural properties of a sample synthesized by subjecting the reaction mixture with a concentration of 5c to a microwave power of 630 W at 70 °C for 10 minutes? The as-prepared HKUST-1 sample, denoted as 15, has a surface area of 1746 m2 g−1 and a pore volume of 0.78 cm3 g−1. Increasing the concentration of the reaction mixture from 4c to 5c pushed up the yield from 56 to 70%.
Also, we tested this reaction mixture under the same conditions (630 W, 70 °C) but with a reaction time of 7.5 minutes. Sample 16 was obtained with a yield of 38% and has a surface area of 1794 m2 g−1 and pore volume of 0.76 cm3 g−1, similar to those of sample 15. The results are similar to those obtained for samples 3 and 10 synthesized from reaction mixtures of 4c concentration, at 360 W in 10 and 7.5 minutes, respectively, proving the reproducibility of this synthetic method.
For this purpose, the synthesis of sample 14 was repeated 10 times. After HKUST-1 removal, the mother liquors were collected and kept for 2 months. The blue precipitate was separated by decantation and then subjected to activation as with the previous samples. It was denoted as 14(2). After another two months, the blue precipitate formed in the mother liquor was separated and subsequently activated. This sample was denoted as 14(4). The PXRD patterns of both samples proved that they are HKUST-1 with a high degree of crystallinity (Fig. 12).
The surface areas and pore volumes estimated from their nitrogen adsorption isotherms (ESI, Fig. S18†) are: 1716 m2 g−1 and 0.76 cm3 g−1 for sample 14(2) and 1775 m2 g−1 and 0.78 cm3 g−1 for sample 14(4).
The TGA and DTG curves of samples 14, 14(2) and 14(4) are presented in Fig. S19 (ESI).† The weight loss corresponding to framework decomposition is most apparent at the point of 307 °C for sample 14, 313 °C for sample 14(2) and 327 °C for sample 14(4).
If we take into account samples 14(2) and 14(4) the total yield of sample 14 rises to 87%.
Footnote |
† Electronic supplementary information (ESI) available. See DOI: 10.1039/c5ra26097c |
This journal is © The Royal Society of Chemistry 2016 |