
Hydrothermal self-assembly of graphene foams with controllable pore size†
Wei Deng,
Qile Fang,
Xufeng Zhou*,
Hailiang Cao and
Zhaoping Liu*
Ningbo Institute of Materials Technology and Engineering (NIMTE), Chinese Academy of Sciences (CAS), Ningbo 315201, P. R. China. E-mail: zhouxf@nimte.ac.cn; liuzp@nimte.ac.cn
First published on 15th February 2016
Abstract
Pore size is a critical parameter that affects the basic physicochemical properties and applications of porous graphene foam, but the preparation of graphene foam with controllable pore size is still a big challenge, especially by a self-assembly method. In this work, graphene oxide (GO) sheets with different lateral sizes by controlling the delamination conditions of graphite oxide were used as building blocks to form graphene foams with adjustable pore size, by a convenient one-step hydrothermal self-assembly method. The pore sizes of graphene foams can be effectively controlled by simply altering the sheet sizes of GO, and the smallest average pore size is ∼500 nm, which is much smaller than the micrometer-scale pores in the reported graphene foam materials. Static contact angles, nitrogen adsorption–desorption isotherms and adsorption of methylene blue are measured to demonstrate the strong dependence of some important physicochemical properties of graphene foams on their pore sizes. This simple method offers a novel way to rationally synthesize graphene foam with appropriate pore size for various practical applications.
Introduction
Recently, graphene has been attracting tremendous attention due to its unique properties, such as excellent electron transfer kinetics, ultra high specific surface area (SSA), good mechanical strength, and superior chemical stability.1–4 These remarkable characteristics of graphene make it a promising candidate for energy storage, water purification, flexible electronics, sensing devices, etc.5–13 To take full advantage of graphene's superior properties into practical applications, graphene sheets, as a fantastic 2D nanomaterial, are preferred to be integrated into macroscopic structures. Therefore, many recent researches have focused on preparation and application of macroscopic graphene assemblies.14–18 Monolithic 3D porous graphene foam is one of the most popular forms of macroscopic graphene structures investigated in recent years.19–23 The interconnected porous structures of bulk graphene foam, allied with the nature of graphene sheets, provides unique physiochemical properties, such as 3D networks of high electricity and compressibility, which enable graphene foam to have widespread applications.15,18,24–28 In this regards, graphene foam composed of 2D graphene sheets has been extensively studied.Templating and self-assembly methods are two main routes to produce graphene foams.29–34 In the term of templating method, challenges still exist for choosing appropriate templates with high uniformity in size and low cost. Meanwhile, an additional procedure to remove sacrificial templates is always needed. In contrast, self-assembly methods, such as hydrothermal method, ice-driving self-assembly, and vacuum filtration, can offer a more convenient, effective and economic way to obtain graphene foams.16,17,25,31,34–36 Especially the hydrothermal method, which was firstly reported by Shi and co-workers, has now been widely used as an convenient route to assemble graphene sheets into graphene foam with porous networks, which endows graphene foam with excellent performances as well as practical application value.36
Pore size is one of the most critical structure parameters of porous graphene foam.17,25,37–39 The appropriate sizes of pores in graphene foam can expolit specific potential applications in many fields such as heterogeneous catalysis, adsorption/separation and so on.37,39,40 Thus, so far, several approaches have been proposed for the synthesis of graphene foams with controllable pore size for different applications. For example, Choi et al. fabricated macroporous graphene foam by using polystyrene (PS) colloidal particles as a sacrificial template. The removal of PS particles left behind an open porous structure with uniform pore size of ∼2 μm.32 Compared to templating method which is effective but complicated to tune the pore size, self-assembly method has emerged as a convenient route to achieve this goal. Lee and co-workers reported a straightforward self-assembly method to achieve 3D macroporous structures from polymer-grafted graphene oxide (GO) platelets dispersed in benzene.30 The dispersion was casted onto a suitable substrate and exposed to a stream of humid air. The spontaneous incorporation of water droplets on the air/liquid interface generated a macroporous structure. The pore sizes could be effectively controlled by changing the concentration of precursor solution or the chain lengths of grafted polymers on GO. However, the synthesis procedures of 3D macroporous graphene are extremely dependant on the air humidity, and it is difficult to achieve bulk 3D graphene macroporous materials by this means. Another examples is that Ahn et al. fabricated graphene foams with controllable pore sizes from reduced graphene oxide (rGO) colloidal suspension through a nucleate boiling method at different heat fluxes. The bubbles generated from the boiling rGO solutions helped to form porous structure.33 However, the boiling process needs additional equipments and specific substrate (Si, SiO2 and Pt) for the deposition of macroporous graphene foams, which makes it inconvenient to operate. Hydrothermal method is an easy way to fabricate porous graphene foam, but the pore sizes lie in a wide range from submicrometer to over tens, even hundreds of micrometers, which is uncontrollable, and unsuitable for practical applications.26,36,39,40 Recently, 3D graphene architecture with controllable pore structures are fabricated through a novel interface self-assembly method.41 However, gold substrate with surface modification is required to the formation of porous graphene, and only thin porous graphene film with a thickness of ∼15 μm can be obtained. Despite the fact that efforts have been taken to regulate pore sizes of graphene foam during the self-assembly process, it is still not easy to acquire uniform pore size with convenient experimental process. In addition, the reported pore sizes of self-assembled graphene foams in current literatures mainly lie in the dimension of several microns to tens of microns, which are usually too large than required for mass transportation and reduce the utilization rate of pores in various applications, such as energy storage and catalysis. As far as we know, no successful graphene foams with uniform pore size down to nanometer scale have been reported. Hence, paving an easy way for fabrication of graphene foam with controlled pore sizes still presents significant challenges, and new approaches for reasonable design of pore sizes are urgently required for better use of graphene foams.
In the self-assembly process, GO sheets as the nano building blocks connect with each other to form a porous network and finally become the pore walls in graphene foam, thus it leads us to hold the view that sheets sizes of GO should have close relationship with the pore sizes. Herein, we present the control of the pore sizes of graphene foams by simply altering the sheet sizes of GO without any additives. GO sheets with three different sheet sizes in the range from sub-micrometers to tens of micrometers were prepared by controlling the delamination conditions of graphite oxide, and then used as precursors and building blocks to form graphene foams with different pore sizes by convenient one-step hydrothermal method. The pore sizes are close to the sheet sizes, and the smallest average pore size is ∼500 nm, which is much smaller than micrometer-scale pores in reported graphene foam materials. To further demonstrate the possible physicochemical properties of graphene foams effected by pore size, static contact angles, nitrogen adsorption–desorption isotherms and adsorption of methylene blue are measured. This method offers us a facile way to systematically and rationally tune the pore sizes of graphene foams for various application purposes.
Experimental section
Preparation of graphene oxide with different sheet sizes
Graphite oxide was prepared by oxidizing natural graphite flakes of 250 mesh size (corresponding to a mean lateral size of 50 μm) based on modified Hummers method, and the typical synthetic procedure were described in our previous report.42 The large-size GO sheets suspension was prepared as following. 40 mL of the as-prepared 6 mg mL−1 graphite oxide suspension was transferred into a conical beaker with a volume of 100 mL. Then the suspension was gently shaken in a mechanical shaker (SHA-C, Guohua Corp., China) at a speed of 160 rpm for 6 h. After removing the small amount of unexfoliated particles by centrifugation, a brown and homogeneous colloidal suspension of GO sheets was obtained and diluted to different concentrations (0.5, 1, 2 or 4 mg mL−1). The medium-size GO sheets aqueous dispersion was prepared by sonicating 20 mL of graphite oxide aqueous dispersions for 5 min using an ultrasonic cell disruptor with the power of 500 W. The small-size GO sheets aqueous dispersion was obtained by further elongating the ultrasonication time to 1 h using the same instrument.Fabrication of graphene foams
20 mL of GO suspensions (0.5, 1, 2 or 4 mg mL−1) were sealed in 100 mL Teflon autoclaves, which was then placed in the oven, and maintained at 180 °C for 12 h. After cooling to room temperature, monolithic graphene hydrogels were collected and freeze-dried to obtain graphene foams.Characterization of graphene foams
The morphology and structure of the samples were analyzed by a Hitachi S-4800 field emission scanning electron microscopy (SEM). Atomic force microscopy (AFM) characterization was conducted by a Veeco Dimension 3100V scanning probe microscope at ambient conditions using a tapping mode. The nitrogen adsorption–desorption isotherms were recorded by Micromeritics ASAP-2020M nitrogen adsorption apparatus. The static contact angles (SCAs) were measured using the static sessile drop method on Data physics OCA20. SCAs measurements were tested at 5 different locations on each graphene foam sample at room temperature.MB and oil adsorption
24.5 mg of graphene foams were put into 16 mL of 0.1 g L−1 methylene blue (MB) solution (DI water as the solvent), and as the control tests, ∼14 mg of graphene foams were put into 16 mL of 0.2 g L−1 MB solution. Then the suspensions was sealed in bottles with a volume of 20 mL and gently shaken in a thermostatic mechanical shaker at a speed of 120 rpm at 25 °C ± 1 °C for 18 h. After 18 hours, a UV-vis spectrophotometer (Lambda 950) was used to measure the concentration of MB solutions, which was calculated by the absorbance at 664 nm. The adsorbed capacity (q1) of MB was calculated as| q1 = (Co − Ct) × V/m |
14–16 mg of graphene foams were soaked into 20 mL toluene solution and sealed in bottles for 3 h. After that the weight of toluene/graphene foam was measured with balance. The adsorbed capacity (q2) of toluene was calculated as
| q2 = (Wt − W0)/W0 |
Result and discussion
In our experiment, natural graphite flakes of 250 mesh (corresponding to ∼50 μm in lateral size) are employed as the starting material. As usual, GO sheets are obtained by delaminating graphite oxide suspensions. The sheet size of GO can be tuned by controlling the experimental conditions of the delamination process. Our group previously reported a modified delamination process based on mechanical shaking instead of ultrasonication to control the size of GO sheets.42 This gentle mechanical shaking method avoids the breakage of GO sheets and keeps the GO sheets intact. In contrast, traditional ultrasonication process tears GO sheets into small pieces. In this work, we used either mechanical shaking or ultrasonication to delaminate graphite oxide to GO sheets with different sizes. In order to obtain large-size GO sheets (L-GOs), graphite oxide was delaminated in the aqueous solution by gentle shaking using a mechanical shaker. The typical AFM image of as-prepared L-GOs sample is shown in Fig. 1a. The height profile in Fig. 1a indicates that GO sheets possesses a mean thickness of ∼1.0 nm, corresponding to single layer, and the typical lateral size of L-GOs is larger than 10 μm. Conventional ultrasonication process was used to achieve GO sheets with smaller size, and the longer the ultrasonication time is, the smaller the GO sheets are.43 Medium-size GO sheets (M-GOs) are prepared by ultrasonicating graphite oxide aqueous dispersions for 5 min with a ultrasonication power of 500 W, and small-size GO sheets (S-GOs) are obtained by prolonging the ultrasonication time to 1 h with the same power. The mean thickness of M-GOs (Fig. 1b) and S-GOs (Fig. 1c) are the same as that of L-GOs, suggesting thorough delamination of graphite oxide into single layer GO. Their AFM images also demonstrate that majority of M-GOs have the sheet size of ∼2 μm, and S-GOs possess much smaller size of hundreds of nanometers. In previous works, it has been reported that the aspect ratio of GO sheets is considered to be a key factor that determines the possible formation of GO liquid crystals (GOLCs).44,45 The individual GO sheets with larger aspect ratio have a stronger tendency to form GOLCs. Due to the remarkable difference of sheet size among three samples with similar thickness, their aspect ratio varies significantly. The corresponding average aspect ratio of L-GOs, M-GOs and S-GOs are 104, 2 × 10³ and 5 × 10², respectively. At a constant concentration of 4 mg mL−1, both L-GOs (Fig. S1a†) and M-GOs (Fig. S1b†) aqueous dispersions in glass bottles display clear anisotropic textures, typical of GOLCs, whereas S-GOs aqueous dispersion (Fig. S1c†) has no visual anisotropy, which is suggestive of the absence of anisotropic alignment of such small GO sheets in the solution. To further verify whether liquid crystal is formed in GO suspensions, polarized-light optical microscopy (POM) was employed to detect the characteristic birefringence of possible GOLCs. The POM images of L-GOs (Fig. S2a†) and M-GOs (Fig. S2b†) aqueous dispersions in capillary show typical macroscopic colorful textures, indicating the formation of liquid crystals. In contrast, there is no evident emergence of microscopic birefringence in the POM image of S-GOs (Fig. S2c†), suggesting that small GO sheets with a concentration of 4 mg mL−1 still does not reach the critical point to form liquid crystals. The above results further reflect the obvious difference of sheet size for three GO samples.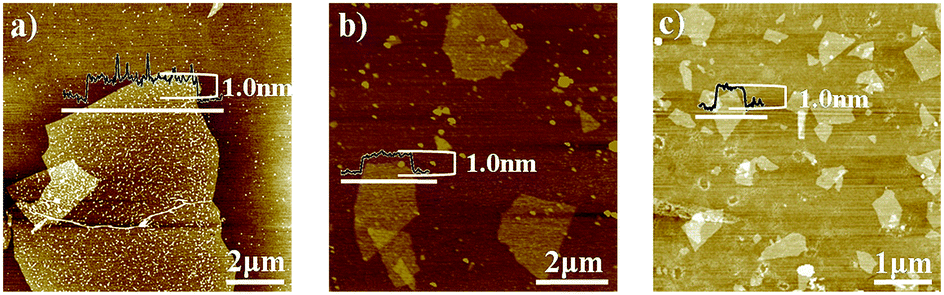 | ||
| Fig. 1 AFM images of L-GOs (a), M-GOs (b) and S-GOs (c). | ||
All three GO suspensions (4 mg mL−1) then underwent a hydrothermal treatment to form graphene foams according to reported methods.36 During hydrothermal-induced self-assembly, GO sheets were reduced by H+ generated from superheated water under hydrothermal condition.35 On one hand, the π–π interaction and regional hydrophobicity gave rise to random stacking between rGO sheets, and on the other hand, the residual oxygen groups empowered them to capture water into networks. Then the captured water was removed by freeze-drying to obtain graphene foams (Fig. S3a–c†). It is interesting to find that the volume of graphene foams decreases with the reduction of the sheet size of GO. The pore size of graphene foam also varies a lot along with the change of the sheet size of GO building blocks. SEM image (Fig. 2a and d) of graphene foam prepared from L-GOs (named L-GF) shows that it has slit-like pore structures made up of randomly stacked rGO sheets and has pore size of ∼10 μm, similar as the sheet size of L-GOs. However, at the same magnification, it is vague to see the pore structure of graphene foam derived from M-GOs (named M-GF) in Fig. 2b, and we can barely distinguish individual pores of graphene foam obtained using S-GOs (named S-GF) in Fig. 2c. SEM images with higher magnification clearly display that the pore sizes of M-GF distribute in the range of 2–5 μm (Fig. 2e), and S-GF has a much smaller mean pore diameter of ∼500 nm (Fig. 2f). The uniformity of the pore size and pore structure within the entire foams is further identified by SEM images of the interior pore structures of L-, M- and S-GFs along two different directions (Fig. S4†). The pore structures along horizontal and vertical directions are almost identical for as-prepared L-, M- and S-GFs, suggesting that pores in all graphene foams distribute uniformly at a large scale. The above results evidently demonstrate the strong dependence of pore size of graphene foam on the sheet size of GO.
 | ||
| Fig. 2 SEM images with different magnifications of L-GF (a and d), M-GF (b and e) and S-GF (c and f). Inset in (f) is the SEM image of S-GF with higher magnification. | ||
In previous reports, it was found that the structure of graphene foam is strongly dependent on the concentration of GO suspension.36 Only powdery products were formed if the concentration of GO suspension was not sufficient to realize homogenous crosslinking of GO sheets. We also investigated the relationship between the concentration of GO suspension and the pore structure of graphene foam in our experiments. S-GOs suspensions with concentrations of 0.5, 1.0 and 2.0 mg mL−1 also underwent same hydrothermal treatment. Fig. S5 and S6† show the optical photographs and SEM images of the products. The result of the 0.5 mg mL−1 S-GOs shown in Fig. S5a† is consistent with that of the previous report.36 GO suspension at such low concentration resulted in the powder form rather than the macroscopic cylinder as that obtained at the S-GO concentration of 4.0 mg mL−1. In Fig. S6a,† the SEM image shows that the graphene powder is consisted of partial cross-linked rGO sheets with no visual porous structure. When the concentration of S-GOs suspension was increased to 1.0 mg mL−1, the macroscopic graphene foam was obtained (Fig. S5b†). However, uniform nano-sized pores as that in the case of 4.0 mg mL−1 S-GO was not observed in this sample. Instead, pores with wide size distribution in the range from submicrometers to several micrometers are formed (Fig. S6b†), which suggests that GO suspension at this concentration is still not sufficient enough to achieve homogeneous cross-linking under hydrothermal conditions. If the concentration was further increased to 2 mg mL−1, the identical pore structure and pore size (Fig. S6c†) as that observed for 4 mg mL−1 S-GO were acquired. These results effectively identify that a minimal concentration of GO suspension is required if homogeneous self-assembly of GO nano building-blocks to the formation of GO foam with uniform porous structure needs to be achieved.
The similarity between the pore size and lateral size of GO sheets is verified, which can be easily understood by considering GO sheets as nano-building blocks that constitute the pore walls of graphene foam, and offers an easy and effective strategy to design and tune the pore size of graphene foam. By theoretical analysis, it is easy to deduce that for porous networks with a constant volume, the areas of pore walls enlarges when the pore size reduces, which thus can explain the observed volume shrinkage of monolithic graphene foams along with the decrease of the sheet sizes of GO at a constant weight concentration. It should be pointed out that the decrease of the pore size is also accompanied by the change of the morphologies of individual pores in graphene foams. As mentioned above, the large pores in L-GF have anisotropic flat slit-like pore structure. However, the nano-sized pores in S-GF possess isotropic cage-like morphology. The pore structure in M-GF with medium pore size can be regarded as a transition state between L-GF and S-GF. The aspect ratio of GO sheets may be the main reason for the transition of pore morphology. The larger the size of GO, the higher possibility to form anisotropic flat slit-like pore structure.
To further study the relationship between the lateral size of GO sheets and pore size of graphene foams, two mixed suspension of L-GOs and S-GOs with the L-GO/S-GO weight ratios of 1![[thin space (1/6-em)]](https://www.rsc.org/images/entities/char_2009.gif) :5 and 1:2 were prepared and hydrothermally treated, respectively. As shown in the SEM images (Fig. S7a and b†) of as-prepared graphene foams, two types of pores with distinctively different pore size coexist in both samples. The large pores have the sizes similar to those in the L-GF, whereas small pores similar to those in the S-GF. With the increase of the L-GOs content, the proportion of large pores also rises. SEM images with higher magnifications (Fig. S7c and d†) further verify the local pore structure, especially the structure characteristics at the boundary between large and small pores. It can be clearly seen that individual large size pores are surrounded by quite a few small size pores. The wall of large pores is composed of intact large GO sheets and has relatively smooth surface. Fig. S4d† more distinctly shows the distribution of a large number of small pores between the walls of two adjacent large pores. Such interesting results suggest that no matter what ratio of the GO sheets with different sizes is, GO sheets tend to assemble with those having similar size to form either large or small pores, rather than mix together homogeneously to generate pores with random pore size. Obviously, the results further indicate that the lateral size of GOs is the critical parameter that determines the pore size in graphene foams obtained by hydrothermal induced self-assembly of GOs. The possible relationship between size of GO sheets and pore sizes of GFs was plotted in Fig. S8.† The targeted pore sizes of GFs can be acquired by controlling the original sizes of GO sheets according to this relationship.
:5 and 1:2 were prepared and hydrothermally treated, respectively. As shown in the SEM images (Fig. S7a and b†) of as-prepared graphene foams, two types of pores with distinctively different pore size coexist in both samples. The large pores have the sizes similar to those in the L-GF, whereas small pores similar to those in the S-GF. With the increase of the L-GOs content, the proportion of large pores also rises. SEM images with higher magnifications (Fig. S7c and d†) further verify the local pore structure, especially the structure characteristics at the boundary between large and small pores. It can be clearly seen that individual large size pores are surrounded by quite a few small size pores. The wall of large pores is composed of intact large GO sheets and has relatively smooth surface. Fig. S4d† more distinctly shows the distribution of a large number of small pores between the walls of two adjacent large pores. Such interesting results suggest that no matter what ratio of the GO sheets with different sizes is, GO sheets tend to assemble with those having similar size to form either large or small pores, rather than mix together homogeneously to generate pores with random pore size. Obviously, the results further indicate that the lateral size of GOs is the critical parameter that determines the pore size in graphene foams obtained by hydrothermal induced self-assembly of GOs. The possible relationship between size of GO sheets and pore sizes of GFs was plotted in Fig. S8.† The targeted pore sizes of GFs can be acquired by controlling the original sizes of GO sheets according to this relationship.
Nitrogen adsorption–desorption measurement was then carried out to further study the pore structure of graphene foams with different pore sizes. The type III nitrogen adsorption–desorption isotherms (Fig. 3a) imply that all three graphene foams are composed of macropores. The BET SSAs of three samples plotted in Fig. 3b were calculated from the adsorption branch, and the results are 97.5 m2 g−1, 262.8 m2 g−1 and 401.8 m2 g−1 for L, M, and S-GF, respectively. The maximum adsorbed quantity demonstrates that S-GF own the highest pore volume, and the BJH cumulative pore volumes of L, M and S-GF are 0.256 cm3 g−1, 0.355 cm3 g−1 and 1.390 cm3 g−1, respectively. The increasing SSAs and pore volume along with the decrease of the GO size may stem from the different nature of GO sheets with different aspect ratio in the solution. The tendency and probability of restacking and folding is expected to raise when the aspect ratio of GO or rGO increases. Consequently, larger GO sheets may induce smaller exposed surface after they are self-assembled into graphene foams because of more severe restacking or folding, triggering lower SSA of L-GF than that of S-GF.
 | ||
| Fig. 3 (a) The nitrogen adsorption–desorption isotherms of the graphene foams. (b) The histogram of the BET SSAs of graphene foams. | ||
The difference of pore sizes also causes different surface wettability of graphene foams. Static contact angles (SCAs) of graphene foams were measured at room temperature. It should be pointed out that, even though the resulted graphene foams are partially reduced (the C/O ratio was presented in Table S1†) during the hydrothermal process, the relatively high hydrophilic of graphene foams remains a challenge to precisely measure SCAs. Accordingly, freeze-dried graphene foams were then annealed at 800 °C for 1 hour in Ar atmosphere to further reduce rGO to improve their hydrophobicity. The SEM images for graphene foams after annealing are shown in Fig. 4a–c, which reveal that the inner network and pore sizes remain the same as those of hydrothermal products. The photographs of the droplets (Fig. 4d–f) on the surfaces of graphene foams display that the SCA increases with the reduction of the pore sizes. L-GF has the smallest SCA of 97.0°, whereas S-GF possesses the largest one of 125.9°. In our work, owing to the hydrophobicity of annealed graphene foams, the water drop can suspend on the top of porous structure. Similarly, the water droplets also can sit on the lotus leaf owing to the air pockets entrapped by the interesting surface structures, which is referred as the Fakir state in nature. It can be identified by the SEM images that the entrapped air pockets in S-GF is the most intensive among all three samples, which is in accordance with the micro/nano surface structures in the Fakir state. Thereby, the smaller the pore size, the more hydrophobic surface of the graphene foam is. This phenomenon also has been reported in Lee's work.38
 | ||
| Fig. 4 SEM images and static contact angles of L-GF (a and d), M-GF (b and e), and S-GF (c and f) after annealing at 800 °C for 1 hour. | ||
Methylene blue (MB) adsorption experiments were carried out to demonstrate the adsorption capability of graphene foams with different pore sizes, and the results are shown in Fig. 5. It can be found that after 18 hours of thermostatic mechanical shaking, the deep blue color of 0.1 g L−1 original MB solutions contained ∼24.5 mg of graphene foams with different pore sizes fades obviously, which can be identified by eyes. This also can be verified by the UV-vis spectra (Fig. 5a). The removal rate of MB was calculated to be 88.1%, 97.2% and 98.5% for L, M, and S-GF, respectively. There are no significant differences in adsorption capacity among three samples, which might be the consequences that saturated adsorption capacity was higher than the original concentrations of MB, so that they can remove almost all MB from solutions. In order to clearly manifest the effect of pore structure of graphene foams on their adsorption performances, the original concentrations of MB solutions were doubled and the weight of graphene foams was decreased to ∼14 mg. As is shown in Fig. 5b, we can identify that the MB solution contained three graphene foams with difference pore sizes show apparently different color fading degrees. The corresponding adsorbed amounts of MB calculated from UV-vis spectra are 90.70 mg g−1, 175.10 mg g−1 and 215.35 mg g−1 for L, M, and S-GF, respectively. Obviously, the outstanding adsorption ability of S-GF mainly arises from its extremely high SSAs (401.18 m2 g−1). As mentioned above, GO sheets with smaller size are more effective to avoid the fold and restacking problems, thereby largely preserves the high surface area, acquiring high adsorption capacity. Thus, the exposed surface of rGO sheets is crucial for MB adsorption, and SSA of graphene foam can be referred as an important parameter that determines its adsorption capacities. However, the MB adsorption amount based on unit surface area of graphene foams decreases along with the reduction of their pore sizes, and the corresponding values for L, M, and S-GF are calculated to be 0.93 mg m−2, 0.67 mg m−2, and 0.54 mg m−2, respectively. As all three graphene foams underwent identical reaction processes, which ensures that they possess the same surface properties, the pore sizes of the three graphene foams might be the critical reason that determines the MB adsorption amounts per unit surface area. Larger pores are expected to be favorable for faster mass transfer in respect of diffusion kinetics. Hence more MB molecules can be transferred to the interior surface of L-GF than that of M-GF and S-GF within unit time, resulting in larger adsorption amount of MB per unit surface area before apparent equilibrium is reached. Apparently, the large pores facilitate mass transfer, while the small ones are beneficial for adsorption capacities.
 | ||
| Fig. 5 UV-vis adsorption spectra of MB solutions after graphene foams adsorption for 18 h with an initial MB concentration of 0.1 g L−1 (a) and 0.2 g L−1 (b). (c) Histogram of the adsorption capacity of graphene foams at different MB concentrations. | ||
Oil (toluene) adsorption experiments were conducted to further characterize the pore size dependent physicochemical properties of graphene foams. As shown in Fig. 6a, the oil adsorption capacity is positively related with the pore size of graphene foams, in contrast to MB adsorption. Fig. 6b further demonstrates that the adsorption capacity of oil is determined by the density (ρ) of GFs rather than SSAs, which is also different from MB adsorption. It can be easily understood as the different adsorption mechanism of oil and MB molecular in graphene foams. The adsorbed oil is more likely to be stored into pores (namely cavities occupied by air), whereas the adsorbed MB molecules are preferred to strongly adhere on graphene sheets (namely pore walls) by electrostatic attraction and π–π interaction. As a result, under the same adsorption condition, the low density GFs (L-GFs) is able to absorb more oil than high density S-GFs. The above demonstrations indicate that it is important for researchers to choose the appropriate pore sizes of graphene foams for varied application, and the facile way to tune pore sizes presented in this work may provide a new alternative.
 | ||
| Fig. 6 (a) Histogram of the adsorption capacity of graphene foams for oil (toluene). (b) The corresponding relationship between density of graphene foams and adsorption capacity of oil (toluene). | ||
Conclusion
We have prepared graphene foams with controllable porous sizes from tens of microns to submicrons via hydrothermal method by tuning the lateral sizes of GO sheets without any additives. The pore size of the graphene foam are strongly correlated with the sheet sizes of GO, and graphene foam with uniform pore sizes as small as ∼500 nm can be successfully prepared. The significant difference in gas adsorption properties, static contact angles and methylene blue adsorption properties of graphene foams with different pore sizes evidently indicates that pore size is a critical structural parameter that determines basic physiochemical properties as well as potential applications of porous graphene foam. The simple method proposed in this paper paves a novel strategy to rationally design the structure of graphene-based materials with porous networks, which have potential applications in energy storage, water purification, catalysis, etc.Acknowledgements
This work was supported by National Natural Science Foundation of China (Grant No. 21201173 and No. 21371176), Key Research Program of the Chinese Academy of Sciences (Grant No. KGZD-EW-T08) and Ningbo Science and Technology Innovation Team (Grant No. 2012B82001).Notes and references
- K. S. Novoselov, A. K. Geim, S. V. Morozov, D. Jiang, Y. Zhang, S. V. Dubonos, I. V. Grigorieva and A. A. Firsov, Science, 2004, 306, 666 CrossRef CAS PubMed.
- K. S. Novoselov, A. K. Geim, S. V. Morozov, D. Jiang, M. I. Katsnelson, I. V. Grigorieva, S. V. Dubonos and A. A. Firsov, Nature, 2005, 438, 197 CrossRef CAS PubMed.
- C. Lee, X. Wei, J. W. Kysar and J. Hone, Science, 2008, 321, 385 CrossRef CAS PubMed.
- C. N. Rao, A. K. Sood, K. S. Subrahmanyam and A. Govindaraj, Angew. Chem., Int. Ed., 2009, 48, 7752 CrossRef CAS PubMed.
- J. Liu, Z. Wang, Y. Zhao, H. H. Cheng, C. A. Hu, L. Jiang and L. T. Qu, Nanoscale, 2012, 4, 7563 RSC.
- Z. Wang, Y. Dong, H. Li, Z. Zhao, H. B. Wu, C. Hao, S. Liu, J. Qiu and X. W. Lou, Nat. Commun., 2014, 5, 5002 CrossRef CAS PubMed.
- Y. A. Samad, Y. Li, A. Schiffer, S. M. Alhassan and K. Liao, Small, 2015, 11, 2380 CrossRef PubMed.
- Y. Xu, Z. Lin, X. Zhong, X. Huang, N. O. Weiss, Y. Huang and X. Duan, Nat. Commun., 2014, 5, 4554 CAS.
- H. Liu, H. Wang and X. Zhang, Adv. Mater., 2015, 27, 249 CrossRef CAS PubMed.
- Y. Shen, Q. Fang and B. Chen, Environ. Sci. Technol., 2015, 49, 67 CrossRef CAS PubMed.
- H. Cao, X. Zhou, C. Zheng and Z. Liu, ACS Appl. Mater. Interfaces, 2015, 7, 11984 CAS.
- L. Liu, Y. Yu, C. Yan, K. Li and Z. Zheng, Nat. Commun., 2015, 6, 7260 CrossRef CAS PubMed.
- H. Cao, X. Zhou, C. Zheng and Z. Liu, Carbon, 2015, 89, 41 CrossRef CAS.
- Z. Tang, S. Shen, J. Zhuang and X. Wang, Angew. Chem., Int. Ed. Engl., 2010, 49, 4603 CrossRef CAS PubMed.
- Z. Chen, W. Ren, L. Gao, B. Liu, S. Pei and H. M. Cheng, Nat. Mater., 2011, 10, 424 CrossRef CAS PubMed.
- X. Yang, J. Zhu, L. Qiu and D. Li, Adv. Mater., 2011, 23, 2833 CrossRef CAS PubMed.
- Y. E. Shin, Y. J. Sa, S. Park, J. Lee, K. H. Shin, S. H. Joo and H. Ko, Nanoscale, 2014, 6, 9734 RSC.
- C. Zhu, T. Y. Han, E. B. Duoss, A. M. Golobic, J. D. Kuntz, C. M. Spadaccini and M. A. Worsley, Nat. Commun., 2015, 6, 6962 CrossRef CAS PubMed.
- Y. Wu, N. Yi, L. Huang, T. Zhang, S. Fang, H. Chang, N. Li, J. Oh, J. A. Lee, M. Kozlov, A. C. Chipara, H. Terrones, P. Xiao, G. Long, Y. Huang, F. Zhang, L. Zhang, X. Lepro, C. Haines, M. D. Lima, N. P. Lopez, L. P. Rajukumar, A. L. Elias, S. Feng, S. J. Kim, N. T. Narayanan, P. M. Ajayan, M. Terrones, A. Aliev, P. Chu, Z. Zhang, R. H. Baughman and Y. Chen, Nat. Commun., 2015, 6, 6141 CrossRef CAS PubMed.
- J. Xu, M. Wang, N. P. Wickramaratne, M. Jaroniec, S. Dou and L. Dai, Adv. Mater., 2015, 27, 2042 CrossRef CAS PubMed.
- Y. Xu, Z. Lin, X. Zhong, B. Papandrea, Y. Huang and X. Duan, Angew. Chem., Int. Ed., 2015, 54, 5345 CrossRef CAS PubMed.
- M. A. Worsley, S. J. Shin, M. D. Merrill, J. Lenhardt, A. J. Nelson, L. Y. Woo, A. E. Gash, T. F. Baumann and C. A. Orme, ACS Nano, 2015, 9, 4698 CrossRef CAS PubMed.
- T. Zhang, H. Chang, Y. Wu, P. Xiao, N. Yi, Y. Lu, Y. Ma, Y. Huang, K. Zhao, X.-Q. Yan, Z.-B. Liu, J.-G. Tian and Y. Chen, Nat. Photonics, 2015, 9, 471 CrossRef CAS.
- H. Hu, Z. Zhao, W. Wan, Y. Gogotsi and J. Qiu, Adv. Mater., 2013, 25, 2219 CrossRef CAS PubMed.
- H. Sun, Z. Xu and C. Gao, Adv. Mater., 2013, 25, 2554 CrossRef CAS PubMed.
- Y. Li, J. Chen, L. Huang, C. Li, J. D. Hong and G. Shi, Adv. Mater., 2014, 26, 4789 CrossRef CAS PubMed.
- Y. Zhao, C. Hu, L. Song, L. Wang, G. Shi, L. Dai and L. Qu, Energy Environ. Sci., 2014, 7, 1913 CAS.
- Y. Zhao, C. G. Hu, Y. Hu, H. H. Cheng, G. Q. Shi and L. T. Qu, Angew. Chem., Int. Ed., 2012, 51, 11371 CrossRef CAS PubMed.
- Q. Fang and B. Chen, J. Mater. Chem. A, 2014, 2, 8941 CAS.
- S. H. Lee, H. W. Kim, J. O. Hwang, W. J. Lee, J. Kwon, C. W. Bielawski, R. S. Ruoff and S. O. Kim, Angew. Chem., Int. Ed., 2010, 49, 10084 CrossRef CAS PubMed.
- L. Estevez, A. Kelarakis, Q. Gong, E. H. Da'as and E. P. Giannelis, J. Am. Chem. Soc., 2011, 133, 6122 CrossRef CAS PubMed.
- B. G. Choi, M. Yang, W. H. Hong, J. W. Choi and Y. S. Huh, ACS Nano, 2012, 6, 4020 CrossRef CAS PubMed.
- H. S. Ahn, J. W. Jang, M. Seol, J. M. Kim, D. J. Yun, C. Park, H. Kim, D. H. Youn, J. Y. Kim, G. Park, S. C. Park, J. M. Kim, D. I. Yu, K. Yong, M. H. Kim and J. S. Lee, Sci. Rep., 2013, 3, 1396 Search PubMed.
- X. Yang, C. Cheng, Y. Wang, L. Qiu and D. Li, Science, 2013, 341, 534 CrossRef CAS PubMed.
- Y. Zhou, Q. Bao, L. A. L. Tang, Y. Zhong and K. P. Loh, Chem. Mater., 2009, 21, 2950 CrossRef CAS.
- Y. X. Xu, K. X. Sheng, C. Li and G. Q. Shi, ACS Nano, 2010, 4, 4324 CrossRef CAS PubMed.
- Z.-L. Wang, D. Xu, J.-J. Xu, L.-L. Zhang and X.-B. Zhang, Adv. Funct. Mater., 2012, 22, 3699 CrossRef CAS.
- H. S. Ahn, H. Kim, J. M. Kim, S. C. Park, J. M. Kim, J. Kim and M. H. Kim, Carbon, 2013, 64, 27 CrossRef CAS.
- J. Zhao, W. Ren and H.-M. Cheng, J. Mater. Chem., 2012, 22, 20197 RSC.
- Z. S. Wu, S. Yang, Y. Sun, K. Parvez, X. Feng and K. Mullen, J. Am. Chem. Soc., 2012, 134, 9082 CrossRef CAS PubMed.
- L. Shi, Z. Chu, Y. Liu, W. Jin and N. Xu, Adv. Funct. Mater., 2014, 24, 7032 CrossRef CAS.
- X. Zhou and Z. Liu, Chem. Commun., 2010, 46, 2611 RSC.
- J. Russier, E. Treossi, A. Scarsi, F. Perrozzi, H. Dumortier, L. Ottaviano, M. Meneghetti, V. Palermo and A. Bianco, Nanoscale, 2013, 5, 11234 RSC.
- S. H. Aboutalebi, M. M. Gudarzi, Q. B. Zheng and J.-K. Kim, Adv. Funct. Mater., 2011, 21, 2978 CrossRef CAS.
- Z. Xu and C. Gao, ACS Nano, 2011, 5, 2908 CrossRef CAS PubMed.
Footnote |
| † Electronic supplementary information (ESI) available: Optical photographs of aqueous dispersions and GFs, POM images of GO and additional SEM images. See DOI: 10.1039/c5ra26088d |
| This journal is © The Royal Society of Chemistry 2016 |