
Hydrolytically stable ZIF-8@PDMS core–shell microspheres for gas–solid chromatographic separation†
Manju Srivastavaab,
Prasun Kumar Roy*a and
Arunachalam Ramanan*b
aCentre for Fire, Explosive and Environment Safety, DRDO, Delhi-54, India. E-mail: pk_roy2000@yahoo.com; Fax: +91 1123819547; Tel: +91 1123907191
bDepartment of Chemistry, Indian Institute of Technology Delhi, New Delhi-16, India. E-mail: aramanan@chemistry.iitd.ac.in; Fax: +91 1126581102; Tel: +91 1126591507
First published on 26th January 2016
Abstract
Metal organic frameworks (MOFs) with exceptionally high surface areas, shape selectivity and availability of multiple active sites are suitable materials to serve as solid stationary phase for chromatographic applications. Packed columns filled with conventionally prepared MOFs result in high pressure drops and low column efficiency, mainly due to the presence of small irregular shaped crystals and broader size distribution. In this paper, we report the successful utilization of the hydrolytically stable microcrystalline zinc imidazolate (ZIF-8), a well-known MOF immobilized on a thermally stable polymer i.e., polydimethylsiloxane (PDMS) for application as a stationary phase towards gas–solid chromatographic separations. A gas chromatography (GC) column (2 m × 2.5 mm) packed with the ZIF-8@PDMS core–shell microspheres demonstrate efficient separation of liquid and gas mixtures including xylene isomers and natural gas mixtures. We also successfully used the stationary phase for quantification of ethanol concentration in aqueous samples; the column did not undergo any structural change suggesting its excellent hydrolytic stability.
1. Introduction
Metal organic frameworks (MOFs) are a rapidly developing class of nanoporous materials which have numerous applications in diverse fields like adsorption, separation, catalysis, chemical sensing and gas capture to name a few.1–3 What bestows these materials excellent candidature for these applications is their salient features including ultra-high surface areas, possibility of pore structure modification and a high degree of chemical and thermal stability. Moreover, MOFs can be synthetically designed to create crystal structures analogous to that of zeolites, by rational choice of inorganic clusters and organic linkers.4 In addition to their high adsorption capacity, MOFs exhibit rather moderate heat of adsorption and hence call for mild regeneration conditions, which render them extremely suitable for chromatographic separations.2 However, a large number of MOFs collapse during exposure to water vapor or other gases.5 MOF 5, for example, cannot be used for detection of analytes in aqueous samples, as presence of trace levels of water (>2.3% v/v) lead to disruption of their structure.6 However, environmental samples are expected to contain much higher amounts of water, which mandates the use of hydrolytically stable MOFs for practical applications.In this context, zinc 2-methylimidazolate, Zn(MeIm)2 (popularly referred as ZIF-8), one of the most widely studied MOFs under the broad class of zeolitic imidazolates is reported to exhibit excellent stability towards hydrolysis, which has led to the exploration of its potential towards extraction of trace analytes from environmental samples.7,8 ZIF-8 features a sodalite topology (the Si–O–Si bonds in zeolites are replaced by Zn–Im–Zn bonds) with cavities of diameter 11.6 Å, connected via 6- and 4-ring apertures (Fig. 1).9 The framework exhibits remarkable structural flexibility and preference to adsorb larger molecules,10,11 excellent thermal stability (>550 °C) and chemical resistance towards organic solvents and boiling alkali.8 Core–shell ZIF-8 microspheres have been prepared and employed for interesting applications including adsorption of dyes.12–14 The studies clearly reveal that the ZIF-8 shell plays an extremely important role in controlling the access of guest molecules into the underlying substrate.
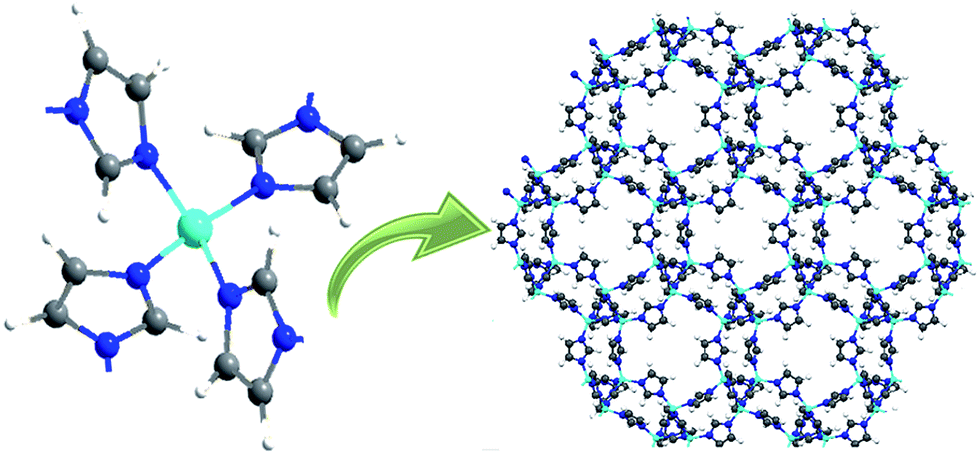 | ||
| Fig. 1 Secondary building unit and crystal structure of ZIF-8 (Zn: cyan; C: grey; H: white and N: blue). | ||
In view of the above, ZIF-8 has been employed for dehydration of alcohols through pervaporation, an application envisaged impossible using moisture sensitive MOFs.15 ZIF-8 has also been employed as the active phase for gas separation as mixed matrix membranes,16,17 stationary phase for high performance liquid chromatography (HPLC)18 and gas chromatographic (GC) separations.19
Large scale synthesis of MOFs, usually result in the formation of a polycrystalline powder,20,21 which cannot be used for practical applications as stationary phase for conventional packed chromatographic columns. Close packing of small irregularly sized particles22 result in huge pressure drops, particularly when the particles are associated with a wide particle size distribution. The effect of particle dimensions on pressure drop in a packed column is presented (Fig. S1 (ESI†)). For these reasons, chromatographic separation on MOFs are performed either on small columns or on capillary coated columns to evade the pressure drop issue.19,22,23
Earlier, we demonstrated efficient MOF based separations using conventional gas chromatographic columns by immobilizing MOFs on an inert polymeric core so as to increase the particle size suitably.24 As a proof of concept, we fabricated MOF 5@PDMS microspheres and effected efficient separations of gas and liquid mixtures including natural gas and permanent gases. However, the same could not be used for environmental applications for analyzing samples containing water. In this paper, we report the successful fabrication of hydrolytically stable ZIF-8 loaded PDMS microspheres and demonstrate the separation of gas liquid mixtures.
2. Materials and methods
2.1. Starting materials
Silicone macromonomer (Elastosil M4644) and platinum based hardener was obtained from Wacker, Germany. Polyvinylalcohol (PVA) (mol. wt 14![[thin space (1/6-em)]](https://www.rsc.org/images/entities/char_2009.gif) 000, CDH), zinc nitrate trihydrate (‘AR’ grade, E.Merck), chloroform (CDH), 2-methyl imidazole (mIM) (Sigma Aldrich) and ethanol (E.Merck) were used without any further purification. Distilled water was used throughout the course of study.
000, CDH), zinc nitrate trihydrate (‘AR’ grade, E.Merck), chloroform (CDH), 2-methyl imidazole (mIM) (Sigma Aldrich) and ethanol (E.Merck) were used without any further purification. Distilled water was used throughout the course of study.
2.2. Preparation of core shell ZIF-8@PDMS microspheres
PDMS microspheres were prepared using a batch suspension polymerization route as per the procedure reported previously.24–26 The resulting PDMS microbeads were employed as the underlying template for crystallising ZIF-8 on the surface. In view of the particle size requirement, the batch of PDMS microspheres obtained using 50% macromonomer concentration was used for the growth of ZIF8. Zinc nitrate and mIM and were first dissolved in water (mIM:Zn2+::1:4 molar ratio, 900 mL). PDMS microspheres (40 g) were slowly added to this solution with constant stirring at 600 rpm for 24 h at room temperature. The mother liquor was set aside for another 24 h, following which ZIF-8 loaded PDMS microspheres were obtained; the products were filtered, washed repeatedly with water and dried before use in chromatographic column.
2.3. Chromatographic separation using ZIF-8@PDMS microspheres
Core–shell microspheres were sieved through 60–80 mesh BSS to obtain particles of 177–250 μm, which were packed in a stainless steel column (2 m length × 2.5 mm ID) for evaluation of its efficacy towards chromatographic separation of gas and liquid mixtures. Prior to gas chromatographic analysis, the column was pre-activated under a continuous flow of argon at 200 °C for 24 h. A gas chromatograph (NUCON, India), equipped with TCD and FID was used for detection of the eluents. Standard gas and liquid mixtures were injected into the column and the response of TCD or FID detector was recorded to generate the gas chromatogram. Detailed composition of gas and liquid mixtures along with the conditions used for the GC analysis are presented (Tables S1–S6, ESI†).2.4. Characterization
FTIR spectra of samples were recorded in the wavelength range 4000–600 cm−1 using a Thermo Fisher FTIR (NICOLET 8700) analyser with an attenuated total reflectance (ATR) crystal accessory. The surface area of the microspheres was determined using N2 adsorption–desorption studies on a surface area analyzer (Micromeritics ASAP 2020). For this purpose, the sample was initially degassed under vacuum (10−6 Torr) at elevated temperature (200 °C) for 16 h following which nitrogen adsorbate was pulsed at 77 K. The crystalline phases were determined by powder XRD analysis on Bruker D8 advanced diffractometer using nickel filtered Cu Kα radiation. The data was collected with a step size of 0.02° and at count time of 1 s per step over the range of 2–60° (2θ value). Thermal degradation behavior was investigated using a Perkin Elmer Diamond STG-DTA-DSC under N2 atmosphere in the temperature range of 50–800 °C at a heating rate of 10 °C min−1 and a sample mass of 5.0 ± 0.5 mg were used for each experiment. Morphology of samples was studied using a scanning electron microscope (Zeiss EVO MA15) under an acceleration voltage of 20 kV. Samples were mounted on aluminium stubs and coated with gold and palladium (10 nm) using a sputter coater (Quorum-SC7620) operating at 10–12 mA for 120 s. The metal content in the core–shell microspheres was quantified using inductively coupled plasma based optical emission spectroscopy (Optima 2000, Perkin Elmer). For this purpose, an accurately weighed amount of core–shell microspheres were digested in acidic medium and the amount of Zn was quantified after extracting the metal into the aqueous phase.3. Results and discussion
In this paper, we report the separation of different gases and liquid mixtures over the prepared core–shell ZIF-8@PDMS, which have been subsequently employed as a stationary phase for gas chromatographic separations.3.1. Suspension curing of siloxane
Catalysed suspension polymerisation of vinyl terminated dimethylsiloxane, led to the formation of smooth silicone beads, detailed characterisation of which has been reported in our previous papers.25 Operating parameters like concentration of the macromonomer and stirring speed were found to exert a pronounced effect on the microsphere dimensions, with low stirring speeds and high macromonomer feed concentrations resulting in formation of microspheres with larger dimensions. By altering the operating parameters, the microsphere dimensions could be varied from 90 to 216 μm (ref. 25) (Fig. S2, ESI†).3.2. Effect of ZIF-8 loading on the microsphere dimensions and morphology
SEM image and the particle size distribution of a representative batch of silicone microspheres both before and after ZIF-8 loading is presented in Fig. 2. The SEM image of a single core–shell microsphere is presented (Fig. S3, ESI†). The zinc content was established using ICP analysis to be 10.5 ± 0.30 mg g−1, which corresponds to a ZIF-8 mass fraction of ∼4.1% in the microspheres (assuming PDMS microspheres of average diameter of 180 μm). The N2 adsorption–desorption isotherms of the ZIF-8 loaded PDMS microspheres and the core PDMS, as recorded by physisorption of N2 at 77 K, are presented in Fig. 3. The nonporous nature of the core was confirmed by the negligible volumetric uptake of N2 by the core silicone microspheres which in turn reflected in terms of the extremely low surface area of 8 m2 g−1. Loading of ZIF-8 on PDMS microspheres resulted in a significant increase in the volumetric N2 uptake and the BET specific surface area increased to 1290 m2 g−1. The adsorption–desorption isotherm revealed the characteristic microporous nature of ZIF-8.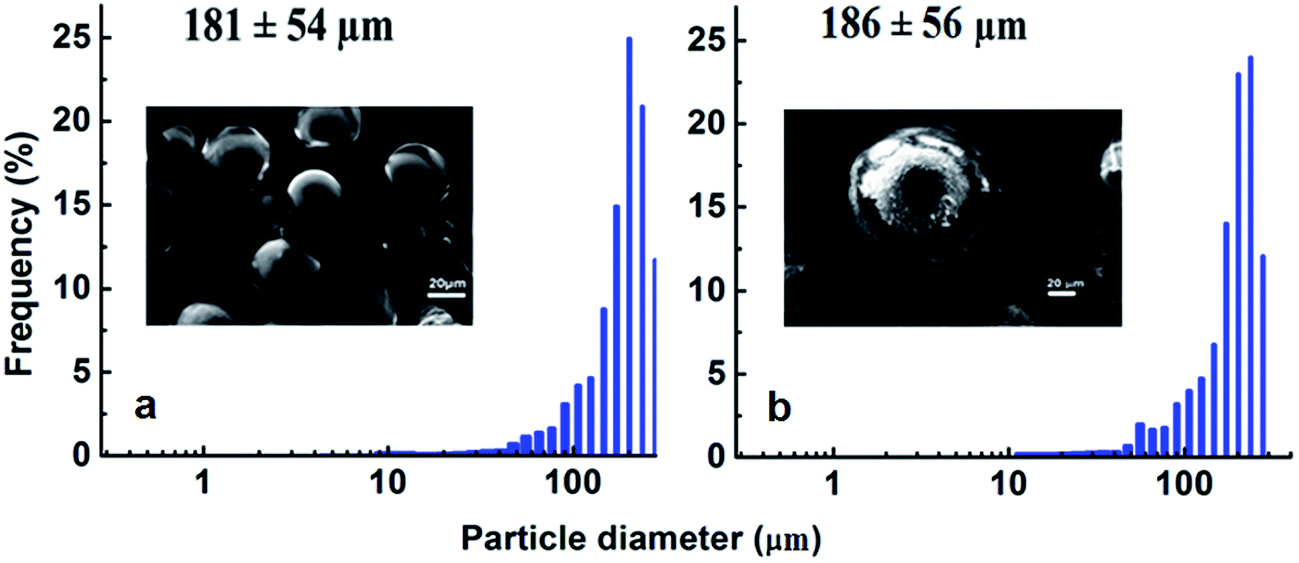 | ||
| Fig. 2 Particle size distribution of microspheres before and after ZIF-8 crystallisation. SEM image is presented in the inset. (a) PDMS core and (b) ZIF-8@PDMS core–shell microsphere. | ||
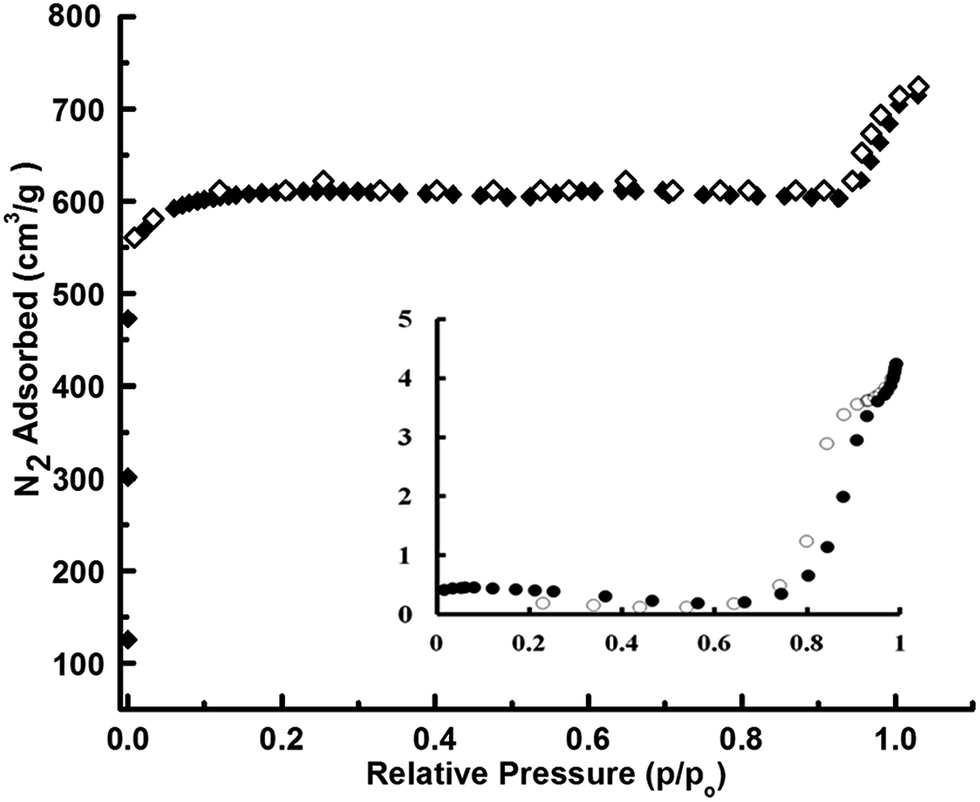 | ||
| Fig. 3 Nitrogen adsorption–desorption isotherm of ZIF-8@PDMS microsphere. Inset shows the isotherms of the underlying siloxane core. Filled and open symbols represent the adsorption and desorption branches respectively. | ||
The level of adherence of the ZIF-8 shell on the underlying PDMS template was estimated by soaking the microspheres in DMF for 30 min, followed by exposure to ultrasonic water bath (operating frequency 33 kHz) for 15 min. The ZIF-8 layer adhered strongly, with the extent of gravimetric mass loss being <2%. The PXRD pattern of the siloxane core is presented (Fig. S4a ESI†), which clearly reveals the amorphous nature of PDMS. On the other hand, distinct diffraction peaks were observed in the diffraction pattern of ZIF-8 loaded PDMS (Fig. S4b ESI†); the peak positions match with the simulated powder pattern of ZIF-8 based on the CIF (CCDC-7201498).
The TG traces of the underlying PDMS core and core–shell microspheres (ZIF-8@PDMS) are presented in Fig. 4, which clearly reveal the excellent thermal stability offered by the microspheres for practical applications till 500 °C.
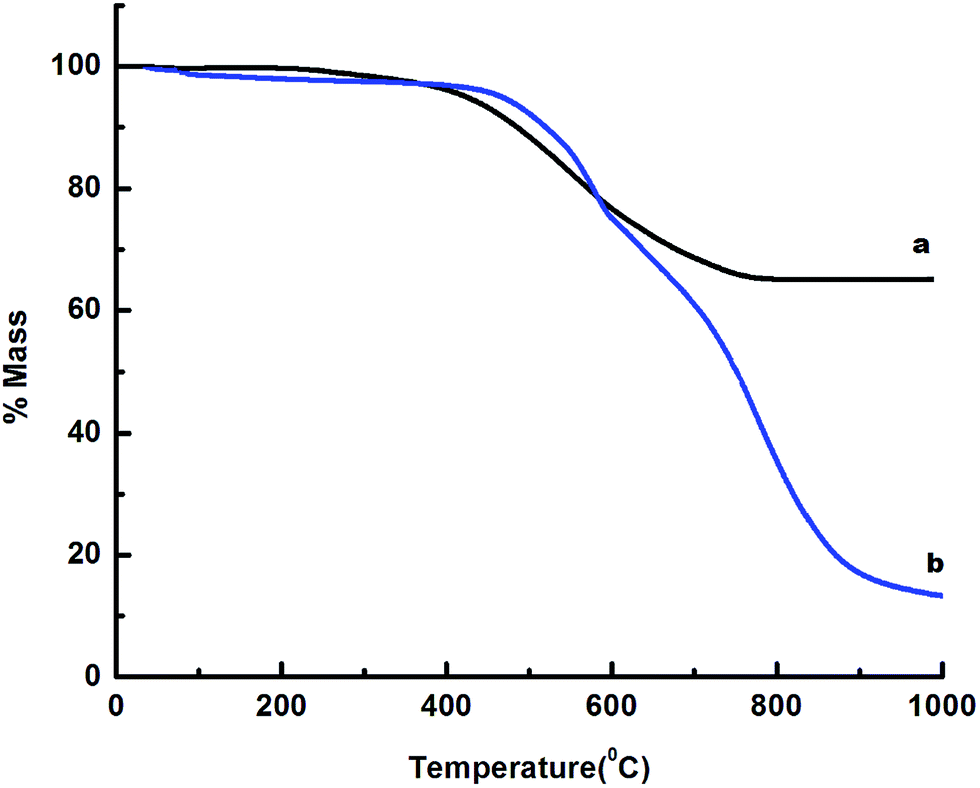 | ||
| Fig. 4 TG traces of (a) PDMS (b) ZIF8@PDMS. | ||
FT-IR analysis further confirmed the existence of ZIF-8 in the shell region of the microspheres. The FT-IR spectra of PDMS, both before and after ZIF-8 loading are presented in Fig. 5. In the FT-IR spectra of PDMS, characteristic absorption at 802 and 1258 cm−1 can be seen, which could be attributed to the (CH3)2SiO group vibration in the polymer. The FT-IR spectra of 2-methylimidazole is presented (Fig. S5, ESI†). Significant differences were observed in the spectra of ZIF-8 and the organic linker (mIM). The strong absorption band from 3400 to 2200 cm−1 with the maximum at 2650 cm−1 in the spectra of imidazole can be attributed the N–H–N hydrogen bond. The resonance between the N–H–N out-of-plane bending and the N–H stretching vibrations was observed at 1846 cm−1.27 The absence of this absorption band in the spectra of ZIF-8 suggests complete deprotonation of the imidazole moieties during the framework formation.
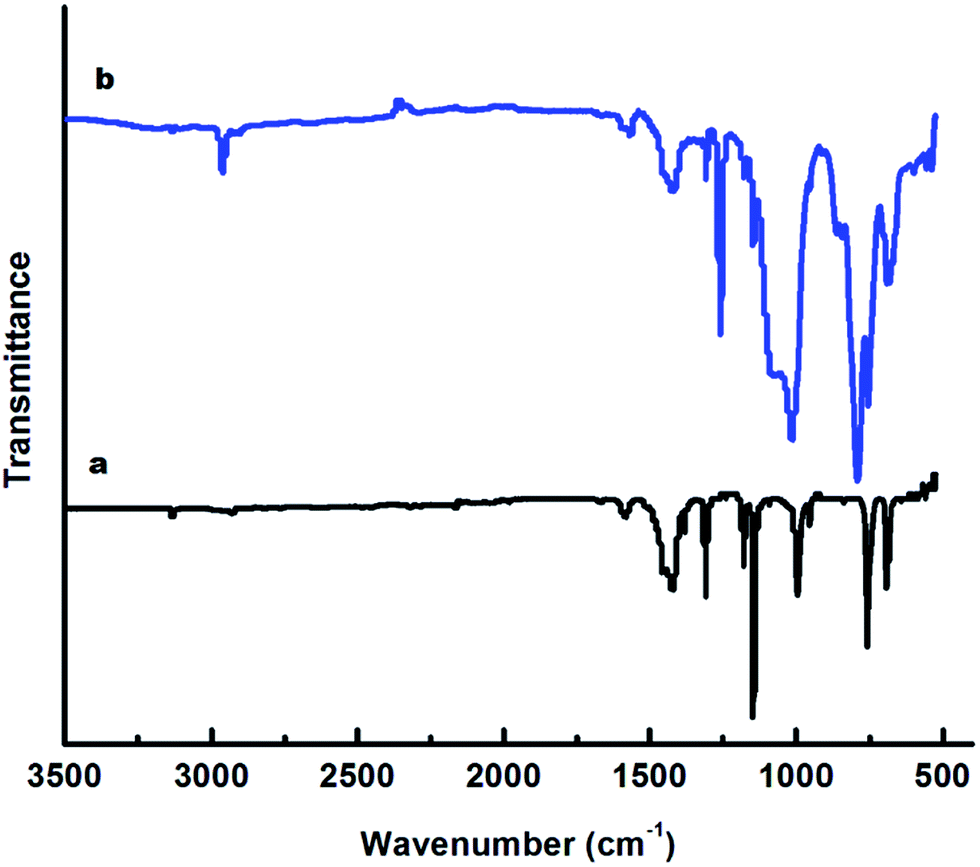 | ||
| Fig. 5 FT-IR spectra of (a) PDMS (b) ZIF8@PDMS. | ||
3.3. Gas-chromatographic separations
ZIF-8 on account of its hydrothermal and chemical stability, offers excellent candidature as a stationary phase for gas chromatographic separations. The separation of the following industrially important gas and liquid mixtures was effected on the fabricated ZIF-8@PDMS packed column.Natural gas, although composing primarily of methane, contains several other constituents including heavier hydrocarbons and CO2, the exact composition being dependent on the source of origin. From the vantage of environmental protection, the use of natural gas as a vehicular fuel is gaining more and more importance and so is its purification and analysis. Currently, natural gas analysis is the most widespread application field for Porous Layer Open Tubular (PLOT) chromatographic columns.28–30
The fabricated ZIF-8@PDMS packed column was employed to realize the separation of a natural gas mixture comprising of 79.37% methane, 6.72% ethane, 0.94% iso-butane, 1.31% n-butane, 0.19% n-hexane, 1.04% n-pentane, 8.09% propane and 2.34% CO2 (% v/v).29 For this purpose, 50 μL of gas mixture was injected into the packed column and the separation was effected under conditions mentioned in the ESI.† The TCD response obtained is presented in Fig. 6. The retention time of each component is also presented (see Table S1, ESI†). It is clear that all the components could be effectively separated using the ZIF-8@PDMS column.
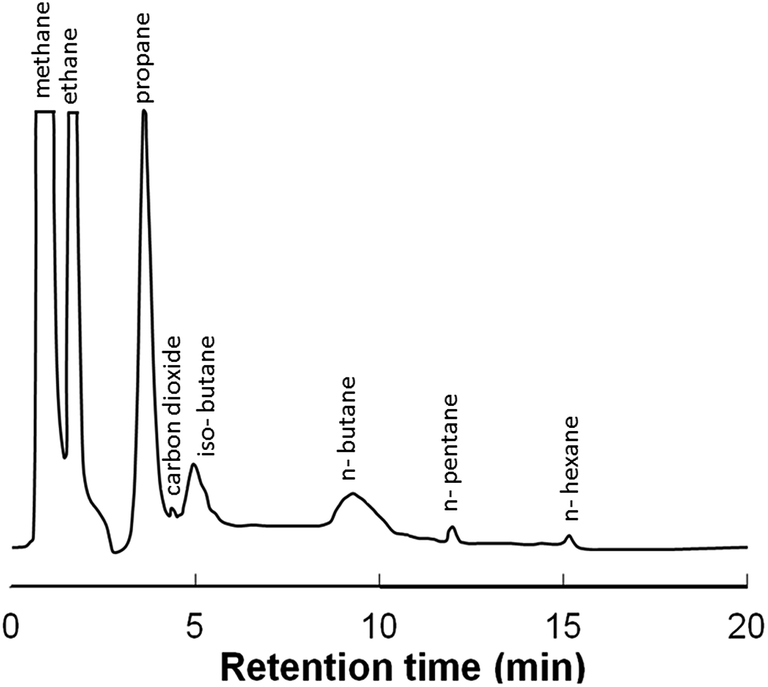 | ||
| Fig. 6 Gas chromatogram illustrating separation of natural gas mixture components. | ||
The structural flexibility of the ZIF-8 framework has been reported to permit adsorption and separation of molecules with dimensions much larger than the formal size of its inherent pores.31–33 Although the window size of the pore in ZIF-8 is estimated to be 3.4 Å from crystallographic data, the framework is flexible and open up to accommodate much larger molecules.34,35 In this context, ZIF-8 has been reported to separate hexane isomers based on a molecular sieving mechanism.32 Lately, adsorption of p-xylene (kinetic diameter, dk = 0.67 nm) within the pores of ZIF-8 has been investigated.31,36 We therefore considered it of interest to explore the potential of the developed ZIF-8 based column towards separation of xylene isomers which are extremely important raw materials for the chemical industry. In this context, p-xylene is used for the manufacture of terephthalic acid37 for the polyester industry, and o-xylene is consumed almost entirely for the manufacture of phthalic anhydride.
Several stationary phases have been employed for the gas chromatographic separation of xylene isomers including benzoquinoline,38 (5%-phenyl)-methylpolysiloxane,39 tetrachlorophthalate,40 1,8-diaminonaphthalene,41 liquid-crystalline compounds,42 b-cyclodextrin derivatives.43,44 However, extended analysis time is required40,41,45,46 and often mandate temperature programming.47 This has led to the exploration of potential of MOFs for xylene separation, including ZIF-8,36 MIL-101,48 MIL 47 (ref. 49) and MOF-5.50
The gas chromatogram obtained during separation of xylene mixtures using the developed ZIF-8@PDMS core shell microsphere, in terms of the FID response, is presented in Fig. 7. The retention time of each component is also presented (see Table S2, ESI†). It can be seen that the ZIF-8 coated PDMS microspheres could achieve a baseline separation of p-xylene, o-xylene and m-xylene within a relatively short period (6 min) not mandating any temperature programming. Since the molecular size of xylene isomers (0.67 to 0.74 nm) is larger than the pore window of ZIF-8 (3.4 Å), the possibility of molecular sieving by the framework appears to be rather improbable. The elution sequence was found to follow the order of decreasing boiling points (o-xylene (bp = 144 °C) > m-xylene (bp = 139 °C) > p-xylene (bp = 138 °C)) as has been observed in common stationary phases like (5%-phenyl)-methylpolysiloxane.39 It is however essential to mention here that the adsorption of o-xylene and m-xylene has been reported to occur only on the external surface of ZIF-8, while the inclusion of p-xylene into the ZIF-8 pores results in a transitory structural deformation of the framework, which explains the longer time period required for the exclusion of the same in addition to the broader peak profile.36
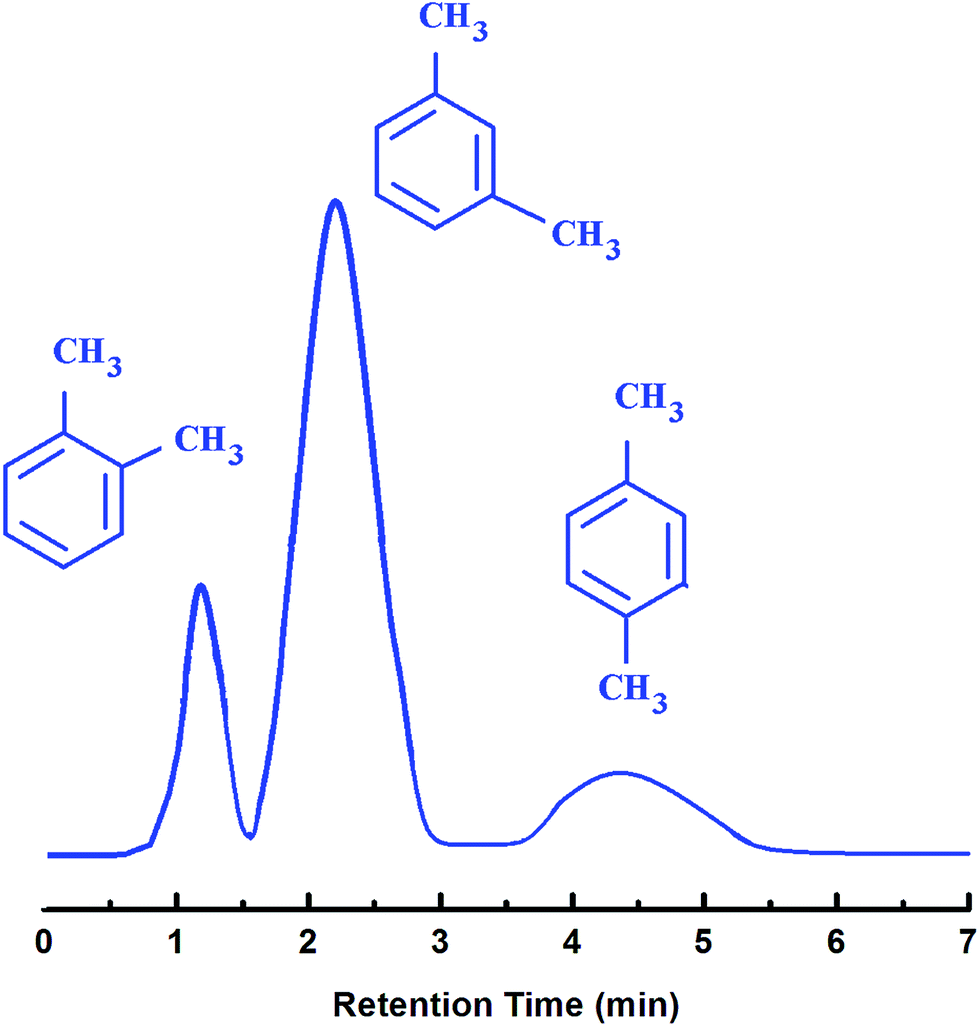 | ||
| Fig. 7 Separation of xylene isomers: o-xylene (bp 144.4 °C), m-xylene (bp 139.1 °C) and p-xylene (bp 138.4 °C) under isothermal conditions. | ||
Hydrolytic stability of MOFs is of particular interest, where it is targeted for applications involving analysis of contaminants in aqueous samples. One such representative application involves quantification of ethanol concentration in aqueous solutions. Ethanol is considered to be sustainable fossil fuel alternative, which exhibits potential to be commercialized in the coming decade.51,52 Purification and analysis of bio-alcohols in aqueous media is one of the major issues. For adsorptive separation, typical adsorbents such as zeolites,53 molecular sieves54 and even MOFs55 have been explored. In view of the hydrolytic stability exhibited by the fabricated microspheres, it was therefore considered of interest to investigate its potential towards ethanol quantification. Representative gas chromatograms, obtained during analysis of ethanol–water solutions of varying concentrations (4–16% v/v) in terms of the FID response is presented in Fig. 8. As expected, the peak area increases with increasing concentration, and the values are tabulated (Fig. S6, Table S3, ESI†). The PXRD of ZIF-8@PDMS core–shell microsphere after exposure to ethanol–water solution for extended periods of time (24 h) is presented (Fig. S7, ESI†), which confirm that the structure of ZIF-8 remained unaltered due to this exposure.7
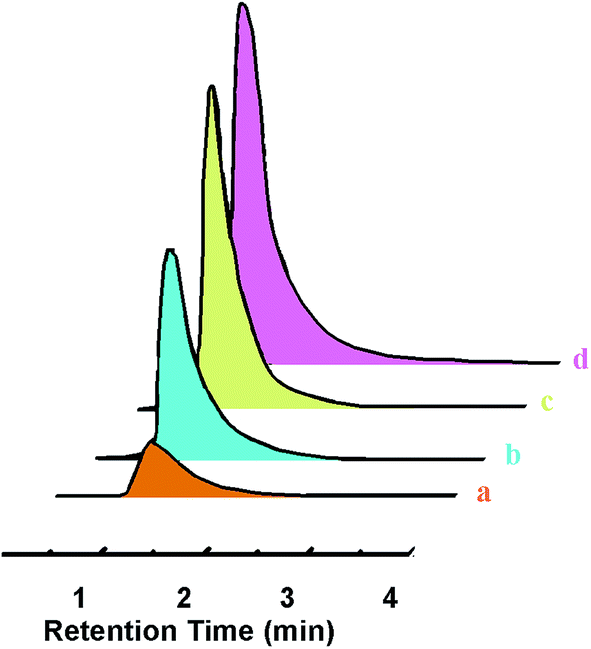 | ||
| Fig. 8 GC-chromatogram obtained after injecting ethanol water mixtures of different concentrations (a) 4%, (b) 8%, (c) 12%, (d) 16% v/v. | ||
Separation of alkane mixtures is another industrially important application, which, due to the small differences in relative volatility, is difficult to perform, atleast under isothermal condition using conventionally packed GC columns. Gas–solid chromatographic separation of linear alkanes has been previously been attempted using ZIF-8 as the stationary phase, the excellent separation being attributed to the van der Waals interaction between alkanes and the hydrophobic inner surfaces of the intrinsic micropores available within the framework.23 The narrow pore windows of ZIF-8 have been reported to be capable of sieving branched alkanes from linear alkanes.34 To demonstrate the applicability of ZIF-8 in this context, a few representative separations of gas and liquid mixtures were performed, and the chromatograms are presented in Fig. 9 (GC conditions presented, Tables S4–S6, ESI†).
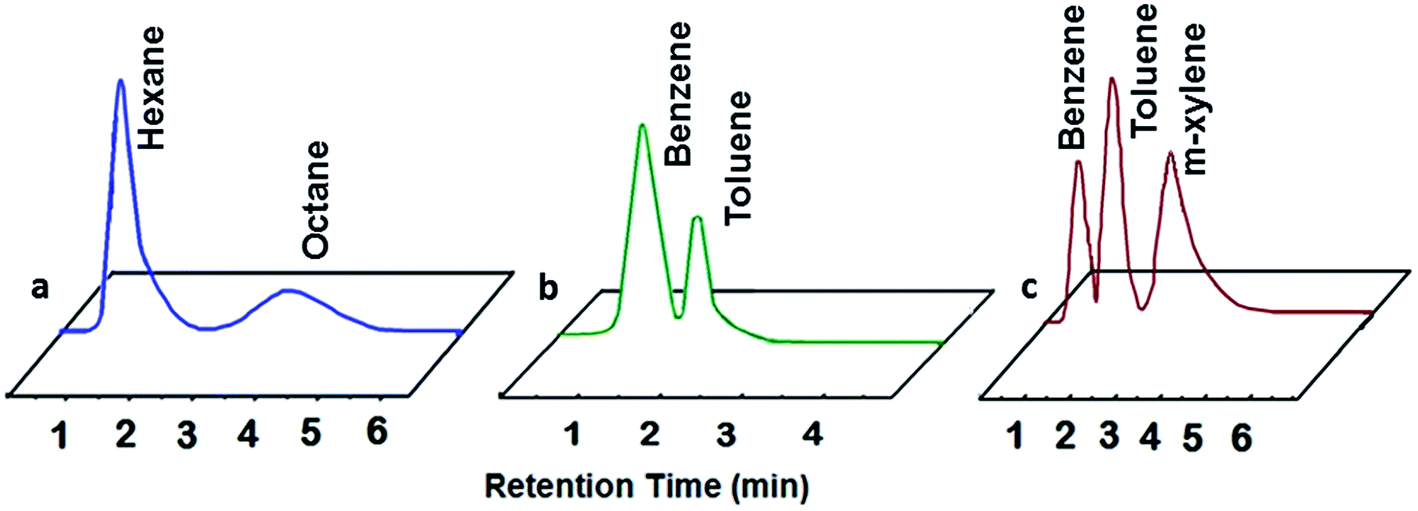 | ||
| Fig. 9 Chromatograms on ZIF-8@PDMS packed column (2 m long × 0.25 mm i.d.) for GC separation of (a) hexane and octane; (b) benzene and toluene and (c) benzene, toluene and m-xylene, under isothermal conditions. | ||
Repeated chromatographic runs were performed on gas and liquid mixtures using the fabricated ZIF-8@PDMS microspheres, which corroborated excellent separation reproducibility. It should be noted that in view of tunability of the pore size of MOFs by judicious choice of SBU and linker molecules, it is possible to envisage hitherto unprecedented applications, offering a bright future in the field of adsorption, extraction and separation of especially sized molecules in complicated matrices.
4. Conclusions
In this paper, we report the successful utilisation of core shell microspheres towards gas–solid chromatographic separations. A hydrolytically stable zeolitic imidazolate framework (ZIF-8) was crystallised on the surface of polydimethylsiloxane (PDMS) microspheres, which was prepared by suspension polymerisation route. The dimensions of the silicone microspheres could be altered by adjusting the operating parameters like stirring speed and feed concentration. The formation of ZIF-8 was confirmed by PXRD, SEM micrographs, energy dispersive analysis, thermogravimetry and FT-IR spectroscopy. The core shell microspheres were sieved (60–80 mesh) and packed in conventional SS column (2 m × 2.5 mm) to aid excellent separation of natural gas, xylene isomers (o-, m- and p-) and alkane mixtures. The developed column could also be used for quantification of ethanol concentration in aqueous solutions, which demonstrate their excellent hydrothermal stability for practical use towards analysis of environmental samples.Acknowledgements
The authors are thankful to Director, Centre for Fire, Explosive and Environment Safety, Delhi, India for his keen interest in the work and providing logistic support to perform the study.References
- Z. Zhang, Y. Zhao, Q. Gong, Z. Li and J. Li, Chem. Commun., 2013, 49, 653–661 RSC.
- S. Qiu, M. Xue and G. Zhu, Chem. Soc. Rev., 2014, 43, 6116–6140 RSC.
- J.-R. Li, R. J. Kuppler and H.-C. Zhou, Chem. Soc. Rev., 2009, 38, 1477–1504 RSC.
- M. Zhang, M. Bosch, T. Gentle Iii and H.-C. Zhou, CrystEngComm, 2014, 16, 4069–4083 RSC.
- J. C. Tan and A. K. Cheetham, Chem. Soc. Rev., 2011, 40, 1059–1080 RSC.
- J. A. Greathouse and M. D. Allendorf, J. Am. Chem. Soc., 2006, 128, 10678–10679 CrossRef CAS PubMed.
- D. Ge and H. K. Lee, J. Chromatogr. A, 2011, 1218, 8490–8495 CrossRef CAS PubMed.
- K. S. Park, Z. Ni, A. P. Côté, J. Y. Choi, R. Huang, F. J. Uribe-Romo, H. K. Chae, M. O'Keeffe and O. M. Yaghi, Proc. Natl. Acad. Sci. U. S. A., 2006, 103, 10186–10191 CrossRef CAS PubMed.
- Y. Pan, Y. Liu, G. Zeng, L. Zhao and Z. Lai, Chem. Commun., 2011, 47, 2071–2073 RSC.
- D. Fairen-Jimenez, S. A. Moggach, M. T. Wharmby, P. A. Wright, S. Parsons and T. Düren, J. Am. Chem. Soc., 2011, 133, 8900–8902 CrossRef CAS PubMed.
- J. dos Santos Ferreira da Silva, D. López Malo, G. Anceski Bataglion, M. Nogueira Eberlin, C. Machado Ronconi, S. Alves Júnior and G. F. de Sá, PLoS One, 2015, 10, e0128436 Search PubMed.
- L. Chen, Y. Peng, H. Wang, Z. Gu and C. Duan, Chem. Commun., 2014, 50, 8651–8654 RSC.
- S. Sorribas, B. Zornoza, C. Tellez and J. Coronas, Chem. Commun., 2012, 48, 9388–9390 RSC.
- J. Zheng, C. Cheng, W.-J. Fang, C. Chen, R.-W. Yan, H.-X. Huai and C.-C. Wang, CrystEngComm, 2014, 16, 3960–3964 RSC.
- G. M. Shi, T. Yang and T. S. Chung, J. Membr. Sci., 2012, 415–416, 577–586 CrossRef CAS.
- M. Askari and T.-S. Chung, J. Membr. Sci., 2013, 444, 173–183 CrossRef CAS.
- Q. Song, S. K. Nataraj, M. V. Roussenova, J. C. Tan, D. J. Hughes, W. Li, P. Bourgoin, M. A. Alam, A. K. Cheetham, S. A. Al-Muhtaseb and E. Sivaniah, Energy Environ. Sci., 2012, 5, 8359–8369 CAS.
- Y.-Y. Fu, C.-X. Yang and X.-P. Yan, J. Chromatogr. A, 2013, 1274, 137–144 CrossRef CAS PubMed.
- N. Chang, Z.-Y. Gu, H.-F. Wang and X.-P. Yan, Anal. Chem., 2011, 83, 7094–7101 CrossRef CAS PubMed.
- Manju, P. Kumar Roy, A. Ramanan and C. Rajagopal, Mater. Lett., 2013, 106, 390–392 CrossRef CAS.
- Manju, P. K. Roy and A. Ramanan, RSC Adv., 2014, 4, 52338–52345 RSC.
- Z.-Y. Gu, J.-Q. Jiang and X.-P. Yan, Anal. Chem., 2011, 83, 5093–5100 CrossRef CAS PubMed.
- N. Chang, Z.-Y. Gu and X.-P. Yan, J. Am. Chem. Soc., 2010, 132, 13645–13647 CrossRef CAS PubMed.
- Manju, P. K. Roy, A. Ramanan and C. Rajagopal, RSC Adv., 2014, 4, 17429–17433 RSC.
- P. Roy, N. Iqbal, D. Kumar and C. Rajagopal, J. Polym. Res., 2014, 21, 1–9 CrossRef CAS.
- P. Roy, N. Iqbal, D. Kumar and C. Rajagopal, Polym. Bull., 2014, 71, 2733–2748 CrossRef CAS.
- B. Hachuła, M. Nowak and J. Kusz, J. Chem. Crystallogr., 2010, 40, 201–206 CrossRef.
- A. S. Munch and F. O. R. L. Mertens, J. Mater. Chem., 2012, 22, 10228–10234 RSC.
- A. S. Münch, J. Seidel, A. Obst, E. Weber and F. O. R. L. Mertens, Chem.–Eur. J., 2011, 17, 10958–10964 CrossRef PubMed.
- B. Chen, C. Liang, J. Yang, D. S. Contreras, Y. L. Clancy, E. B. Lobkovsky, O. M. Yaghi and S. Dai, Angew. Chem., Int. Ed., 2006, 45, 1390–1393 CrossRef CAS PubMed.
- D. Peralta, G. Chaplais, A. Simon-Masseron, K. Barthelet, C. Chizallet, A. Quoineaud and G. D. Pirngruber, J. Am. Chem. Soc., 2012, 134, 8115–8126 CrossRef CAS PubMed.
- D. Peralta, G. Chaplais, A. Simon-Masseron, K. Barthelet and G. D. Pirngruber, Ind. Eng. Chem. Res., 2012, 51, 4692–4702 CrossRef CAS.
- M. T. Luebbers, T. Wu, L. Shen and R. I. Masel, Langmuir, 2010, 26, 15625–15633 CrossRef CAS PubMed.
- H. Bux, F. Liang, Y. Li, J. Cravillon, M. Wiebcke and J. Caro, J. Am. Chem. Soc., 2009, 131, 16000–16001 CrossRef CAS PubMed.
- W. Zhou, H. Wu, T. J. Udovic, J. J. Rush and T. Yildirim, J. Phys. Chem. A, 2008, 112, 12602–12606 CrossRef CAS PubMed.
- D. Peralta, G. Chaplais, J.-L. Paillaud, A. Simon-Masseron, K. Barthelet and G. D. Pirngruber, Microporous Mesoporous Mater., 2013, 173, 1–5 CrossRef CAS.
- Q. Wang, X. Li, L. Wang, Y. Cheng and G. Xie, Ind. Eng. Chem. Res., 2005, 44, 261–266 CrossRef CAS.
- D. H. Desty, A. Goldup and W. T. Swanton, Nature, 1959, 183, 107–108 CrossRef CAS.
- E. Aguilera-Herrador, R. Lucena, S. Cárdenas and M. Valcárcel, J. Chromatogr. A, 2008, 1201, 106–111 CrossRef CAS PubMed.
- S. H. Langer, C. Zahn and G. Pantazoplos, J. Chromatogr. A, 1960, 3, 154–167 CrossRef CAS.
- L. C. Case, J. Chromatogr. A, 1961, 6, 381–384 CrossRef CAS.
- Z. Witkiewicz, Z. Suprynowicz, J. Wójcik and R. Dabrowski, J. Chromatogr. A, 1978, 152, 323–328 CrossRef CAS.
- D. Sybliska and T. Kościelski, J. Chromatogr. A, 1983, 261, 357–362 CrossRef.
- N. Yassaa, E. Brancaleoni, M. Frattoni and P. Ciccioli, Chemosphere, 2006, 63, 502–508 CrossRef CAS PubMed.
- G.-C. Lin and C. A. Chang, J. Chromatogr. A, 1987, 409, 371–376 CrossRef CAS.
- A. Zlatkis, L. O'Brien and P. R. Scholly, Nature, 1958, 181, 1794 CrossRef CAS.
- P. E. Joos, A. F. L. Godoi, R. De Jong, J. de Zeeuw and R. Van Grieken, J. Chromatogr. A, 2003, 985, 191–196 CrossRef CAS PubMed.
- Z.-Y. Gu and X.-P. Yan, Angew. Chem., Int. Ed., 2010, 49, 1477–1480 CrossRef CAS PubMed.
- V. Finsy, H. Verelst, L. Alaerts, D. De Vos, P. A. Jacobs, G. V. Baron and J. F. M. Denayer, J. Am. Chem. Soc., 2008, 130, 7110–7118 CrossRef CAS PubMed.
- Z.-Y. Gu, D.-Q. Jiang, H.-F. Wang, X.-Y. Cui and X.-P. Yan, J. Phys. Chem. C, 2009, 114, 311–316 Search PubMed.
- P. K. Sharma, N. Saxena, A. Bhatt, C. Rajagopal and P. K. Roy, Catal. Sci. Technol., 2013, 3, 1017–1026 CAS.
- P. K. Sharma, N. Saxena, P. K. Roy and A. Bhatt, Int. J. Hydrogen Energy, 2015 DOI:10.1016/j.ijhydene.2015.09.137.
- N. Qureshi, S. Hughes, I. S. Maddox and M. A. Cotta, Bioprocess Biosyst. Eng., 2005, 27, 215–222 CrossRef CAS PubMed.
- T. Remy, J. Cousin Saint Remi, R. Singh, P. A. Webley, G. V. Baron and J. F. M. Denayer, J. Phys. Chem. C, 2011, 115, 8117–8125 CAS.
- T. Borjigin, F. Sun, J. Zhang, K. Cai, H. Ren and G. Zhu, Chem. Commun., 2012, 48, 7613–7615 RSC.
Footnote |
| † Electronic supplementary information (ESI) available. See DOI: 10.1039/c5ra26077a |
| This journal is © The Royal Society of Chemistry 2016 |