Ultrahigh-throughput generation and characterization of cellular aggregates in laser-ablated microwells of poly(dimethylsiloxane)

Jacob L. Albrittona, Jonathon D. Roybalb, Samantha J. Paulsena, Nicholas J. Calafata, Jose A. Flores-Zahera, Mary C. Farach-Carsonac, Don L. Gibbonsbd and Jordan S. Miller*a
aDepartment of Bioengineering, Rice University, Houston, Texas, USA. E-mail: jmil@rice.edu
bDepartment of Thoracic/Head and Neck Medical Oncology, The University of Texas M. D. Anderson Cancer Center, Houston, Texas, USA
cDepartment of BioSciences, Rice University, Houston, Texas, USA
dDepartment of Molecular and Cellular Oncology, The University of Texas, MD Anderson Cancer Center, Houston, Texas, USA

Received 6th December 2015 , Accepted 29th December 2015

First published on 12th January 2016


Abstract

Aggregates of cells, also known as multicellular aggregates (MCAs), have been used as microscale tissues in the fields of cancer biology, regenerative medicine, and developmental biology for many decades. However, small MCAs (fewer than 100 cells per aggregate) have remained challenging to manufacture in large quantities at high uniformity. Forced aggregation into microwells offers a promising solution for forming consistent aggregates, but commercial sources of microwells are expensive, complicated to manufacture, or lack the surface packing densities that would significantly improve MCA production. To address these concerns, we custom-modified a commercial laser cutter to provide complete control over laser ablation and directly generate microwells in a poly(dimethylsiloxane) (PDMS) substrate. We achieved ultra rapid microwell production speeds (>50[thin space (1/6-em)]000 microwells per h) at high areal packing densities (1800 microwells per cm2) and over large surface areas for cell culture (60 cm2). Variation of the PDMS substrate distance from the laser focal plane during ablation allowed for the generation of microwells with a variety of sizes, contours, and aspect ratios. Casting of high-fidelity microneedle masters in polyurethane allowed for non-ablative microwell reproduction through replica molding. MCAs of human bone marrow derived mesenchymal stem cells (hMSCs), murine 344SQ metastatic adenocarcinoma cells, and human C4-2 prostate cancer cells were generated in our system with high uniformity within 24 hours, and computer vision software aided in the ultra-high-throughput analysis of harvested aggregates. Moreover, MCAs maintained invasive capabilities in 3D migration assays. In particular, 344SQ MCAs demonstrated epithelial lumen formation on Matrigel, and underwent EMT and invasion in the presence of TGF-β. We expect this technique to find broad utility in the generation and cultivation of cancer cell aggregates, primary cell aggregates, and embryoid bodies.

Introduction

Scientists have demonstrated time and again that 3D in vitro systems outperform 2D systems at recapitulating nearly every aspect of tumor behavior in vivo, including prediction of drug delivery efficacy, metastatic invasion, and interactions with extracellular cues.1–5 Several studies have shown that 3D migration mechanisms are fundamentally different than 2D migration,5–7 where cell–cell contacts and chemical gradients that are characteristic of dense tumors will fundamentally change tumor cell behavior. Accordingly for 3D in vitro systems, numerous researchers have observed behavior of pre-aggregated cells, rather than single cells, to improve relevancy to in vivo tumor behavior.8–10

Methods for mass cultivation of uniform multicellular aggregates (MCAs), also referred to as multicellular tumor spheroids (MCTS), have been explored extensively in recent years.9,11–13 Common methods for MCA production include using non-adherent surfaces,14 spinning flasks,15 and the hanging drop method.16 All of these methods suffer from an unfortunate tradeoff where MCA size/shape variability must be balanced against high-throughput fabrication. Key metastatic events like extravasation from the bloodstream to a secondary tissue site are important but rare events with success rates as low as 0.01% of circulating micrometastases.17 However, it has remained challenging to fabricate MCAs at ultrahigh-throughput18 scale of more than 100[thin space (1/6-em)]000 per day.

Forced aggregation in microwells is one method of high-throughput MCA production with low MCA size variability.19,20 Microwells can be generated in a variety of ways including photolithographic 3D printing of PEG21 or photolithography,22 but such techniques require significant technical expertise to implement. Furthermore, these techniques have a long turn-around time for generating new microwell structures. Aggrewell™ is the commercial version of forced aggregation,19 but longitudinal studies are complicated by difficulty with exchanging media. Additionally, the inverse pyramidal structures of Aggrewell™ microwells may affect cell differentiation based on a study that found microwell shape affected embryoid body differentiation.23

CO2 laser ablation has been explored as an alternative high-throughput method for fabricating uniform microwells.24 For biological applications, laser ablation has historically been a method for machining microfluidics systems.25 Laser ablation works by applying high energy pulses of focused laser light to remove targeted sections of a substrate material. CO2 lasers emit in the far infrared regime (λ = 10.6 μm) and ablate material primarily via thermal vaporization.26 For microfluidics applications, polymers such as poly(methyl methacrylate) (PMMA) or poly(dimethyl siloxane) (PDMS) are typically chosen as the substrate material for CO2 laser ablation, due to their high absorbance of infrared wavelengths and biocompatibility.24–26 Much of previous work has been devoted to characterizing laser ablation of channels to achieve a uniform depth,26–29 however point laser ablation yields a Gaussian-like conical depression that can be exploited as a micro-sized well for cultivating MCAs.

Recent work by Tu et al. proposes fabrication of microwells by CO2 laser ablation as a viable strategy for rapidly prototyping microwells.24 They demonstrated the ability to control size features of single microwells formed by varying laser power in a 1–5 W range. Laser systems are commercially available and have a low technical expertise barrier compared with photolithographic techniques.24 Moreover, laser ablation offers a rapid turnaround time between prototyping new microfluidics designs compared with micromachining techniques.25

Even though uniform microwells can be formed by CO2 laser ablation, the current production method still has shortcomings for efficient MCA production. Much of previous work with fabricating microwells demonstrates packing in a square lattice.20–22,24 However, microwell openings are circular and the optimal packing design for uniform circles is a hexagonal lattice.30 Higher microwell packing density is important for two reasons: to limit surface area available for undesired cell settling and to maximize the number of harvestable MCAs per unit area. Increasing total area of patterned microwells is another method for improving MCA production throughput. Furthermore, methods of microwell fabrication with a masking step19,22 are limited by increased technical difficulty associated with scaling up mask area. Because laser functionality is invariant across a flat surface, upper limits on potential area for ablation are on the order of the laser cutter machining area (1 m2). Finally, media exchange steps can deplete MCAs if wells are too shallow.

Given our expertise using microcontrollers for 3D motion control and fabrication,31 we reasoned that the same controllers could provide advanced scripting and fabrication controls for improving silicone microwell fabrication by CO2 laser ablation, thereby improving high-throughput production of multicellular aggregates. We hypothesized that improved control over the laser cutter, afforded to us by open-source hardware, would expand the range of achievable microwell dimensions in addition to improving microwell packing density and large-scale reproducibility. Indeed, we demonstrate control over laser ablation parameters, large area production of microwells, full 3D positioning of ablation site, and maximal efficient packing of microwells. Microwells are further shown to cultivate small, uniform diameter MCAs that maintain migratory phenotype in 3D migration studies. Finally, we demonstrate the ability to generate polyurethane casts of microwells by replica molding32 which enables PDMS microwell mass production without the need for a laser cutter. Open-source hardware and low cost hardware decrease the barriers for other laboratories to adopt new technologies,33,34 therefore we expect this technique to find broad utility in the generation and cultivation of primary cell aggregates, cancer aggregates and embryoid bodies.

Materials and methods

Laser ablation equipment and software toolchain

For all laser ablation procedures, we used a 600 × 900 mm bed laser cutter (SeeMeCNC, Goshen, IN) equipped with a 40 Watt CO2 laser (JLD40W, LightObject, Sacramento, CA). To add z-axis movement capabilities, we attached a linear actuator (KR20, THK) with a Nema 17-style stepper motor (Kysan 1124090, Ultimachine, South Pittsburg, TN) to the laser cutter bed. A 3D printed platform [http://github.com/MillerLabFTW] was attached to the motor track to serve as a mobile, substrate support platform during ablation. An industrial vacuum (16006, Dustless Technologies, Price, UT) was installed in the laser cutter bed area near the site of ablation to remove ablation debris.

To control laser ablation, we adapted a software toolchain commonly used to control 3D printing. GCODE is a coding language initially developed to automate machine operations that has been co-opted by the open-source 3D-printing community. GCODE serves as the base coding language for specifying well-timed motions and tool operations useful for 3D-printing. In our application, the laser head motions are controlled in the same manner as a melt-extrusion 3D-printer nozzle, and laser firing is controlled with a customized command to specify pulse-width modulation bursts of laser at intervals during laser head translation. GCODE scripts were generated with a custom python script provided on Github [http://github.com/MillerLabFTW]. An open-source GCODE interpreter, pronterface [http://github.com/kliment/Printrun] was used to relay GCODE commands to the microcontroller. We used a Rep-rap Arduino-compatible Motherboard (RAMBo) microcontroller (UMRAMBOPAC13, Ultimachine) flashed with Marlin firmware [http://github.com/MarlinFirmware/Marlin] to translate GCODE commands into timed signals that control laser cutter functions. We used a variant of Marlin firmware, courtesy of Tim Schmidt, that added functionality for fine control of laser cutters specifically [http://github.com/MillerLabFTW]. The RAMBo/Marlin combination is a commonly used toolchain to control open-source 3D printing via GCODE.

Laser ablation of poly(dimethylsiloxane)

Poly(dimethylsiloxane) (PDMS; Sylgard 184, Dow Corning, Midland, MI) was made by vigorously mixing a 10[thin space (1/6-em)]:[thin space (1/6-em)]1 ratio of PDMS base agent to PDMS curing agent for 5 minutes. Uncured PDMS mixture was poured into untreated 100 mm polystyrene dishes (89038-968, VWR) at 10.0 ± 0.1 g per dish or 150 mm polystyrene dishes (25384-326, VWR) at 22.5 g ± 0.1 g per dish, then cured for 48 hours at room temperature on a level surface. Before ablation, dish rims were removed to prevent interference with vacuum removal of debris. Using the laser cutter and software toolchain, hollow microwells were ablated in PDMS via GCODE generated based on user-input parameters for laser power, laser residence time, PDMS surface distance from the laser focal point (z-axial distance), speed of laser head xy-translational motion, laser pulses per millimeter, and center-to-center hexagonal packing distance. To make PDMS microwell inserts for 12-well multiwell plates, we first ablated a 46 × 46 mm grid of microwells, then used the laser cutter to carve out four 11 mm radius circular slabs of PDMS microwells from the grid. To remove ablation debris, PDMS slabs were rinsed with 99% isopropyl alcohol (BDH2032-1GLP, BDH), then sonicated with an ultrasonic cleaner (5510, Branson Ultrasonics, Danbury, CT) for 1 hour in isopropyl alcohol. PDMS microwells were left to dry for 12+ hours at 40 °C before use as a multiwell plate insert.

Microplate preparation and MCA seeding

We generated MCAs by forced aggregation of cells into microwells produced by CO2 laser ablation. First, we added PDMS microwell inserts, manufactured as previously described, to standard tissue culture multiwell plates. PDMS microwell inserts were secured to the polystyrene bottom of TC culture 12-well plate wells with a small droplet of uncured PDMS mixture. Microplates were cured at room temperature on a level surface for 48 hours. Microwells were sterilized by incubation in ethanol for 8+ hours then exposure to UV light for 12 hours. Wells were cleaned by washing with 1× Phosphate Buffered Saline (PBS; HyClone). Our seeding protocol was adapted from a protocol by Razian et al.35 Just before seeding with cells, microwells were passivated to cell adhesion by incubating with Pluronic F-127 solution (5% w/v in PBS; P2443-250g, Sigma) for one hour at room temperature. After adding Pluronic F-127, microwell plates were centrifuged with a Beckman Allegra X-15R microplate centrifuge (Beckman Coulter) at 3500 × g for 5 minutes to force air bubbles out of the microwells. Post-incubation, microwells were washed twice with PBS, then stored in PBS until cell seeding. 12-well plates were seeded by adding 1 mL per well of cells suspended in media at a concentration of 7 × 10⁴, 1.75 × 10⁵, or 5.25 × 10⁵ cells per mL. Cells were forced into microwells by centrifuging lightly at 50 × g for 2 minutes. Cells were stored at 37 °C in 5% CO2 for one to three days. To harvest the cell aggregates, PDMS microwell inserts were dislodged and inverted into another 12-well plate well filled with media, then centrifuged at 50 × g for 1 minute. For imaging and size analysis experiments, MCAs were fixed in paraformaldehyde (PFA) (4% v/v in PBS; 15710s, Electron Microscopy Sciences, Fort Washington, PA) for one hour and stored in PBS. We filtered single cells from MCA cell suspensions using a protocol described by Ungrin et al.19 PFA-fixed MCA suspensions were passed through an inverted 40 μm cell strainer (TC-1040, Denville Scientific, Holliston, MA), then were eluted from the cell strainer by liberally flushing the strainer with PBS.

Cell line derivation and culture

The 344SQ cell line was isolated from subcutaneous tumor tissue of KRasG12D/p53R172HΔG mice as described previously.6 344SQ cells were cultured in RPMI 1640 media (10-040-CV, Corning, Manassas, VA) containing 10% (v/v) FBS (Optima S1245 Lot# B12025, Atlanta Biologicals, Flowery Branch, GA). Human bone marrow derived mesenchymal stem cells (hMSCs) (Part # MSC003) were provided by Rooster Bio Inc (Frederick, MD). hMSCs were expanded using hMSC High Performance Media Kit (Rooster Bio Inc; Frederick, MD) on tissue culture plastic. C4-2 cells, a subline derived from the LNCaP prostate cancer cell line,36 were cultured in RPMI 1640 media containing 10% (v/v) FBS.

For visualization purposes, fluorescently labeled 344SQ, C4-2, and hMSC cell lines were generated using transduction with a second-generation lentiviral system, using psPAX2 packaging plasmid and MD2.G envelope plasmid (plasmid # 12260 and 12259, respectively; Addgene, Cambridge, MA). Each cell line was transduced using the PGK-H2B-mCherry CMV-EGFP-IRES-Puro gene construct. Labeled 344SQ cells were selected for puromycin resistance; C4-2 cells and hMSCs were sorted by FACS (Cell Cytometry and Cell Sorting Core at Baylor College of Medicine; Houston, TX). 344SQ cells were alternatively labeled with EGFP expressed from an MSCV retroviral vector and FACS sorted.37

MCA diameter analysis

MCA size distributions were determined by imaging harvested MCAs using epifluorescence microscopy, then analyzing the images using a CellProfiler image analysis toolchain. For a given experimental condition, all collected MCAs were imaged by whole-well, top-view montage scans at 4× magnification that were stitched into a single image by NIS-Elements Ar software (Nikon). FIJI (fiji.sc/Fiji) software was used to process large images for batch analysis with a CellProfiler (http://www.cellprofiler.org) pipeline. Cell profiler identified MCA objects using an Ilastik pixel classifier (Interactive Learning and Segmentation Toolkit; http://www.ilastik.org) that was manually trained on example images of MCAs. R (http://www.r-project.org/) was used to analyze MCA geometric property data, to create size distribution histograms, and to separate MCA populations.

hMSC in fibrin gels

For 3D culture, hMSCs were first seeded into microwells, using a cell concentration of 1.75 × 10⁵ cells per mL. Cells were then cultured in microwells for approximately 24 hours. After harvesting the MCAs, hMSC MCAs were seeded into 10 mg mL−1 fibrin gels at a concentration of approximately 1 × 10³ MCAs per mL. Gels were generated by mixing fibrinogen (Sigma Aldrich: F8630-5G) with the MCA suspension before adding the fibrinogen/MCA suspension to thrombin (Sigma Aldrich: T6634-500UN) for a final fibrinogen concentration of 10 mg mL−1 and a final thrombin concentration of 1.25 U mL−1. For images of fixed MCAs, cells were fixed using 4% (v/v) PFA overnight immediately after harvesting.

344SQ response to TGF-β in Matrigel®

344SQ aggregates were examined for response to human TGF-β (8915LF, Cell Signaling, Danvers, MA) during cultivation on Matrigel® (356231, Lot# 4272005, Corning), similar to previous work.6,38 344SQ cells were seeded in 12-well plates containing PDMS microwell inserts. Cells were seeded in microwells at a density of 10 cells per microwell (7 × 10⁴ cells per mL; 1 mL per well) and cultivated for 2 days. Eight-well chambers were prepared with Matrigel® as described previously.6 MCAs were harvested and seeded directly onto Matrigel® and cultivated in RPMI 1640 media supplemented with 10% (v/v) FBS and 2% (v/v) Matrigel®. For hTGF-β response experiments, media was additionally supplemented with 2 ng mL−1 hTGF-β (8915LF, Cell Signaling, Danvers, MA). MCAs were observed for 6 days, imaging at Day 0, 3, and 6 with a Nikon Eclipse Ti microscope and changing media every 2 days.

Microscopy

Generally unless otherwise specified, fluorescently labeled cells were imaged with a widefield Nikon Eclipse Ti microscope equipped with an Andor Zyla 4.2 SCMOS camera. Confocal images were taken with a Nikon A1-Rsi confocal microscope. To obtain volumetric data on microwell shape, we imaged microwells filled with a fluorescein isothiocyanate–dextran (FITC–dextran) solution (FD10S-100MG, Sigma) and imaged confocal z-stacks through the microwell. Volume renderings and maximum intensity projection images were made using NIS-Elements Ar (Nikon) software. Fluorescent images were normalized with the open-source EnFuse software (http://enblend.sourceforge.net/), and gamma settings were adjusted with NIS-Elements Ar to highlight cell features.

PDMS replica molding with EpoxAcast

We created polyurethane casts of PDMS microwells using a commercial polyurethane casting material, EpoxAcast 670 HT (Smooth-On, Macungie, PA), to serve as master molds for replica molding32 additional PDMS microwells without the need for additional laser-based ablation. To prevent the polyurethane from adhering too strongly to the PDMS, microwells were coated with trichloro(1H,1H,2H,2H-perfluorooctyl)silane (448931-10G, Sigma) by vapor deposition inside a vacuum evacuated 12′′ glass desiccator overnight. EpoxAcast mixture was made by vigorously mixing a 100[thin space (1/6-em)]:[thin space (1/6-em)]16 ratio of base to curing agent for 3 minutes. Uncured EpoxAcast was poured over the silane-functionalized PDMS in a 100 mm polystyrene dish to about 3/4 full. Bubbles were removed in a vacuum chamber for 10 minutes, then returned to atmospheric pressure for curing overnight.

Scanning electron microscopy

For SEM imaging of EpoxAcast microneedle arrays, casts had to be prematurely separated from the PDMS between 12 and 16 hours post-mixing before the polyurethane fully cured. For SEM imaging, polyurethane samples were sputter coated with a 20 nm gold layer directly above the microneedles, then coated with another 20 nm layer of gold on the side to be imaged. Scanning Electron Microscopy (SEM) images were taken with an FEI Quanta 400 ESEM.

Results and discussion

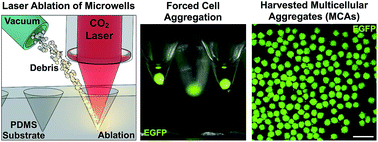
Our goal was to achieve high-throughput production of multicellular aggregates (MCAs) by improving existing technologies of fabricating biocompatible microwells by CO2 laser ablation (schematic in Fig. 1a). One common method for high-throughput generation of MCAs is forced aggregation of cells into wells. The simplest example of forced aggregation is to evenly distribute cells from a uniform cell suspension into wells of a non-adhesive 96-well or 384-well multiplate, then allow the cells to aggregate for days to weeks.14 Ungrin et al. improved this method by dramatically increasing well density using anisotropic etching of silicon wafers to form molds of densely packed microwells on the order of 100 μm diameter.19 Their work formed the precursor to the commercial product Aggrewell™, which are inverse square pyramidal microwells of 400 or 800 μm diameter. However, Aggrewell™ microwells are limited to a single shape with a fixed relationship between microwell depth and diameter (i.e. microwell depth decreases linearly with microwell diameter).19 Other photolithographic methods exist for creating microwells with cylindrical22 or concave shapes;20 however, such methods are limited by the necessity of photomasks, which impose spatial upper limits on scaling number of microwells. Other groups have previously described laser ablation of PDMS to fabricate conical microwells.24,26 We found laser ablation attractive over mask-aligned photolithography methods20 and complex Digital Light Photolithography (DLP) methods for making PEG-based microwells,21 because laser ablation has both low technical requirements and low cost.25
image file: c5ra26022a-f1.tif
Fig. 1 High-throughput fabrication of conical microwells in poly(dimethylsiloxane) (PDMS). (a) Schematic diagram (left) and photograph (right) of the selective laser ablation of a PDMS substrate to generate conical microwells. D = diameter, h = height (b) a single laser pulse generates a single microwell, and microwell height (h) can be controlled by changing either laser power (W) or laser pulse duration (ms) at each point of ablation; scalebar = 500 μm. (c) To maximize packing density of microwells, custom software allowed the input of c, or center-to-center distance between adjacent microwells; scalebar = 1000 μm. (d) Vacuum removal of debris allowed large-scale microwell fabrication of a 63 cm2 area of PDMS (>100[thin space (1/6-em)]000 microwells) in less than two hours. (e) PDMS microwell arrays can be optionally cast in polyurethane to create a master mold for an additional means of microwell reproduction; scalebar = 2000 μm (left), scalebar = 500 μm (right).

We leveraged knowledge for operating 3D printer microcontrollers31 to economically improve a commercial CO2 laser cutter for fabrication of microwells by laser ablation. We used a standard open-source 3D printer motherboard (RAMBo) to override the factory installed motherboard of our laser cutter; a wiring schematic can be found on Github [http://github.com/MillerLabFTW]. A freely available, customized version of Marlin firmware [http://github.com/MillerLabFTW] allowed us to abstract laser and motion control to the same software toolchain typically used for melt-extrusion 3D printing.31 In particular, standard controls were augmented with additional features to dictate laser power, laser residence or dwell time, and laser pulses per millimeter. Additionally, use of 3D-printing microcontrollers expanded our ability to include xyz-volumetric positioning of the ablation site.

Laser setting effects on microwell dimensions

We found that cone height could be tuned through control over laser power and dwell time at each site of ablation. Shown in Fig. 1b, cone depth positively correlates with increasing laser power or increasing laser dwell time. Preliminary data (not shown) revealed that at a constant laser power, increasing laser dwell time will increase cone height up to an extent, after which microwell dimension increases are marginal. Such a correlation is expected because laser power and dwell time both increase the effective energy delivered during ablation. Diminishing returns on microwell dimensions probably indicates diminished laser energy density due to energy dispersal from an increasingly unfocused laser beam. Preliminary observations showed that changes in energy delivered by the laser did correlate positively with cone diameter; however, overall changes in diameter were minimal compared with changes in cone height. These relationships follow observations made by other groups.24,28

Laser head translation speed is another tunable parameter that affects microwell formation. During continuous ablation mode, the laser head moves in a line, pulsing at a user specified number of pulses per millimeter (PPM) during motion. Initial tests revealed that increased laser translation speed decreases microwell cone height and also causes the cone shape to elongate (data not shown). We found that a laser head translation speed of 500 mm minute−1 was sufficient to rapidly ablate microwells without laterally elongating the microwell geometry. Translation speed was held constant during all further microwell fabrication to simplify the parameter space to explore. A slow-motion video of this process is available as [ESI Movie 1], during which we achieved peak fabrication times of 15 microwells per second.

Ablation debris removal

During ablation, laser cutters produce debris that can deposit and accumulate near the laser head aperture, potentially obstructing the light path with prolonged ablation. Commercial laser cutters are equipped with air compressors to emit air from the laser head aperture to prevent such debris accumulation. Initial ablation tests revealed that air pressure maintained an unobstructed laser path, but forcibly redirected the ejected debris onto nearby PDMS surfaces. Debris deposition changes the PDMS surface roughness,39 which disrupts microwell formation during subsequent rows of ablation. One option is to compensate for debris with laser parameter optimization,28 but for our application, limiting the parameter space would decrease the range of possible microwell dimensions. Instead, we hypothesized that efficient removal of debris would prevent disruptions to ablation, allowing for better fidelity of microwell patterns over a larger area. Indeed, removal of positive air pressure improved reproducibility of microwell shape; however, the absence of air flow permitted debris to accumulate on the laser head. To compensate, we outfitted the laser cutter with a high-powered vacuum, situated to aspirate debris away from the laser head (schematized in Fig. 1a). Replacement of positive air pressure with negative air pressure proved an effective strategy to increase the area we can ablate reproducible microwells.

Laser motion control effects on microwells

We replaced machine software control of xy-axis laser head motion with a more generic open-source language designed for automating machine operations. Developed initially by MIT in the 1950s, GCODE is a repetitive, line-by-line language in which each line specifies a single motion or tool activation. The simple, repetitive nature of the language permits easy modularization via more abstract coding languages like Python that can automate GCODE script writing. As such, we have developed custom Python scripts to output GCODE scripts based on user inputs for ablation parameters. For simplicity, we created rectangular grids of microwells by inputting length and width dimensions in addition to laser settings.

Using automated GCODE scripting, we can easily design other arrangements of microwells to improve microwell packing density. Microwells fabricated by laser ablation exhibit a circular orifice at surface level. Previously, similar microwells have been arranged in square lattices,22,24,40,41 but a square packing arrangement of circles is not optimal, using about 79% of available surface area. Flat surfaces between wells also present areas for cells to settle outside of microwells. Nguyen et al. demonstrate a “honeycomb” or hexagonal lattice of microwell packing42 that improves efficiency to about 91%, which is the theoretical optimal efficiency for circles. Python scripting allows for the easy abstraction of implementing a hexagonal microwell arrangement by parameterizing spacing as a constant, c for center-to-center spacing between any two circles (Fig. 1c). This constant can be quickly changed to estimate optimal packing for arbitrary microwell top diameter (Fig. 1c). Interestingly, ablated microwells are not abstract 2D circles but rather 3D volumes, which means that “over-packing” wells (c < microwell top diameter) will still yield viable microwell volumes. Over-packing forces microwell openings into a hexagonal shape, resulting in packing densities approaching 100% efficiency with virtually no surface area for cells to settle on. Critically, slightly overlapping ablation profiles causes a small reduction in cone height, which does not compromise the microwell structure relevant for cell aggregation. Because translation speed is held constant, higher packing density also effectively increases production rate and allowed us to achieve peak fabrication rates of 30 microwells per second. Using this approach we fabricated more than 100[thin space (1/6-em)]000 microwells within 64 cm2 in under two hours (Fig. 1d).

3D printer microcontroller systems were designed to easily incorporate z-axis motion. Given this and the large power range afforded by a 40 W laser, we hypothesized that ablation could be achieved in out-of-focus laser regions (Fig. 2a). By adding a z-axis platform to the laser cutter, the z-axial distance from the laser focal point to the PDMS surface became an independent parameter to control microwell shape. Though z-axis variation does change microwell height, z-axial distance more importantly expands the range of possible microwell diameters. As surface distance from the laser focal point increases, cone diameter increases and cone height decreases. Presumably the laser energy is being distributed across a wider surface area. Interestingly, changes in z-axial distance yielded microwells with fundamentally different shape profiles as seen in Fig. 2a. At the focal point, low aspect ratio (ratio of diameter to height) cones were observed, with cylinders possible during ablation at large laser dwell time or laser power settings. Cylinders are actually very low aspect ratio cones, where the slope of the cone approaches a vertical line. At 2 mm below the laser focal point, we observed cones with increased diameter and higher aspect ratios. At 8 mm below the focal point, we observed microwells with much higher aspect ratios and round well bottoms.


image file: c5ra26022a-f2.tif
Fig. 2 Out-of-focus laser ablation generates distinct microwell shapes. Control over z-axial distance from the laser focal plane to the PDMS surface allows fabrication of microwells with distinct shapes. (a) Example z-axial distances, shown in the schematic diagram (left), generate microwells of various dimensions including cylinders (top row), sharp cones (middle row) and rounded cones (bottom row). Cross-sectional view of PDMS (left column), confocal microscopy of volume filling fluorescent dextran (middle column), and scanning electron microscopy of polyurethane negative casts (right column). (b) Custom control over laser ablation at each point allows for mixed, interleaved microwell shapes. Cross-sectional view (left); SEM (right). All scalebars = 500 μm.

Customizable microwell dimensions

Control over the laser parameters and z-axial distance enables customization of microwell height and diameter, including options for sharp-tipped, round-tipped or cylindrical microwell shapes at select z-axial distances. To fabricate microwells of a desired dimension, one can first estimate the z-axial distance based on desired cone diameter. At the chosen z-axial distance, an examination of the laser power and dwell time 2D parameter space can reveal what types of cone bottoms (round vs. sharp or cylindrical) are available. For height adjustment, changes to laser power or dwell time have similar effects, so only one parameter is needed to fine-tune the cone height. Because the laser power setting does not linearly correlate to total energy delivered during ablation, we chose to use dwell time as the primary laser parameter for small adjustments to cone height. Finally, the useful range of c, microwell spacing distance, can be used to efficiently arrange microwells. Using this workflow, one can quickly customize a new microwell array and fabricate a desired microwell design in less than a couple of hours.

An advantage of using custom scripting to automate the design of microwell arrays is the ability to fabricate grids of interleaved microwells with assorted shapes and sizes. Indeed, Fig. 2b shows a cross-sectional view of deeper cones adjacent to shallower cones. Microwells of two or more shapes can be interleaved by specifying multiple laser parameter profiles and how to arrange them. Importantly, multiple low and high aspect ratio cones cannot easily be fabricated with traditional photolithography, highlighting substrate designs which could be explored for InVERT tissue casting.43

Non-ablative PDMS replica molding

Although we demonstrate the ability to fabricate thousands of microwells in minutes, scale-up to high-throughput industrial manufacturing could require production of millions of microwells. Laser ablation of microwells has advantages for rapid prototyping,25 but scale-up could be improved by other fabrication methods. Additionally, research groups may lack the technical comfort or desire to custom modify a laser cutter for in-house production of PDMS microwells. Therefore, we sought to investigate the feasibility of a non-ablative microwell fabrication method through replica molding32 an existing PDMS microwell array.

Silicone based on PDMS has previously been utilized for replica molding with a pattern casting fidelity down to 2 nm.44 Because soft lithography32 utilizes alternating hard and soft materials for replica molding, we first created molds of microwells in polyurethane to form rigid arrays of microneedles. Therefore once a satisfactory microwell condition has been identified, a single successful PDMS area can be cast and re-cast for large-scale production from polyurethane masters, independent of laser ablation limitations. Fig. 1e and 2a demonstrate large arrays of polyurethane microneedles that can serve as templates for casting new PDMS microwells without the need for laser ablation. Interestingly, microneedle arrays fabricated at a similar size scale have recently been shown to be useful for cutaneous DNA delivery,45 suggesting a potential separate application for microneedle arrays cast from microwells.

MCA cultivation in microwells

After successful fabrication of a grid of microwells, we next wanted to use these silicone substrates as inserts in multiwell tissue culture plates for working with mammalian cells. Importantly, after microwell fabrication the laser cutter can revert to its original functionality and cut out circular sections of PDMS to serve as inserts in a multiwell plate. For non-ablative microwell insert production, we used a hammer-driven hole punch to cut out circular sections from replica molded PDMS microwell arrays. We have cut inserts suitable for use in 6-well, 12-well, and 24-well multiwell plates. Once the microwells are situated in the multiwell plate, cells can be seeded in a protocol similar to the forced aggregation technique explained by Ungrin et al.19 Using a 12-well format for testing, we observed that nearly all cells separated into individual microwells after just a few minutes of gentle, table top centrifugation. We also found that gravity alone was sufficient for cellular aggregation in the microwells, but preferred centrifugation for timing efficiency.

We verified the ability to image aggregates inside microwells immediately after centrifugation and also after multiple days of culture as seen in Fig. 3a. A murine metastatic lung adenocarcinoma cell line, 344SQ, was used for testing aggregation of cells inside microwells.6 We found that a single uncomplicated seeding step was sufficient to populate nearly every microwell, and no cells were visible on PDMS surfaces between microwells. Fig. 3a shows aggregation of cells in large diameter (D = 1.2 mm; h = 1 mm) microwells situated in 12-well tissue culture plates, and Fig. 3b shows cells aggregated in small diameter (D = 0.25 mm; h = 0.5 mm) microwells. Fig. 3c shows aggregates situated in a single well Omnitray – an array of nearly 200[thin space (1/6-em)]000 microwells. Changing media was a straightforward procedure that did not appear to dislodge aggregates. Harvested MCAs were imaged with confocal microscopy, which revealed compact aggregation of 344SQ cells into solid MCA shapes (Fig. 3d inset).


image file: c5ra26022a-f3.tif
Fig. 3 Cells aggregate inside multiwell plates with embedded PDMS microwell insets. (a) 344SQ-GFP cell aggregates in a 12-well plate with 1.2 mm center-to-center spacing at ∼80 microwells per cm2. Aggregates can be imaged directly inside microwells from below; scalebar = 2000 μm (left), scalebar = 500 μm (middle). Aggregates can also be seen in a cross-sectional side view; scalebar = 500 μm (right). (b) Labelled C4-2 cells in a 12-well plate with 0.25 mm center-to-center spacing at ∼1800 microwells per cm2; scalebar = 2000 μm (left), scalebar = 200 μm (middle), scalebar = 200 μm (right). (c) 344SQ-GFP aggregates in microwells from an Omnitray (single-well plate with multiwell plate footprint) demonstrates feasibility of microwell production scale-up; scalebar = 2000 μm. (d) Labelled 344SQ MCAs isolated from microwells and the maximum intensity projection of a single MCA imaged with confocal microscopy (inset); scalebar = 200 μm, scalebar = 25 μm (inset). (e) MCA Maximum Feret Diameter histogram for microwells seeded with cells at 10, 25, and 75 cells per microwell and harvested after one day of aggregation. (f) MCAs from microwells seeded at 75 cells per microwell were filtered with a 40 μm cell strainer.

We measured the size polydispersity of MCAs by analyzing the maximum Feret diameter of batches of MCAs cultured in microwells. 344SQ cells were cultured in 12-well plate microwells for 1 day at various cell seeding densities. Cell seeding density is reported in cells per microwell, which denotes the total number of cells added to a well, divided by the theoretical number of microwells. For 12-well plates, we approximated the number of microwells as 7000 microwells per PDMS insert based on a theoretical 1847 microwells per cm2 density and 3.8 cm2 growth area per well. For size experiments, we chose 10, 25, and 75 cells per microwell as cell seeding densities, which correspond to 7 × 10⁴, 1.75 × 10⁵, and 5.25 × 10⁵ cells per well (12-well plate single well).

A cumulative histogram of MCA diameter size distribution from six experiments is shown in Fig. 3d. For each cell seeding density, two peaks of diameter sizes are visible in the histogram. These peaks presumably correspond to separate populations of aggregate sizes. After de-convolving the two peaks, primary peaks (larger diameter) for 10, 25, and 75 cells per microwell seeding densities corresponded to diameters of 49.3 ± 10.5 μm (n = 86[thin space (1/6-em)]000 aggregates), 62.0 ± 10.8 μm (n = 100[thin space (1/6-em)]000 aggregates), and 87.9 ± 15.9 μm (n = 104[thin space (1/6-em)]000 aggregates) respectively; while secondary peaks (smaller diameter) for the same 10, 25, and 75 cells per microwell densities corresponded to diameters of 20.2 ± 8.2 μm (n = 8000 aggregates), 20.6 ± 9.2 μm (n = 14[thin space (1/6-em)]000 aggregates), and 28.8 ± 16.7 μm (n = 50[thin space (1/6-em)]000 aggregates) respectively.

The maximum expected yield of MCAs was 168[thin space (1/6-em)]000 aggregates if every seeded microwell yielded one MCA, which equated to percent yields of 51%, 60%, and 62% for 10, 25, and 75 cells per microwell seeding densities respectively. Percent yield values are based on distinct aggregate counts from image analysis, divided by the hypothetical maximum expected yield determined by microwell packing density. Some of the yield loss can be attributed to a failure of the automated image analysis to identify aggregates positioned partially between two images – a significant source of error with 100+ images for each multiwell plate PDMS insert. Even though harvest yield is not perfect, we still generated thousands of MCAs from each PDMS microwell insert.

Based on observation, a significant number of single cells and small clusters of cells are sheared away from primary MCAs during harvest and may require removal. As stated previously, the size distribution histogram shows a primary peak corresponding to a population of objects with larger diameter than a secondary peak of smaller diameter objects. Supporting the interpretation that primary peaks are MCAs, primary peak diameters increase with increasing cell density; whereas, secondary peaks do not similarly increase. To test this interpretation, we took one experimental data point for cells seeded at 75 cells per microwell and removed smaller cell aggregates with a 40 μm cell strainer. We used a method, previously reported by Ungrin et al., to remove aggregates smaller than the strainer filter size.19 Analysis of the pre-filtered MCA population showed a primary peak of 117 μm ± 20.1 μm (n = 11[thin space (1/6-em)]900 aggregates) and a secondary peak of 22.1 μm ± 16.0 μm (n = 7500 aggregates) (Fig. 3e). After filtration, the primary peak was 107.8 μm ± 14.2 μm (n = 8000 aggregates), and there was no discernible secondary peak (Fig. 3e). We calculate a 67% yield of MCAs after filtration, and MCA density (ratio of large MCAs to total aggregates) was enriched from 61% to 83% MCA density.

Finally, to show broad applicability of our PDMS microwell aggregation technology to groups without the desire or technical means to fabricate microwells directly with laser ablation, we aggregated cells in PDMS microwells fabricated by replica molding with polyurethane microneedle arrays (Fig. 4a). A cross-sectional view of microwells fabricated by non-ablative replica molding (Fig. 4b) shows that microwell structure is not significantly changed from the original microwells (Fig. 3b). We repeated the MCA cultivation experiment with 344SQ-GFP cells seeded at a cell seeding density of 10 cells per microwell (7 × 10⁴ cells per mL) and harvested after one day of aggregation. Fig. 4c shows a top view of aggregates inside the microwells just before the harvest step. A histogram of the max Feret diameter data is shown in Fig. 4d. Similar to the previous data, we de-convolved the two observed peaks, which resulted in an aggregate diameter of 46.5 μm ± 10.1 μm (n = 9000 aggregates) with a secondary peak average diameter of 16.0 μm ± 6.0 μm (n = 800 aggregates). Aggregate yield was 64% based on a theoretical 14[thin space (1/6-em)]000 maximum aggregates. Overall, these results parallel observations seen with microwells fabricated by laser ablation, which suggests our non-ablative method of replica molding PDMS microwells is a valid alternative method for mass generation of MCAs.


image file: c5ra26022a-f4.tif
Fig. 4 Cells aggregate in PDMS microwells made by replica molding. (a) Schematic of non-ablative PDMS microwell fabrication by replica molding. A polyurethane microneedle array (see Fig. 1e) can be cast from a pre-existing PDMS microwell template (Fig. 1d). The polyurethane cast can serve as master for successive casting of PDMS microwell arrays without the need for laser ablation. (b) Cross-sectional view of PDMS microwells made by replica molding; scalebar = 200 μm. (c) Top view of 344SQ-GFP aggregates (Day 1) in PDMS microwells made by replica molding; scalebar = 200 μm. (d) MCA Maximum Feret Diameter histogram for microwells seeded with cells at 10 cells per microwell and harvested after one day of aggregation.

MCA migration assays

Next, we decided to assay functionality and viability of MCAs cultivated in our microwell system. Aggregates have extensively been used for regenerative medicine studies.13,46–48 Therefore we formed aggregates of primary hMSCs and observed hMSC aggregate behavior in a 3D fibrin matrix. Aggregates of hMSCs exhibited similar morphology to 344SQ aggregates seen in Fig. 3c, where the aggregates are densely packed and spherical (Fig. 5a, inset). Moreover, hMSC aggregates encapsulated in a fibrin matrix were able to sprout into surrounding matrix over three days (Fig. 5a). These results suggest a utility for microwells in 3D matrix invasion assays in regenerative medicine research.49–51
image file: c5ra26022a-f5.tif
Fig. 5 hMSCs and 344SQ cells maintain mobility after aggregation inside PDMS microwells. (a) Human bone marrow derived mesenchymal stem cells grown in fibrin gels for 3 days. Cells are clearly sprouting away from the MCA center; scalebar = 500 μm, scalebar = 20 μm (inset). (b) 344SQ MCAs lumenize over time when cultured on Matrigel® (left); scalebar = 100 μm. Day 3 aggregates have lumen-like absence in the center compared with Day 0 aggregates (right); scalebar = 25 μm. (c) hTGF-β (2 ng mL−1) induces 344SQ MCAs to sprout into Matrigel®; scalebar = 100 μm.

Researchers in cancer biology commonly use MCAs as micro-tumor substitutes to recapitulate in vivo conditions with 3D in vitro systems.7,9,52 Previously it has been described that 344SQ cells plated onto Matrigel® grow from single cells into spheres that lumenize over time;6,38 however, the study was unclear on whether lumenization happened as a by-product from cell growth or whether lumenization could occur in previously formed aggregates of cells. Using 344SQ aggregates generated from our microwell system, we assessed whether 344SQ aggregates plated onto Matrigel® would undergo epithelial-like lumenization similar to spheres formed from a single cell source. Indeed, we find evidence that solid aggregates form lumens over three days on Matrigel® (Fig. 5b). Moreover, MCAs of 344SQ cells also retain sensitivity to TGF-β as previously described in the same studies.6,38 These MCAs do not form lumens in the presence of TGF-β, but instead exhibit a mesenchymal-like phenotype with distinctly visible invasion into the Matrigel® matrix over 6 days in culture (Fig. 5c). These results demonstrate utility of MCAs in functional assays for cancer invasion and metastasis.

Conclusions

We have improved fabrication of microwells in PDMS by CO2 laser ablation through incorporation of a 3D printing microcontroller system to a basic commercial laser cutter. The open-source controller system enabled us to rapidly generate microwells of a custom cone diameter and cone height by following a workflow of varying z-axial distance, laser power, laser residence time, and microwell spacing. Furthermore, we have shown the ability to fabricate multiple microwell shapes through out-of-focus ablation and the ability to spatially arrange wells of different sizes. Through the incorporation of a vacuum system, we have shown the ability to scale-up total area of microwells. We demonstrate that large scale manufacturing and non-ablative production of PDMS microwells is possible through polyurethane casting of ablated PDMS substrates. The ability to fabricate custom cone and cylinder shapes could also have a variety of alternative applications such as InVERT molding43 or fabricating microneedles for cutaneous DNA delivery by reverse PDMS casting.45 Our improved method of fabricating microwells gives us the ability to easily generate multicellular aggregates in massive quantities. Even small MCAs of 50 μm diameter show low size polydispersity in batches of >10[thin space (1/6-em)]000 per experiment, which is orders of magnitude larger than previous works.19,21 Importantly, we demonstrate that MCAs cultivated in our microwells maintain invasive potential in 3D matrices formed from fibrin or Matrigel®, which indicates potential for use in studying tumor metastasis. We believe this technology for high-throughput production of uniform MCAs will enable the study of rare events in metastasis such as extravasation. Open-source hardware, low cost equipment, and low technical requirements equate to ready implementation in other laboratories. We expect our technique for high-throughput fabrication of customized microwell structures will find broad utility in the generation and cultivation of multicellular aggregates for use in regenerative medicine and tumor engineering applications.

Acknowledgements

We gratefully acknowledge the many free, open-source, and related projects that critically facilitated this work, including Arduino.cc, RepRap.org, Ultimachine.com, SeeMeCNC.com, Python.org, Blender.org, NIH ImageJ, Fiji.sc, pronterface.com, enblend.sourceforge.net, and openscad.org. We thank Ultimachine.com and SeeMeCNC.com also for additional technical assistance and helpful conversations. We thank Tim Schmidt for his help with adapting Marlin firmware to our laser cutter, and Andreas Bastian, Anderson Ta, and Humphrey Obuobi for technical assistance. We thank Joel M. Sederstrom and the Cytometry and Cell Sorting Core at Baylor College of Medicine for assistance with cell sorting. This work was supported by the Cancer Prevention Research Institute of Texas (RP120713-P2) and the National Institutes of Health (P01CA098912 and K08CA151651).

References

  1. M. J. Bissell and D. Radisky, Nat. Rev. Cancer, 2001, 1, 46–54 CrossRef CAS PubMed.
  2. C. Fischbach, R. Chen, T. Matsumoto, T. Schmelzle, J. S. Brugge, P. J. Polverini and D. J. Mooney, Nat. Methods, 2007, 4, 855–860 CrossRef CAS PubMed.
  3. M. R. Dreher, W. Liu, C. R. Michelich, M. W. Dewhirst, F. Yuan and A. Chilkoti, J. Natl. Cancer Inst., 2006, 98, 335–344 CrossRef CAS PubMed.
  4. C. M. Nelson and M. J. Bissell, Annu. Rev. Cell Dev. Biol., 2006, 22, 287–309 CrossRef CAS PubMed.
  5. L. G. Griffith and M. A. Swartz, Nat. Rev. Mol. Cell Biol., 2006, 7, 211–224 CrossRef CAS PubMed.
  6. D. L. Gibbons, W. Lin, C. J. Creighton, Z. H. Rizvi, P. A. Gregory, G. J. Goodall, N. Thilaganathan, L. Du, Y. Zhang, A. Pertsemlidis and J. M. Kurie, Genes Dev., 2009, 23, 2140–2151 CrossRef CAS PubMed.
  7. X. Xu, M. C. Farach-Carson and X. Jia, Biotechnol. Adv., 2014, 1–13 Search PubMed.
  8. S. Bersini, J. S. Jeon, G. Dubini, C. Arrigoni, S. Chung, J. L. Charest, M. Moretti and R. D. Kamm, Biomaterials, 2014, 35, 2454–2461 CrossRef CAS PubMed.
  9. F. Hirschhaeuser, H. Menne, C. Dittfeld, J. West, W. Mueller-Klieser and L. A. Kunz-Schughart, J. Biotechnol., 2010, 148, 3–15 CrossRef CAS PubMed.
  10. C. J. Lovitt, T. B. Shelper and V. M. Avery, Biology, 2014, 3, 345–367 CrossRef PubMed.
  11. G. Mehta, A. Y. Hsiao, M. Ingram, G. D. Luker and S. Takayama, J. Controlled Release, 2012, 164, 192–204 CrossRef CAS PubMed.
  12. D. V. LaBarbera, B. G. Reid and B. H. Yoo, Expert Opin. Drug Discovery, 2012, 7, 819–830 CrossRef CAS PubMed.
  13. S. Sart, A.-C. Tsai, Y. Li and T. Ma, Tissue Eng., Part B, 2013, 20, 1–46 Search PubMed.
  14. F. Langenbach, K. Berr, C. Naujoks, A. Hassel, M. Hentschel, R. Depprich, N. R. Kubler, U. Meyer, H.-P. Wiesmann, G. Kögler and J. Handschel, Nat. Protoc., 2011, 6, 1726–1735 CrossRef CAS PubMed.
  15. J. E. Frith, B. Thomson and P. G. Genever, Tissue Eng., Part C, 2010, 16, 735–749 CrossRef CAS PubMed.
  16. J. M. Kelm, N. E. Timmins, C. J. Brown, M. Fussenegger and L. K. Nielsen, Biotechnol. Bioeng., 2003, 83, 173–180 CrossRef CAS PubMed.
  17. K. J. Luzzi, I. C. MacDonald, E. E. Schmidt, N. Kerkvliet, V. L. Morris, A. F. Chambers and A. C. Groom, Am. J. Pathol., 1998, 153, 865–873 CrossRef CAS PubMed.
  18. J. J. Agresti, E. Antipov, A. R. Abate, K. Ahn, A. C. Rowat, J.-C. Baret, M. Marquez, A. M. Klibanov, A. D. Griffiths and D. A. Weitz, Proc. Natl. Acad. Sci. U. S. A., 2010, 107, 4004–4009 CrossRef CAS PubMed.
  19. M. D. Ungrin, C. Joshi, A. Nica, C. Bauwens and P. W. Zandstra, PLoS One, 2008, 3, e1565 Search PubMed.
  20. Y. Y. Choi, B. G. Chung, D. H. Lee, A. Khademhosseini, J. H. Kim and S. H. Lee, Biomaterials, 2010, 31, 4296–4303 CrossRef CAS PubMed.
  21. K. C. Hribar, D. Finlay, X. Ma, X. Qu, M. G. Ondeck, P. H. Chung, F. Zanella, A. J. Engler, F. Sheikh, K. Vuori and S. Chen, Lab Chip, 2015, 2412–2418 RSC.
  22. J. M. Karp, J. Yeh, G. Eng, J. Fukuda, J. Blumling, K.-Y. Suh, J. Cheng, A. Mahdavi, J. Borenstein, R. Langer and A. Khademhosseini, Lab Chip, 2007, 7, 786–794 RSC.
  23. S. Sa, J. Dev. Biol. Tissue Eng., 2012, 4, 12–22 Search PubMed.
  24. T.-Y. Tu, Z. Wang, J. Bai, W. Sun, W. K. Peng, R. Y.-J. Huang, J.-P. Thiery and R. D. Kamm, Adv. Healthcare Mater., 2014, 3, 609–616 CrossRef CAS PubMed.
  25. C. G. K. Malek, Anal. Bioanal. Chem., 2006, 385, 1362–1369 CrossRef PubMed.
  26. H. Klank, J. P. Kutter and O. Geschke, Lab Chip, 2002, 2, 242–246 RSC.
  27. M. F. Jensen, M. Noerholm, L. H. Christensen and O. Geschke, Lab Chip, 2003, 3, 302–307 RSC.
  28. H.-B. Liu and H.-Q. Gong, J. Micromech. Microeng., 2009, 19, 037002 CrossRef.
  29. M. Li, S. Li, J. Wu, W. Wen, W. Li and G. Alici, Microfluid. Nanofluid., 2012, 12, 751–760 CrossRef CAS.
  30. H.-C. Chang and L.-C. Wang, 2010, 1–4, arXiv:1009.4322.
  31. J. S. Miller, K. R. Stevens, M. T. Yang, B. M. Baker, D.-H. T. Nguyen, D. M. Cohen, E. Toro, A. A. Chen, P. A. Galie, X. Yu, R. Chaturvedi, S. N. Bhatia and C. S. Chen, Nat. Mater., 2012, 11, 768–774 CrossRef CAS PubMed.
  32. Y. Xia and G. M. Whitesides, Annu. Rev. Mater. Sci., 1998, 28, 153–184 CrossRef CAS.
  33. J. S. Miller, PLoS Biol., 2014, 12, 1–9 Search PubMed.
  34. M. D. Symes, P. J. Kitson, J. Yan, C. J. Richmond, G. J. T. Cooper, R. W. Bowman, T. Vilbrandt and L. Cronin, Nat. Chem., 2012, 4, 349–354 CrossRef CAS PubMed.
  35. G. Razian, Y. Yu and M. Ungrin, J. Visualized Exp., 2013, e50665 Search PubMed.
  36. G. N. Thalmann, P. E. Anezinis, S. M. Chang, H. E. Zhau, E. E. Kim, V. L. Hopwood, S. Pathak, a C. von Eschenbach and L. W. Chung, Cancer Res., 1994, 54, 2577–2581 CAS.
  37. J. Wei, O. Duramad, O. A. Perng, S. L. Reiner, Y.-J. Liu and F. X.-F. Qin, Proc. Natl. Acad. Sci. U. S. A., 2007, 104, 18169–18174 CrossRef CAS PubMed.
  38. B. J. Gill, D. L. Gibbons, L. C. Roudsari, J. E. Saik, Z. H. Rizvi, J. D. Roybal, J. M. Kurie and J. L. West, Cancer Res., 2012, 72, 6013–6023 CrossRef CAS PubMed.
  39. A. Waldbaur, H. Rapp, K. Länge and B. E. Rapp, Anal. Methods, 2011, 3, 2681 RSC.
  40. A. P. Napolitano, P. Chai, D. M. Dean and J. R. Morgan, Tissue Eng., 2007, 13, 2087–2094 CrossRef CAS PubMed.
  41. J. Fukuda and K. Nakazawa, Tissue Eng., 2005, 11, 1254–1262 CrossRef CAS PubMed.
  42. D. Nguyen, S. Sa, J. D. Pegan, B. Rich, G. Xiang, K. E. McCloskey, J. O. Manilay and M. Khine, Lab Chip, 2009, 9, 3338–3344 RSC.
  43. K. R. Stevens, M. D. Ungrin, R. E. Schwartz, S. Ng, B. Carvalho, K. S. Christine, R. R. Chaturvedi, C. Y. Li, P. W. Zandstra, C. S. Chen and S. N. Bhatia, Nat. Commun., 2013, 4, 1847 CrossRef CAS PubMed.
  44. Y. Xia, E. Kim, X.-M. Zhao, J. A. Rogers, M. Prentiss and G. M. Whitesides, Science, 1996, 273, 347–349 CAS.
  45. P. C. DeMuth, Y. Min, B. Huang, J. A. Kramer, A. D. Miller, D. H. Barouch, P. T. Hammond and D. J. Irvine, Nat. Mater., 2013, 12, 367–376 CrossRef CAS PubMed.
  46. A. Warmflash, B. Sorre, F. Etoc, E. D. Siggia and A. H. Brivanlou, Nat. Methods, 2014, 11, 847–854 CrossRef CAS PubMed.
  47. G. D. Prestwich, J. Controlled Release, 2011, 155, 193–199 CrossRef CAS PubMed.
  48. K. Jakab, C. Norotte, F. Marga, K. Murphy, G. Vunjak-Novakovic and G. Forgacs, Biofabrication, 2010, 2, 022001 CrossRef PubMed.
  49. C. M. Ghajar, V. Suresh, S. R. Peyton, C. B. Raub, F. L. Meyskens, S. C. George and A. J. Putnam, Mol. Cancer Ther., 2007, 6, 552–561 CrossRef CAS PubMed.
  50. K. A. Mosiewicz, L. Kolb, A. J. van der Vlies, M. M. Martino, P. S. Lienemann, J. A. Hubbell, M. Ehrbar and M. P. Lutolf, Nat. Mater., 2013, 12, 1072–1078 CrossRef CAS PubMed.
  51. T. Liu, B. Lin and J. Qin, Lab Chip, 2010, 10, 1671–1677 RSC.
  52. J. Friedrich, C. Seidel, R. Ebner and L. A. Kunz-Schughart, Nat. Protoc., 2009, 4, 309–324 CrossRef CAS PubMed.

Footnote

Electronic supplementary information (ESI) available: Video S1. Real-time and slow motion video of laser ablation of microwells into PDMS. See DOI: 10.1039/c5ra26022a

This journal is © The Royal Society of Chemistry 2016
Click here to see how this site uses Cookies. View our privacy policy here.