Optical response of a quantum dot–epoxy resin composite: effect of tensile strain
Shaofeng Yina,
Ziming Zhaoa,
Weiling Luan*a and
Fuqian Yang*b
aKey Laboratory of Pressure Systems and Safety (MOE), School of Mechanical and Power Engineering, East China University of Science and Technology, Shanghai 200237, P. R. China. E-mail: luan@ecust.edu.cn
bMaterials Program, Department of Chemical and Materials Engineering, University of Kentucky, Lexington, KY 40513, USA. E-mail: fyang2@uky.edu
First published on 2nd February 2016
Abstract
The structural applications of quantum dots (QDs) can be artificially realized through the preparation of QDs-based structural materials, which have unique characteristics of photoluminescence (PL) in response to mechanical deformation, via the dispersion of quantum dots in various materials, including polymers and plastics. A QDs-based composite consisting of CdSe@ZnS core–shell QDs and a bisphenol-A type epoxy resin has been prepared by mixing a solution of CdSe@ZnS core–shell QDs in chloroform with bisphenol-A type epoxy resin and modified amine at room temperature. The tensile deformation of the tensile specimens made from the QDs-based composite causes a significant change in the PL intensity for large engineering strains, and there is no observable strain-induced shift of the wavelength corresponding to the maximum PL intensity. Two major modes are observed for the temporal variation of the PL intensity of the QDs-based composite coated on AA 7009 tensile specimens under cyclic loading and unloading of small strains. One exhibits in-phase characteristics with strain, and the other exhibits antiphase characteristics with strain. The variation of the PL intensity of the QDs-based composite with tensile strain suggests that there exists strain-dependent photoluminescence, which determines the PL characteristics of the CdSe@ZnS core–shell QDs in the bisphenol-A type epoxy under the irradiation of ultraviolet light. The experimental results demonstrate the potential of developing sensitive opto-mechanical devices from QDs-based composites.
1. Introduction
Quantum dots (QDs), which are light-emitting nanoparticles under the irradiation of ultraviolet (UV) light, have potential in the applications of bio-imaging, bio-diagnostics, solar cells and light emitting diodes due to unique optical and electronic properties.1–6 Of importance for the characteristics of the photoluminescence (PL) of QDs is the exciton state, including exciton energies, polarization, and phase, which is determined by the composition and shape of the QDs, the composition of the surrounding material, and the strain state of the QDs.It is of paramount importance to understand the effect of strain on the PL characteristics of QDs for applications in photonics, sensors, quantum information and strain-engineering of QDs. Gell et al.7 studied the effect of a surface-acoustic-wave (SAW) on the emission of a single InAs QD and observed a characteristic broadening of the time-averaged emission spectra due to the SAW-induced oscillation of the energy levels of the QD. Nakaoka et al.8 used micromachined air-bridge to demonstrate the strain effect on the quantum states of single self-assembled InGaAs QDs and observed the variation of the PL peak energy and linewidth with the applied voltage for the bending of the air-bridge. Embedding an InAs QD in a GaAs nanobridge, Bryant et al.9 showed the dependence of the optical response of the InAs QD on mechanical strain due to the strain-induced shift of the electron and hole levels. They suggested that an applied shearing strain breaks lateral symmetry of the QD. Controlling the thickness of a cap layer, Persson et al.10 studied the effect of strain on the photoluminescence of single InP/GaInP QDs of different sizes and observed the dependence of the strain-induced energy shifts on the size and aspect ratio of the QDs. Ding et al.11 used piezoelectric-induced biaxial stress to regulate the exciton energy state in self-assembled InGaAs/GaAs QDs and observed the increase of the emission blue shifts and the binding energies of positive trion (X+) and biexciton (XX) relative to neutral exciton (X) with increasing compression. Fu et al.12 found that the peak wavelength for the luminescence of InAs QDs capped with an In0.4Ga0.6As layer is red-shifted to 1.33 μm due to the decrease of the effective energy barrier induced by strain. Note that the effects of strain and strain gradient on the red shift and broadening of the near-edge emission of ZnO nanowires in cathodoluminescence spectra were observed via the bending of ZnO nanowires.13–16 Such behavior is size-dependent and can be attributed to the electromechanical interaction in ZnO nanowires.13–16
Realizing the potential application of QDs in opto-mechanical devices, Choi et al.17 dispersed CdSe/CdS core/shell QDs, nanorods, and tetrapods in a hydrostatic (1![[thin space (1/6-em)]](https://www.rsc.org/images/entities/char_2009.gif) :
:![[thin space (1/6-em)]](https://www.rsc.org/images/entities/char_2009.gif) 1 (v/v) pentane/isopentane) or non-hydrostatic (toluene) pressure medium and studied the effect of hydrostatic pressure and non-hydrostatic stress on the luminescence of the QDs, nanorods, and tetrapods. They observed the deformation-induced blue or red shift in the wavelength. Based on the fluorescence response of tetrapods to non-hydrostatic stress, Choi et al.18 developed a luminescent nanocrystal stress gauge by incorporating CdSe–CdS tetrapods into single polyester fibers. They observed a fluorescence red shift with the increase of tensile strain.
1 (v/v) pentane/isopentane) or non-hydrostatic (toluene) pressure medium and studied the effect of hydrostatic pressure and non-hydrostatic stress on the luminescence of the QDs, nanorods, and tetrapods. They observed the deformation-induced blue or red shift in the wavelength. Based on the fluorescence response of tetrapods to non-hydrostatic stress, Choi et al.18 developed a luminescent nanocrystal stress gauge by incorporating CdSe–CdS tetrapods into single polyester fibers. They observed a fluorescence red shift with the increase of tensile strain.
In general, it is believed that mechanical strain can cause the change of the exciton state of QDs as well as the distribution of QDs in a medium, which can lead to the change of the optical response of the QDs when subjected to the irradiation of light. Currently, there is seldom study addressing the strain dependence of the optical response of QDs-based composites on both the microscale and macroscale. It is of great importance to develop QDs-based composites for applications in photonics, sensors, and mechanical structures. This work is focused on the development of a QDs-based composite from CdSe@ZnS QDs. The strain-dependence of the optical response of the QDs-based composite is also characterized.
2. Experimental detail
CdSe@ZnS core–shell QDs with an average size of ∼3 nm was prepared, using the microreaction technology similar to the one given by Wan et al.19,20 and Yang et al.18,21 A suspension made of 6.42 mg CdO (oleic acid, SCR, 99.9%), 0.5 g TOPO (98%, Fluka), 1.5 mL OLA (oleyl amine, 70%, Fluka), 0.1 mL OA (oleic acid, SCR, 90%), and 2.4 mL ODE (1-octadecene, Fisher, 90%) was heated at 150 °C for 1 h under continuous stirring to form a homogenous solution. At the same time, a Se (selenium, SCR, 99.5%) stock solution was prepared via the dissolution of 39.5 mg Se powder in 1.5 mL OLA and 1 mL TOP (trioctylphosphine, 90%, Fluka) which was diluted with 1.5 mL ODE at room temperature under magnetic stirring for 1 h. The mixture of these two solutions was placed in a PTFE (polytetrafluoroethylene) capillary of 70 cm in length and 300 μm in diameter at a temperature of 280 °C, which was placed in a thermally stable oil bath. The flow rate of the mixture was 31.56 mL h−1, which allowed the mixture to flow through the capillary within ∼14 s. During the flow of the mixture through the capillary, CdSe QDs were formed. No further treatment was performed on the as-prepared CdSe QDs.Single-molecular ZDC (zinc diethyldithiocarbamate) powder of 1.082 g (99 wt%, Shanghai Dunhuang Chemical Plant) was dissolved in a solution consisting of TOP of 3 mL, ODE of 2 mL and OLA of 3 mL, which was stirred magnetically for 20 min at room temperature. The mixture of the ZDC solution and CdSe QDs was then flowed through a PTFE capillary at a temperature of 140 °C with the residence time of 35 s to form CdSe@ZnS core–shell QDs. The CdSe@ZnS core–shell QDs obtained were purified in acetone (analytical, SCR) by centrifugation and decantation. The precipitates were then dispersed in chloroform (analytical reagent, SCR) and removed with an equal volume of methanol (analytical reagent, SCR). Finally, the precipitates were re-dispersed in chloroform before being used in forming a CdSe@ZnS core–shell QDs-based composite.
The CdSe@ZnS core–shell QDs-based composite was prepared by mixing CdSe@ZnS core–shell QDs with bisphenol-A type epoxy resin (product no. 6002, Shanghai Resin Factory) at room temperature. The curing agent was modified amine (product no. 593, Shanghai Resin Factory). The volume ratio of bisphenol-A type epoxy resin to CdSe@ZnS core–shell QDs in chloroform to modified amine was 3![[thin space (1/6-em)]](https://www.rsc.org/images/entities/char_2009.gif) :
:![[thin space (1/6-em)]](https://www.rsc.org/images/entities/char_2009.gif) 1
1![[thin space (1/6-em)]](https://www.rsc.org/images/entities/char_2009.gif) :
:![[thin space (1/6-em)]](https://www.rsc.org/images/entities/char_2009.gif) 1. Note that there was 25 mg of CdSe@ZnS core–shell QDs in 1 mL of chloroform. Fig. 1 shows the tensile bars made from the CdSe@ZnS core–shell QDs-based composite (Fig. 1a) and the dimensions of the tensile bars (Fig. 1b). As shown in Fig. 1a, the tensile bars exhibit the characteristic of photoluminescence under the irradiation of UV light of 365.8 nm in wavelength.
1. Note that there was 25 mg of CdSe@ZnS core–shell QDs in 1 mL of chloroform. Fig. 1 shows the tensile bars made from the CdSe@ZnS core–shell QDs-based composite (Fig. 1a) and the dimensions of the tensile bars (Fig. 1b). As shown in Fig. 1a, the tensile bars exhibit the characteristic of photoluminescence under the irradiation of UV light of 365.8 nm in wavelength.
Uniaxial tensile tests were performed, using a universal testing machine (REGER, RSM-4050). The tensile specimen was mounted to the pinned grips at both sides, and the force was applied to the specimen by moving the upper grip. The displacement control with a constant displacement speed of 10 mm min−1 was used until the tensile specimen was stretched to fracture. Fig. 2 shows the schematic of the tensile test, in which an optical fiber spectrograph (Ocean Optics, QE65-Pro-FL) was used to record the variation of the PL intensity of the tensile specimen with elongation. During the tensile test, the CdSe@ZnS core–shell QDs-based composite was locally under the irradiation of UV light of 365.8 nm in wavelength to achieve photoluminescence.
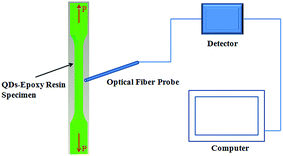 | ||
| Fig. 2 Schematic of the tensile test with the use of an optical fiber probe recoding the PL intensity of the tensile bar under the irradiation of UV light. | ||
The distribution of CdSe@ZnS core–shell QDs dispersed in the prepared tensile specimens was characterized, using high resolution transmission electron microscopy (HRTEM) (JEM-2100F HRTEM, JEOL, Japan). The tension-induced redistribution of CdSe@ZnS core–shell QDs was also examined.
3. Results and discussion
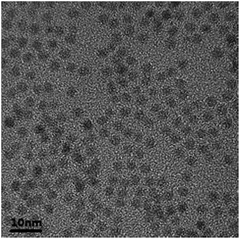
To examine the morphology of the prepared CdSe@ZnS core–shell QDs, TEM images were taken. Fig. 3 shows a typical TEM image of the prepared CdSe@ZnS core–shell QDs. No coagulation and coalescence of the prepared CdSe@ZnS core–shell QDs are observed. The prepared CdSe@ZnS core–shell QDs are nearly monodisperse with an average diameter of ∼3.0 nm in accord with the result given by Luan et al.22It is known that the PL emission spectrum can be used to evaluate the efficiency of the trapping, migration, and transfer of charge carriers. Fig. 4 shows the PL emission spectrum of the prepared CdSe@ZnS core–shell QDs. The maximum PL intensity occurs at the wavelength of ∼527.6 nm, which is slightly smaller than 532 nm reported by Nandwana et al.23 Such a difference is likely due to the difference in the thickness of the ZnS shell, since the ZnS shell exhibits the confinement effect and plays an important role in controlling the generation of electron–hole pairs, leading to the variation of free-carrier concentration for nonlinear optical absorption.24
 | ||
| Fig. 4 Optical characteristics of the prepared CdSe@ZnS core–shell QDs and the CdSe@ZnS core–shell QDs-based composite. | ||
The UV-vis absorption of the prepared CdSe@ZnS core–shell QDs and the CdSe@ZnS core–shell QDs-based composite was analyzed. Fig. 4 shows the diffuse reflectance spectra of the prepared CdSe@ZnS core–shell QDs and the CdSe@ZnS core–shell QDs-based composite. The absorption peaks are located at 507.9 nm and 509.0 nm for the pure prepared CdSe@ZnS core–shell QDs and the absorption peak of the CdSe@ZnS core–shell QDs-based composite, respectively. There is red shift of the absorption wavelength of QDs due to the changes in the surface structure induced by the change in the surrounding material, leading to the change of the factors for the photoactivation process.25 The wavelength of the absorption peak is smaller than that of the emission peak for the pure prepared CdSe@ZnS core–shell QDs.
The UV-vis absorption of the prepared CdSe@ZnS core–shell QDs was analyzed. Fig. 4 shows the diffuse reflectance spectrum of the prepared CdSe@ZnS core–shell QDs. The absorption peak of the prepared CdSe@ZnS core–shell QDs is located at 508.0 nm. The wavelength of the absorption peak is smaller than that of the emission peak for the prepared CdSe@ZnS core–shell QDs.
It is evident that the wavelength of 365.8 nm of the excitation UV light is much smaller than the wavelength of ∼527.6 nm of the maximum PL intensity for the prepared CdSe@ZnS core–shell QDs. The excitation light has little effect on the characteristics of the photoluminescence of the CdSe@ZnS core–shell QDs-based composite.
The distribution of CdSe@ZnS core–shell QDs in the tensile bars before and after the tensile tests was characterized by HRTEM. Segments of 60 nm in thickness obtained from the specimens along the stretching direction were used in the HRTEM characterization. Fig. 5 shows typical TEM images of the surface of the tensile bars over an area of 280 × 425 nm2 before and after the tensile deformation, in which the QDs are circled in red circles. QDs were randomly distributed in the tensile bars. As shown in Fig. 5, the numbers of QDs present in an area of 280 × 425 nm2 for the un-deformed specimen and the deformed specimen are 7 and 5, respectively. The same measurement was carried out at four different locations. The average numbers of QDs present in an area of 280 × 425 nm2 for the un-deformed specimen and the deformed specimen are 6 ± 1 and 4 ± 1, respectively. The tensile deformation causes the redistribution of QDs and leads to slight decrease of the QDs per unit area.
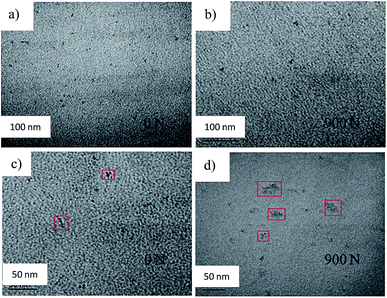
To confirm the deformation-induced change of the number of QDs per unit area, tensile specimens with a large amount of CdSe@ZnS core–shell QDs were prepared in which the amount of CdSe@ZnS core–shell QDs in 1 mL of chloroform was 75 mg. Fig. 6 shows typical TEM images of the segments obtained from the tensile specimens over an area of 280 × 425 nm2 before and after the tensile deformation with the maximum tensile force of 900 N. The QDs-based composite made from the large amount of CdSe@ZnS core–shell QDs in 1 mL of chloroform has a larger number of QDs per unit area (volume) than that made from the small amount of CdSe@ZnS core–shell QDs in 1 mL of chloroform, as demonstrated in Fig. 6a and b. There are clusters of QDs, i.e. aggregates of QDs, formed in the prepared QDs-based tensile bars, as observed in Fig. 6c. After being subjected to the tensile deformation, in which permanent deformation was produced, the aggregates of QDs were deformed and the QDs were separated slightly away from the centers of the associated clusters. More QDs will be exposed to the irradiation of UV light during the tensile deformation, likely resulting in the increase of the PL intensity.
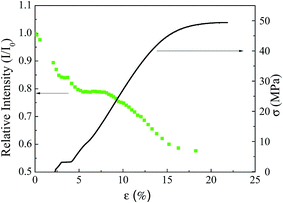
Define relative PL intensity as I/I0, in which I is the PL intensity at time t and I0 is the PL intensity at the start of a tensile test, i.e. without any mechanical loading. Fig. 7 shows the real-time variation of the PL intensity of a QDs-based tensile bar with tensile strain during the tensile test. The relative PL intensity decreases with increasing tensile strain; the relative PL intensity is 70% for the engineering tensile strain of ∼16%. Note that slight increase in the relative PL intensity also was observed for some QDs-based tensile bars shortly after the start of the tensile test. In general, the overall trend shows that the relative PL intensity decreases with increasing tensile strain for the tensile deformation of the tensile bars made from the CdSe@ZnS core–shell QDs-based composite. As shown in Fig. 5 and 6, the numbers of QDs per unit area decrease with increasing tensile strain, and the tensile strain can cause the separation of QDs from the aggregates of QDs, leading to the increase of the numbers of QDs per unit area. The change of the numbers of QDs per unit area likely contributes partially to the change of the relative PL intensity during the tensile tests.
In general, the PL intensity of a given amount of QDs will likely be related to their quantum yield, i.e. QDs with lower quantum yields will produce lower PL intensity. Biju et al.26 investigated the PL efficiencies and lifetimes of CdSe QDs under photoactivation in various chemical environments including polymer solutions and solvent systems, and concluded that the static passivation of the surface defects of QDs by polymer chains was responsible for the increase of the PL intensity. Carrillo-Carrion et al.25 suggested that the photoactivation process depends on several factors, including atmospheric conditions (oxygen, humidity), intensity of light, presence of water, polarity of the solvent, and there mainly exist four principal pathways for the photoactivation phenomenon. One might expect that the tensile deformation introduces the change of the factors associated with the photoactivation process of the CdSe@ZnS core–shell QDs, resulting in the decrease of the PL intensity.
Chen et al.27 used the Matthews-Blakeslee theory as a first-order approximation to analyze the strain effects on the optical response of core/shell hetero-nanostructures. They considered the formation of strain-induced misfit dislocations and obtained a critical thickness of <1 nm. It is known that the ideal strength of a crystal derived from sinusoidal shear resistance, τi, is28
 | (1) |
 | (2) |
The Young's moduli of CdSe and ZnS are 60 and 96.5 GPa,29 respectively. Using Poisson's ratio of 0.3, the Young's moduli and eqn (2), the critical stress for the nucleation of a defect (dislocation) in a CdSe@ZnS core/shell hetero-nanostructure is about 367 MPa.
For the uniaxial tension of a tensile bar with a spherical inclusion, the stress concentration, K, is30
 | (3) |
To indirectly examine the effect of the numbers of QDs per unit area on the PL intensity associated with the variation of the relative PL intensity with tensile strain, CdSe@ZnS core–shell QDs-based composites were prepared from the solutions with different amounts of CdSe@ZnS core–shell QDs in 1 mL of chloroform. Fig. 8 shows the PL spectra of the CdSe@ZnS core–shell QDs-based composites made from the solutions with different amounts of CdSe@ZnS core–shell QDs in 1 mL of chloroform under the irradiation of UV light. The maximum PL intensity occurs at the wavelength of ∼531.2 nm, which is slightly larger than 527.6 nm of the pure CdSe@ZnS core–shell QDs (Fig. 4). There is no observable shift of the wavelength corresponding to the maximum PL intensity for different amounts of CdSe@ZnS core–shell QDs in 1 mL of chloroform. The difference between the characteristic wavelength corresponding to the maximum PL intensity of the pure QDs and that of the QDs-based composite is likely due to the presence of epoxy, which introduces an interface between the QDs and epoxy with properties different from that between the QDs and the solution.
 | ||
| Fig. 8 PL spectrum of the CdSe@ZnS core–shell QDs-based composites made from the solutions with different amounts of CdSe@ZnS core–shell QDs in 1 mL of chloroform. | ||
Using the results in Fig. 8, the variation of the maximum PL intensity with the amount of CdSe@ZnS core–shell QDs in 1 mL of chloroform is depicted in Fig. 9. The maximum PL intensity increases with increasing the concentration of CdSe@ZnS core–shell QDs, similar to the results for the CdSe/ZnS core–shell QDs with different concentrations from 9.0 mg to 300 mg in 5 mL of benzene reported by Ibnaouf et al.31 It is known that, at steady state, the PL intensity, I, is approximately determined by the amount of capture (the fractions of photo-generated carriers captured into QDs) and can be approximated as
| I = cΓ | (4) |
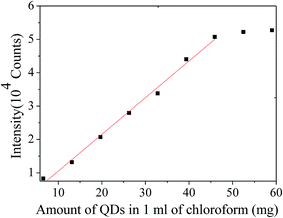 | ||
| Fig. 9 Variation of the maximum PL intensity with the amount of CdSe@ZnS core–shell QDs in 1 mL of chloroform. | ||
For the epoxy resin cured, one can approximate its deformation as viscoelastic. The volumetric strain, εv, can be calculated as
| εv = (1 − 2νe)ε | (5) |
 | (6) |
 | (7) |
It is known that the Poisson ratio of epoxy is in the range of 0.4–0.5.32,33 Using νe = 0.4 and ε = 0.15 from Fig. 7, the density change of QDs is 3%.
Using linear fitting to fit the data in Fig. 9 for the amount of the CdSe@ZnS core–shell QDs in 1 mL of chloroform less than 52.49 mg mL−1, one obtains a proportionality of 0.11 (10−4 counts per (mg mL−1)) between the intensity and the amount of the CdSe@ZnS core–shell QDs in 1 mL of chloroform, i.e. I = 0.11ρ. The change in the relative PL intensity for 25 mg of the CdSe@ZnS core–shell QDs in 1 mL of chloroform is ∼1.1%, which is much less than the strain-induced decrease of the PL intensity as shown in Fig. 7. Thus, the strain-induced decrease of the PL intensity as shown in Fig. 7 cannot be simply attributed to the decrease of the number of QDs per unit area.
For a tensile test with a displacement speed of 10 mm min−1, the time to reach 5.5 mm is 33 s, which is much larger than the characteristic time for the decay of the PL intensity of QDs reported in literature.23,34,35 Thus, the decay of the PL intensity with time cannot be the reason for the strain-induced decrease of the PL intensity of the tensile bars made from the CdSe@ZnS core–shell QDs-based composite.
The decay of the PL intensity of the CdSe@ZnS core–shell QDs-based composite was examined under the irradiation of UV light. Fig. 10 shows the temporal variation of the PL intensity of the CdSe@ZnS core–shell QDs-based composite. In the time period of ∼275 s, there is less than 3% decay of the PL intensity, which is much less than the 30% decrease of the PL intensity induced by the tensile deformation. This result supports the above discussion that the strain-induced decrease of the PL intensity cannot be attributed to the decay of the PL intensity with time.
As shown in Fig. 8, there is no observable shift of the wavelength of the maximum PL intensity under the irradiation of UV light. This result suggests that the mechanical strain in the QDs is not large enough since the cured bisphenol-A type epoxy resin is relatively soft and viscoelastic. It is known that the polymer chains at un-deformed state are present in the form of coils. The tensile deformation of a polymer bar can cause the change of the distribution of molecular conformations and result in the stretch and re-orientation of polymer coils. The stretch and re-orientation of polymer coils can alter the optical behavior of the polymer and enhance the migration of quenchers, such as oxygen, into the polymer, which might lead to the change of the PL intensity of the tensile bars made from the CdSe@ZnS core–shell QDs-based composite.
The plastic deformation of a glassy polymer involves structural rearrangement associated with the increase in the value of free volume and the decrease in the value of inter-chain entanglement with the increase in mechanical strain.36 According to the Tait equation,37 the pressure dependence of free volume can be expressed as
 | (8) |
 | (9) |
The tensile-plastic deformation leads to the increase of the fractional free volume, which can allow more quenchers to migrate into the polymer. This trend will cause the decrease of the PL intensity of the tensile bars with increasing tensile stress in the region of plastic deformation.
To examine the effect of cyclic loading on the PL response of the CdSe@ZnS core–shell QDs-based composite, the mixture of bisphenol-A type epoxy resin/modified amine and CdSe@ZnS core–shell QDs of 25 mg in 1 mL chloroform was spin-coated on the surface of tensile bars made of aluminum alloy AA 7009. The samples were placed in a vacuum to cure the epoxy with the CdSe@ZnS core–shell QDs and to ensure flat surface without the presence of air bubbles.
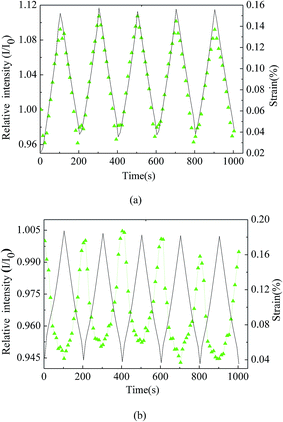
Cyclic loading and unloading of the AA 7009 tensile bars with the surface coating of the CdSe@ZnS core–shell QDs-based composite was performed at room temperature, using a universal testing machine (MTS-SANS, CMT5504). The specimen was mounted to the pinned grips at both sides, and the force was applied to the specimen by moving the upper grip. A constant loading rate of 0.1 kN s−1 was used, and the maximum tensile force was 5.5 kN. Fig. 11 shows the temporal variation of the PL intensity and engineering tensile strain for five cycles of loading and unloading, in which the decay of the PL intensity, as shown in Fig. 10, was used to eliminate the effect of the decay of the PL intensity. Note that the maximum engineering strain for the cyclic deformation is less than 0.2%, which is much smaller than 21% for the tensile test shown in Fig. 7. The AA 7009 bars are at the state of elastic deformation, while the CdSe@ZnS core–shell QDs-based composite is likely at the state of viscoelastic deformation. It is interesting to note that there are two major modes for the temporal variation of the PL intensity for the cyclic deformation of small strain. One exhibits in-phase change of the PL intensity, i.e. the PL intensity increases with increasing engineering strain and decreases with decreasing engineering strain (Fig. 11a); the other exhibits antiphase change of the PL intensity, i.e. the PL intensity decreases with increasing engineering strain and increases with decreasing engineering strain (Fig. 11b). The fraction for each mode is ∼45% out of more than 20 tests. The difference of the PL intensity between the maximum PL intensity and the minimum PL intensity for each cycle is less than 16% for the experimental conditions. Both modes demonstrate a certain degree of “memory” effect, i.e. the PL characteristics approximately remain the same after unloading (ε = 0).
According to Fig. 11, the maximum relative PL intensity at the maximum load during the cyclic deformation is always larger than 1 for the in-phase mode and mostly less than 1 for the antiphase mode. Such behavior suggests that there exists interaction between the CdSe@ZnS core–shell QDs and the bisphenol-A type epoxy resin, which is strain-dependent. It needs to point out that the underlying mechanism for such behavior is unclear. It might be associated the processes of the tension-induced separation of the aggregates of QDs and the tension-induced decrease of the concentration of QDs during the cyclic loading of small strain.
4. Summary
In summary, the composite consisting of CdSe@ZnS core–shell QDs and bisphenol-A type epoxy resin was prepared by mixing the solution of CdSe@ZnS core–shell QDs in chloroform with the solution of bisphenol-A type epoxy resin/modified amine at room temperature. Tensile tests of the tensile specimens made from the QDs-based composite were performed under the irradiation of UV light. No shift of the wavelength corresponding to the maximum PL intensity was observed, in contrast to the reports in literature, which suggests that the mechanical strain used is not large enough. On the contrary, the tensile deformation led to significant decrease of the PL intensity of the QDs-based composite for large engineering strains, which cannot simply be explained by the decrease of the concentration of QDs induced by tensile strain. The variation of the PL intensity with tensile strain suggests that the stretch and re-orientation of polymer coils due to plastic deformation can alter the optical behavior of the QDs-based composite and enhance the migration of quenchers, such as oxygen, into the material, which might lead to the change of the PL intensity of the tensile specimens under the irradiation of UV light.The PL characteristics of the CdSe@ZnS core–shell QDs in the bisphenol-A type epoxy under cyclic loading and unloading were also determined by performing the cyclic loading-unloading tests of AA 7009 tensile bars coated with the QDs-based composite. There are two major modes for the temporal variation of the PL intensity for the cyclic deformation of small strain. One exhibits in-phase characteristic with engineering strain, and the other exhibits antiphase characteristic with engineering strain. Both modes demonstrate a certain degree of “memory” effect. The maximum relative PL intensity at the maximum load during the cyclic deformation is always larger than 1 for the in-phase mode and mostly less than 1 for the antiphase mode.
The experimental results demonstrate the strain-dependence of the PL characteristics of the CdSe@ZnS core–shell QDs embedded in the bisphenol-A type epoxy. The PL characteristics of the QDs-based composites can be optimized through the design and optimization of the interaction between QDs and epoxy, which likely will make it possible to prepare opto-mechanical systems sensitive to strains of a variety of magnitudes.
Acknowledgements
WL is grateful for the financial support from the National Natural Science Fund of China (51172072, 51475166) and the National Basic Research Program of China (2013CB035505). FY is grateful for the financial support from the KSEF (KSEF-148-502-15-341).References
- X. Michalet, F. Pinaud, T. D. Lacoste, M. Dahan, M. P. Bruchez, A. P. Alivisatos and S. Weiss, Single Mol., 2001, 2, 261–276 CrossRef CAS.
- A. J. Nozik, Inorg. Chem., 2005, 44, 6893–6899 CrossRef CAS PubMed.
- D. Vasudevan, R. R. Gaddam, A. Trinchi and I. Cole, J. Alloys Compd., 2015, 636, 395–404 CrossRef CAS.
- R. Sarma and D. Mohanta, J. Lumin., 2015, 161, 395–402 CrossRef CAS.
- S. Y. Li, Z. Z. Sun, R. Li, M. M. Dong, L. Y. Zhang, W. Qi, X. L. Zhang and H. Wang, Sci. Rep., 2015, 5, 8475 CrossRef CAS PubMed.
- B. A. Kairdolf, A. M. Smith, T. H. Stokes, M. D. Wang, A. N. Young and S. M. Nie, Annu. Rev. Anal. Chem., 2013, 6, 143–162 CrossRef CAS PubMed.
- J. R. Gell, M. B. Ward, R. J. Young, R. M. Stevenson, P. Atkinson, D. Anderson, G. A. C. Jones, D. A. Ritchie and A. J. Shields, Appl. Phys. Lett., 2008, 93, 081115 CrossRef.
- T. Nakaoka, T. Kakitsuka, T. Saito and Y. Arakawa, Appl. Phys. Lett., 2004, 84, 1392–1394 CrossRef CAS.
- G. W. Bryant, M. Zielinski, N. Malkova, J. Sims, W. Jaskolski and J. Aizpurua, Phys. Rev. B: Condens. Matter Mater. Phys., 2011, 84, 235412 CrossRef.
- J. Persson, U. Hakanson, M. K. J. Johansson, L. Samuelson and M. E. Pistol, Phys. Rev. B: Condens. Matter Mater. Phys., 2005, 72, 085302 CrossRef.
- F. Ding, R. Singh, J. D. Plumhof, T. Zander, V. Krapek, Y. H. Chen, M. Benyoucef, V. Zwiller, K. Dorr, G. Bester, A. Rastelli and O. G. Schmidt, Phys. Rev. Lett., 2010, 104, 067405 CrossRef CAS PubMed.
- Y. Fu, Q. X. Zhao, F. Ferdos, M. Sadeghi, S. M. Wang and A. Larsson, Superlattices Microstruct., 2001, 30, 205–213 CrossRef CAS.
- X. B. Han, L. Z. Kou, X. L. Lang, J. B. Xia, N. Wang, R. Qin, J. Lu, J. Xu, Z. M. Liao, X. Z. Zhang, X. D. Shan, X. F. Song, J. Y. Gao, W. L. Guo and D. P. Yu, Adv. Mater., 2009, 21, 4937–4941 CrossRef CAS PubMed.
- B. Wei, K. Zheng, Y. Ji, Y. F. Zhang, Z. Zhang and X. D. Han, Nano Lett., 2012, 12, 4595–4599 CrossRef CAS PubMed.
- B. Wei, Y. Ji, X. D. Han, Z. Zhang and J. Zou, Opt. Express, 2014, 22, 4000–4005 CrossRef CAS PubMed.
- X. B. Han, L. Z. Kou, Z. H. Zhang, Z. Y. Zhang, X. L. Zhu, J. Xu, Z. M. Liao, W. L. Guo and D. P. Yu, Adv. Mater., 2012, 24, 4707–4711 CrossRef CAS PubMed.
- C. L. Choi, K. J. Koski, S. Sivasankar and A. P. Alivisatos, Nano Lett., 2009, 9, 3544–3549 CrossRef CAS PubMed.
- C. L. Choi, K. J. Koski, A. C. K. Olson and A. P. Alivisatos, Proc. Natl. Acad. Sci. U. S. A., 2010, 107, 21306–21310 CrossRef CAS PubMed.
- Z. Wan, H. W. Yang, W. L. Luan, S. T. Tu and X. G. Zhou, Nanoscale Res. Lett., 2010, 5, 130–137 CrossRef CAS PubMed.
- Z. Wan, W. L. Luan and S. T. Tu, J. Phys. Chem. C, 2011, 115, 1569–1575 CAS.
- H. W. Yang, W. L. Luan, S. T. Tu and Z. M. M. Wang, Lab Chip, 2008, 8, 451–455 RSC.
- W. L. Luan, H. W. Yang, Z. Wan, B. X. Yuan, X. H. Yu and S. T. Tu, J. Nanopart. Res., 2012, 14, 762 CrossRef.
- V. Nandwana, C. Subramani, Y. C. Yeh, B. Q. Yang, S. Dickert, M. D. Barnes, M. T. Tuominen and V. M. Rotello, J. Mater. Chem., 2011, 21, 16859–16862 RSC.
- S. Mathew, B. S. Bhardwaj, A. D. Saran, P. Radhakrishnan, V. P. N. Nampoori, C. P. G. Vallabhan and J. R. Bellare, Opt. Mater., 2015, 39, 46–51 CrossRef CAS.
- C. Carrillo-Carrion, S. Cardenas, B. M. Simonet and M. Valcarcel, Chem. Commun., 2009, 5214–5226 RSC.
- V. Biju, R. Kanemoto, Y. Matsumoto, S. Ishii, S. Nakanishi, T. Itoh, Y. Baba and M. Ishikawa, J. Phys. Chem. C, 2007, 111, 7924–7932 CAS.
- X. B. Chen, Y. B. Lou, A. C. Samia and C. Burda, Nano Lett., 2003, 3, 799–803 CrossRef CAS.
- G. S. Xu and C. L. Zhang, J. Mech. Phys. Solids, 2003, 51, 1371–1394 CrossRef.
- U. Rössler, Semiconductors: II-VI and I-VII Compounds; Semimagnetic Compounds. Landolt-Börnstein, New Series, Springer-Verlag, Berlin, Heidelberg, 1983, vol. 3 Search PubMed.
- P. C. Paris, T. Palin-Luc, H. Tada and N. Saintier, Stresses and crack tip stress intensity factors aroundspherical and cylindrical voids and inclusions of differing elastic properties and with misfit sizes, CP2009, 2013 Search PubMed.
- K. H. Ibnaouf, S. Prasad, M. S. Al Salhi, A. Hamdan, M. B. Zaman and L. El Mir, J. Lumin., 2014, 149, 369–373 CrossRef CAS.
- D. J. O'Brien, N. R. Sottos and S. R. White, Exp. Mech., 2007, 47, 237–249 CrossRef.
- S. Pandini and A. Pegoretti, Polym. Eng. Sci., 2008, 48, 1434–1441 CAS.
- Y. L. Zhang, X. G. Kong, Y. Q. Qu, P. T. Jing, Q. H. Zeng, Y. J. Sun, A. Y. Wang, J. L. Zhao and H. Zhang, J. Lumin., 2009, 129, 1410–1414 CrossRef CAS.
- L. H. Jing, S. V. Kershaw, T. Kipp, S. Kalytchuk, K. Ding, J. F. Zeng, M. X. Jiao, X. Y. Sun, A. Mews, A. L. Rogach and M. Y. Gao, J. Am. Chem. Soc., 2015, 137, 2073–2084 CrossRef CAS PubMed.
- A. A. Pacheco and R. C. Batra, Polymer, 2013, 54, 819–840 CrossRef CAS.
- C. F. Popelar and K. M. Liechti, Mech. Time-Depend. Mater., 2003, 7, 89–141 CrossRef CAS.
| This journal is © The Royal Society of Chemistry 2016 |


