DOI:
10.1039/C5RA25800F
(Paper)
RSC Adv., 2016,
6, 4085-4089
Near-infrared down-conversion in Er3+–Yb3+ co-doped transparent nanostructured glass ceramics for crystalline silicon solar cells†
Received
3rd December 2015
, Accepted 15th December 2015
First published on 18th December 2015
Abstract
A two-step energy transfer was achieved in Er3+–Yb3+ co-doped transparent glass ceramics containing CaF2 nanocrystals, which involved down-conversion of an absorbed visible photon to two emitted near-infrared photons. Therefore, the Yb3+ emission centered at 980 nm was efficiently enhanced in response to the strongest absorption of crystalline silicon solar cells. The mechanisms of the two-step energy transfer mechanism were verified based on spectral and lifetime measurements, and the maximal energy transfer efficiency and corresponding quantum yield obtained were as high as 75.3% and 150.6%, respectively. As a result, near-infrared quantum cutting transparent glass ceramics will open a route to enhance the energy efficiency of silicon solar cells.
Introduction
Crystalline silicon (c-Si) solar cells, which are extensively used in everyday life, have been particularly appealing.1,2 However, a large part of the solar energy is dissipated during the photovoltaic process owing to the thermalization of charge carriers whose energy exceeds the c-Si energy gap (Eg = 1.12 eV), significantly limiting the conversion efficiency of solar cells.3 Adapting the solar spectrum through down-conversion (DC) is an optimal scheme for reducing the energy loss caused by the thermalization, which involves the conversion of one ultraviolet (UV)-visible photon into two near-infrared (NIR) photons.4–6 Recently, NIR DC in RE3+/Yb3+ (RE = Tb,7–9 Pr,8,10,11 Tm,8,10,12,13 Ce,14,15 and Eu16,17) co-doped systems have been intensively investigated, on which RE3+ is excited by Yb3+ with a UV or visible photon and two NIR photons ∼980 nm are emitted, which can be efficiently absorbed by c-Si solar cells through a DC process.
However, most of the DC between RE3+ and Yb3+ is achieved via a one-step cooperative energy transfer (ET) process, during which the system exhibits low emission intensity owing to concentration quenching and low energy transfer efficiency (ETE) between RE3+ and Yb3+.12,18,19 For more efficient DC, a two-step ET mechanism has been presented for Nd3+–Yb3+,20 Pr3+–Yb3+,21 and Er3+–Yb3+ (ref. 22) lanthanide ion couples (to our knowledge). This two-step DC energy transfer is effective only when the donor has a suitable intermediate state to assist the sequential energy transfer to the acceptor. Herein, we focus on the Er3+–Yb3+ couple, which may suit for this condition (4I11/2 for Er3+). Nevertheless, efficient DC by a two-step process cannot be easily implemented for the Er3+–Yb3+ co-doped system due to the fast multi-photon relaxation from the 4F7/2 level.23 Some studies have been performed for Er3+–Yb3+ co-doped halides with low photon energy, but their applications are limited because of the poor thermal stability and adverse light scattering.22,24
Recently, oxyfluoride glass ceramics (GCs) have attracted considerable attention because of their low phonon energy and high chemical and mechanical stability,25–27 which can suppress multi-photon relaxation processes between the adjacent energy levels in Er3+ and enable efficient two-step ET from the 4F7/2 level of Er3+. Therefore, nanostructured GCs have been chosen as the host for the Er3+–Yb3+ couple to compensate for the shortcomings of the aforementioned hosts in our report. In addition, evidence for the two-step ET process between the Er3+ and Yb3+ ions is presented based on spectral and lifetime measurements of Er3+–Yb3+ co-doped GCs. Cross relaxation (CR) participates in the first ET step, leading to an Er3+ population in the 4I11/2 level and Yb3+ in the 2F5/2 state. Subsequently, Er3+ will transfer another part of the energy to Yb3+ via a direct ET process in the second step. Both steps result in a NIR photon due to Yb3+ 2F5/2 → 2F7/2 transition. Finally, the calculated energy transfer efficiency (ETE) and the quantum yield (QY) of nanostructured GCs were as high as 75.3% and 150.6%, respectively. Therefore, the Er3+–Yb3+ co-doped transparent nanostructured GCs make it possible to enhance the efficiency of c-Si solar cells as a DC layer.
Experimental
Synthesis of oxyfluoride GCs
The precursor oxyfluoride glass was prepared by the conventional melt-quenching method using high-purity reagent powders. The composition of the host precursor glass was 45SiO2–15Al2O3–20LiF–20CaF2 in mol%. For each batch, about 20 g of mixed original materials were melted in a covered corundum crucible under a dry argon atmosphere at 1500 °C for 1 h, and then cast into a brass mold to form the precursor glass (PG). RE3+ was introduced in the form of Er2O3 and Yb2O3. The Er3+ concentration was fixed to 0.5 mol%, while the Yb3+ concentrations were set to 0, 0.5, 1.0, 2.0, and 5.0 mol%. The PG samples were subsequently heat-treated at 580 °C for 12 h to obtain GCs through crystallization. The GCs doped with different RE3+ concentrations are denoted as GC0, GC1, GC2, GC3 and GC4, respectively.
Characterization of materials
To confirm the crystallization phase of the oxyfluoride glass, X-ray diffraction (XRD) analysis was performed using a D/Max-3C diffractometer with Cu Kα radiation (1.5405 Å, 40 kV, 60 mA). The sizes and shapes of the glass nanocrystals were characterized by high resolution transmission electron microscopy (HRTEM, JEM2100). The visible-NIR absorption spectra were obtained using a Perkin-Elmer UV/vis/NIR Lambda 900 spectrophotometer. The excitation spectra and the emission spectra, both in the visible and NIR regions, were recorded on an FLSP920 spectrofluorometer (Edinburgh Instruments, Britain). The emission and excitation measurements were performed using a 450 W Xe lamp as the excitation source with different detectors. The decay curves for the Er3+ 486 nm and 948 nm emissions upon 460 nm excitation were recorded using a μF900 pulse xenon lamp.
Results and discussion
Structure behaviour
The XRD patterns of PG and GC are shown in Fig. 1(a). The curve for the PG sample exhibits representative broad humps, indicating the amorphous structure of the material. After the thermal treatment at 580 °C for 12 h, the characteristic XRD peaks were observed at 2θ = 28.21°, 47.01°, and 55.81°, confirming the orthorhombic CaF2 (JCPDS 35-0816). The nanocrystal size was evaluated to be 10 nm using the Scherrer formula. According to TEM image in Fig. 1(b) and scanning transmission electron microscopy (STEM) image in Fig. 1(c), nanoparticles with a size of 8–10 nm were distributed homogeneously in the glass matrix, which is in accordance with the XRD result. Fig. 1(d) shows a high resolution TEM (HRTEM) image of individual CaF2 nanocrystal. The measured lattice spacing is 0.32 nm, which can be indexed to the (111) lattice plane of orthorhombic CaF2, which is consistent with the XRD patterns in Fig. 1(a).
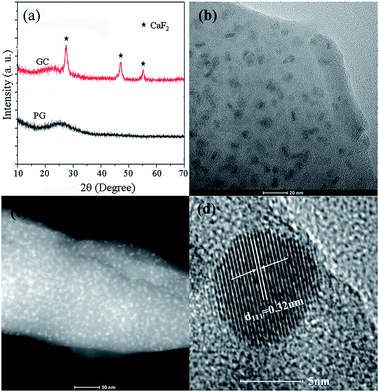 |
| | Fig. 1 (a) XRD patterns of PG and GC; (b) TEM image of GC containing 0.5Eu2+/0.5Yb3+:CaF2 (GC1); (c) STEM image of GC containing 0.5Eu2+/0.5Yb3+:CaF2 (GC1) and (d) HRTEM image of individual nanocrystal. | |
Optical properties
The absorption spectra of the Er3+ single-doped (GC0) and Er3+–Yb3+ co-doped containing 0.5Eu2+/0.5Yb3+:CaF2 (GC1) samples are presented in Fig. 2. The UV absorption edge that limits the glass transparency at shorter wavelengths is caused by the electronic transitions in the host glass.20 Fig. 2 shows that the peaks observed in the absorption spectrum of the GC0 are centered at 400, 460, 488, 520, 543, 650, 796, 948, and 1520 nm; these peaks were ascribed to the absorption transitions from the 4I15/2 ground state to every excited state of the Er3+ ion, including 2H9/2, 4F5/2, 4F7/2, 2H11/2, 4S3/2, 4F9/2, 4I9/2, 4I11/2, and 4I13/2, respectively. With the addition of Yb3+ ions (GC1), the peak wavelengths of all the absorption bands were almost identical for the GC0 sample, while the absorption band at ∼980 nm became wider and stronger owing to overlap between the Yb3+ 2F7/2–2F5/2 and Er3+ 4I15/2–4I11/2 transitions.
 |
| | Fig. 2 Absorption spectra of Er3+ single-doped (GC0) and Er3+–Yb3+ co-doped GC containing 0.5Eu2+/0.5Yb3+:CaF2 (GC1). | |
Luminescence of Er3+ single doped and Er3+–Yb3+ co-doped GCs
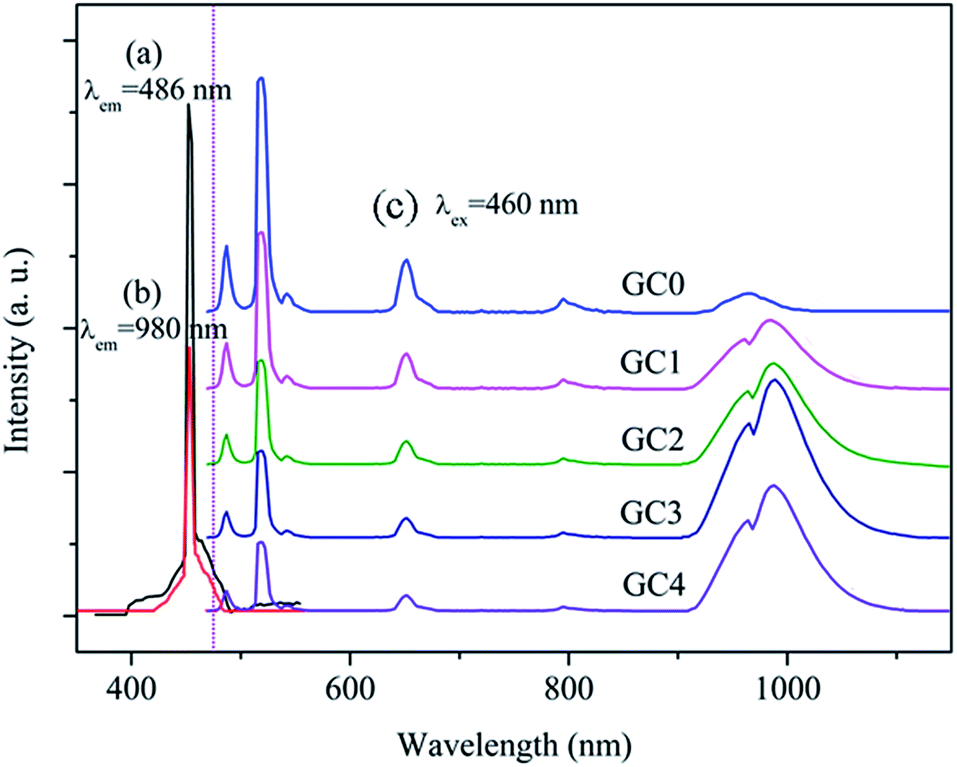
The photoluminescence excitation (PLE) and photoluminescence (PL) spectra in the GCs were measured to investigate whether the ET occurred from Er3+ to Yb3+. The PLE spectra of Fig. 3(a) and (b) reveal sharp excitation bands peaked at 460 nm, corresponding to the Er3+:4I15/2 → 4F5/2 transition, which were recorded by monitoring both the Er3+:4F7/2 → 4I15/2 transition at 486 nm and the Yb3+:2F5/2 → 2F7/2 transition at 980 nm, verifying the existence of ET from Er3+ to Yb3+. Furthermore, in the PL spectra of Fig. 3(c), a series of sharp emission peaks in the visible-NIR region can be observed upon 460 nm excitation, which decrease monotonously with increasing Yb3+ concentration, while the intensity of Yb3+ 980 nm emission increases greatly simultaneously; this further elucidates the ET process from Er3+ to Yb3+. However, as the concentration of Yb3+ was increased from 2 mol% to 5 mol%, the emission intensity of Yb3+ at 980 nm becomes weaker than that of GC3, revealing the occurrence of cross-relaxation between the Yb3+ ions with increasing Yb3+ concentration and reduced luminescence yield.
 |
| | Fig. 3 (a) PLE spectrum monitored by the Er3+:4F7/2 → 4I15/2 emission (486 nm) and (b) the Yb3+:2F5/2 → 2F7/2 emission (980 nm) in the GCs; (c) PL spectra of Er3+ in the GCs with different Yb3+ concentrations upon excitation at 460 nm. | |
Mechanisms of ET from Er3+:4F7/2 to Yb3+ in Pr3+–Yb3+ co-doped GCs
To further examine the ET mechanism of DC, the photoluminescence spectra from 900 to 1100 nm for GC0 to GC4 are demonstrated in Fig. 4(a). The emission spectra centered at 980 nm for GC1 to GC4 can be decomposed into two independent peaks according to Gaussian deconvolution, which are ascribed to the Er3+:4I11/2 → 4I15/2 (948 nm) and Yb3+:2F5/2 → 2F7/2 (980 nm) transitions. In Fig. 4(b), the emission spectra of Er3+ 948 nm have been normalized by the intensity of Er3+:4F9/2 → 4I15/2 (650 nm), and the latter does not participate in the ET process. The result shows that the relative emission intensities of Er3+ 948 nm to 650 nm increase obviously with increasing Yb3+ concentration.
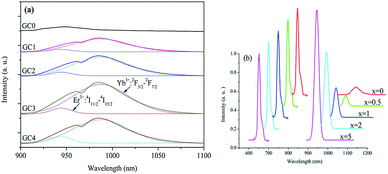 |
| | Fig. 4 (a) Photoluminescence (PL) spectra between 900 and 1100 nm in GCs and corresponding Gaussian deconvolution; (b) change in relative emission intensity of Er3+ 948 nm (normalized by the intensities of 4F9/2 → 4I15/2 emissions). | |
According to the abovementioned analysis of Fig. 4(a) and (b), the following conclusion can be drawn. First, the emission intensities of Er3+ 948 nm increase gradually from GC0 to GC4 because more photons were populating the 4I11/2 energy level; subsequently, the emission intensities of Yb3+ are enhanced except for the concentration quenching in GC4. The results make it possible for cross relaxation (CR) from Er3+:4F7/2 to Yb3+:2F7/2. Second, it is also possible that the Er3+ 4F7/2 state transfers all the excitation energy directly to Yb3+. However, direct ET will only populate the 2F5/2 state of Yb3+ and cannot influence the change in the relative intensities of Er3+ 4I11/2. On the other hand, for CR, it will fill the excited states of Yb3+ and simultaneously increase the population of the Er3+ 4I11/2 state with increasing Yb3+ concentration. Therefore, the increase in the relative intensities of Er3+ 948 nm to 650 nm should be attributed to CR: Er3+ (4F7/2 → 4I11/2)–Yb3+ (2F7/2 → 2F5/2), and the CR from Er3+ 4F7/2 to Yb3+ 2F7/2 dominates the first-step ET process.
Mechanisms of ET from Er3+:4I11/2 to Yb3+ in Er3+–Yb3+ co-doped GCs
To determine the second-step ET mechanism between Er3+ and Yb3+, the typical luminescent dynamics of Er3+ 4F7/2 and 4I11/2 emissions in GCs were plotted, as shown in Fig. 5. Fig. 5(b) displays the decay curves of the Er3+ 4I11/2 state, it can be seen that the Er3+ single-doped GC shows a nearly single exponential decay. On the other hand, for Er3+–Yb3+ co-doped GCs, the decay curves obviously deviate from single exponentials with increasing of Yb3+ concentration. Because the Er3+ concentration is fixed to 0.5 mol% in the four different GCs samples, the decrease in the lifetime should not be ascribed to concentration quenching of Er3+ but to direct ET from Er3+ 4I11/2 to Yb3+ 2F5/2, which indicates that a part of energy of the Er3+ 4I11/2 is transferred to Yb3+ instead of being emitted in the Er3+:4I11/2–4I15/2 transition completely. However, the rise component was not observed, which may be due to the rapid depopulation process of 4I11/2 state. Therefore, the direct ET from Er3+ 4I11/2 to Yb3+ 2F5/2 is the second-step ET process according to Fig. 5(b).
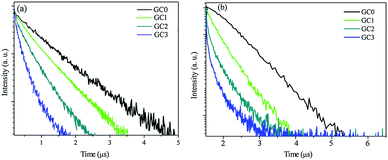 |
| | Fig. 5 Decay curves of (a) Er3+:4F7/2 → 4I11/2 transition under 486 nm (b) Er3+:4I11/2 → 4I15/2 transition (948 nm) under 460 nm excitation. | |
Fig. 5(a) exhibits the luminescence decay curves of the Er3+ 4F7/2 state. It can be clearly seen that the lifetime of Er3+ 4F7/2 (486 nm emission) decreased rapidly, which can be explained by the introduction of an extra relaxation pathway (CR ET process from Er3+ 4F7/2 to Yb3+ 2F5/2, as reported above). The mean lifetime τm of 486 nm emission upon 460 nm excitation was calculated as follows:
where
I(
t) is the luminescence intensity and
I0 is the maximal value of
I(
t) that occurs at time
t0. The ETE is defined as the ratio of the number of donors that are depopulated by the ET to the acceptors over the total number of excited donors. The overall theoretical ETE for the GC samples can be calculated using the following equation:
As shown in Fig. 6, the τm and ETE were plotted vs. the concentration of Yb3+ ions, for GC0 to GC3. The lifetime decreased from 0.78 μs to 0.62 μs with increasing Yb3+ content from 0 mol% to 2 mol%, while the ETE increased to 75.3% with x = 2 mol% composition of Yb3+ content.
 |
| | Fig. 6 Mean decay lifetimes of the Er3+:4F7/2 → 4I11/2 transition and ETE between the Er3+ and Yb3+ as a function of Yb3+ concentrations in GC0 to GC3. | |
In addition, the QY of Yb3+ is related to ηETE as follows:
where
ηYb is the quantum emission efficiency of Yb
3+, which is normally about 100% owing to the low multi-photon relaxation rate and large energy gap between the
2F
7/2 and
2F
5/2 energy states.
28 The corresponding QY for the GC1, GC2, and GC3 were 70.2%, 136.6%, and 150.6%, respectively.
The two-step ET mechanism
In Fig. 7, the energy levels of Er3+ and Yb3+ are schematically illustrated, and a possible DC mechanism is also proposed for explaining the two-step ET between Er3+ and Yb3+. When Er3+ is excited into the 4F5/2 state upon 460 nm excitation and subsequently relaxes to the 4F7/2 state, the 4F7/2 state depopulates through a two-step sequential ET from Er3+ to Yb3+, with Er3+:4I11/2 acting as the intermediate state. In the first step (indicated by ①), a part of the Er3+ energy is transferred to Yb3+ according to the CR: Er3+:4F7/2 + Yb3+:2F7/2 → Er3+:4I11/2 + Yb3+:2F5/2, the first NIR photon is acquired and Er3+ is still in the excited state 4I11/2. In the second step (indicated by ②), another part of the energy of Er3+ is transferred to the second Yb3+ ion according to a direct ET process and the second NIR photon is emitted, which is shown as Er3+:4I11/2 + Yb3+:2F7/2 → Er3+:4I15/2 + Yb3+:2F5/2. The emission of the Er3+:4I11/2–4I15/2 transition may occur and acquire another NIR photon (indicated by ③).
 |
| | Fig. 7 Schematic energy level diagram of Er3+–Yb3+ co-doped GCs, showing the two-step ET mechanism for the NIR emission under 460 nm excitation. | |
Conclusions
In summary, the Er3+/Yb3+ co-doped GCs containing CaF2 nanocrystals were obtained, and efficient NIR DC took place via a two-step ET process, which was verified experimentally. The maximal ETE and QY values were estimated to be as high as 75.3% and 150.6%, respectively. According to the ET process, one visible photon can be converted into two NIR photons, which can be efficiently absorbed by c-Si solar cells. Furthermore, GCs are advantageous owing to their higher thermal stability, transparency and low photon energy, which can adequately utilize the solar spectrum and increase the ETE of the Er3+–Yb3+ couple. Therefore, the Er3+–Yb3+ co-doped GCs have potential applications as a DC layer to improve the conversion efficiency of c-Si solar cells.
Acknowledgements
This study was supported by National Hi-Tech Research and Development Program (863) Key Project of China (No. 2012AA050301-SQ2011 GX01D01292) and Xi'an Industrial Technology Innovation Project-technology transfer promoting program (No. CX1242, CXY1123-5, CX12182-2, CX12182-3, CXY1421, CXY1511(9)).
Notes and references
- M. Ye and X. Wang, Chin. Opt. Lett., 2014, 12, 053501 CrossRef.
- J. Fan, B. Jia and M. Gu, Photonics Res., 2014, 2, 111–120 CrossRef.
- C. Strümpel, M. McCann, G. Beaucarne, V. Arkhipov, A. Slaoui, V. Švrček, C. del Cañizo and I. Tobias, Sol. Energy Mater. Sol. Cells, 2007, 91, 238–249 CrossRef.
- T. Trupke, M. A. Green and P. Würfel, J. Appl. Phys., 2002, 92, 1668–1674 CrossRef CAS.
- B. S. Richards, Sol. Energy Mater. Sol. Cells, 2006, 90, 1189–1207 CrossRef CAS.
- B. S. Richards, Sol. Energy Mater. Sol. Cells, 2006, 90, 2329–2337 CrossRef CAS.
- S. Ye, B. Zhu, J. Chen, J. Luo and J. Qiu, Appl. Phys. Lett., 2008, 92, 141112 CrossRef.
- Q. Y. Zhang, G. F. Yang and Z. H. Jiang, Appl. Phys. Lett., 2007, 91, 051903 CrossRef.
- X. Liu, S. Ye, Y. Qiao, G. Dong, B. Zhu, D. Chen, G. Lakshminarayana and J. Qiu, Appl. Phys. B, 2009, 96, 51–55 CrossRef CAS.
- G. Lakshminarayana and J. Qiu, J. Alloys Compd., 2009, 481, 582–589 CrossRef CAS.
- Y. Xu, X. Zhang, S. Dai, B. Fan, H. Ma, J. I. Adam, J. Ren and G. Chen, J. Phys. Chem. C, 2011, 115, 13056–13062 CAS.
- L. Xie, Y. Wang and H. Zhang, Appl. Phys. Lett., 2009, 94, 061905 CrossRef.
- S. Ye, B. Zhu, J. Luo, J. Chen, G. Lakshminarayana and J. Qiu, Opt. Express, 2008, 16, 8989–8994 CrossRef CAS PubMed.
- X. Liu, Y. Teng, Y. Zhuang, J. Xie, Y. Qiao, G. Dong, D. Chen and J. Qiu, Opt. Lett., 2009, 34, 3565–3567 CrossRef CAS PubMed.
- H. Lin, S. Zhou, H. Teng, Y. Li and W. Li, J. Appl. Phys., 2010, 107, 043107 CrossRef.
- Y. Tai, G. Zheng, H. Wang and J. Bai, J. Solid State Chem., 2015, 226, 250–254 CrossRef CAS.
- K. Biswas, S. Balaji, D. Ghosh, A. D. Sontakke and K. Annapurna, J. Alloys Compd., 2014, 608, 266–271 CrossRef CAS.
- Q. Y. Zhang, C. H. Yang, Z. H. Jiang and X. H. Ji, Appl. Phys. Lett., 2007, 90, 061914 CrossRef.
- D. Q. Chen, Y. L. Yu, Y. S. Wang and P. Huang, J. Phys. Chem. C, 2009, 113, 6406–6410 CAS.
- D. Chen, Y. Yu, H. Lin, P. Huang, Z. Shan and Y. Wang, Opt. Lett., 2010, 35, 220–222 CrossRef CAS PubMed.
- B. M. van der Ende, L. Aarts and A. Meijerink, Adv. Mater., 2009, 21, 3073–3077 CrossRef CAS.
- J. J. Eilers, D. Biner, J. T. van Wijngaarden, K. Krämer, H.-U. Güdel and A. Meijerink, Appl. Phys. Lett., 2010, 96, 151106 CrossRef.
- L. Aarts, B. M. van der Ende and A. Meijerink, J. Appl. Phys., 2009, 106, 023522 CrossRef.
- S. R. Lüthi, H. U. Güdel and M. P. Hehlen, J. Chem. Phys., 1999, 110, 12033–12043 CrossRef.
- L. H. Huang, T. Yamashita, R. Jose, Y. Arai, T. Suzuki and Y. Ohishi, Appl. Phys. Lett., 2007, 90, 131116 CrossRef.
- L. H. Huang, G. S. Qin, Y. Arai, R. Jose, T. Suzuki, Y. Ohishi, T. Yamashita and Y. Akimoto, J. Appl. Phys., 2007, 102, 093506 CrossRef.
- D. Q. Chen, Y. S. Wang, Y. L. Yu, F. Liu and P. Huang, Opt. Lett., 2007, 32, 3068–3070 CrossRef CAS PubMed.
- J. Zhou, Y. Zhuang, S. Ye, Y. Teng and G. Lin, Appl. Phys. Lett., 2009, 95, 141101 CrossRef.
Footnote |
| † Electronic supplementary information (ESI) available. See DOI: 10.1039/c5ra25800f |
|
| This journal is © The Royal Society of Chemistry 2016 |
Click here to see how this site uses Cookies. View our privacy policy here.