
Optical, dielectric & ferroelectric studies on amino acids doped TGS single crystals
P. R. Deepthi*a and
J. Shanthib
aDepartment of Physics, School of Engineering, Presidency University, Bengaluru, Karnataka, India-560 089. E-mail: deeptiprasad82@gmail.com
bDepartment of Physics, Avinashilingam University for Women, Coimbatore, Tamilnadu, India-641 038
First published on 29th March 2016
Abstract
Pure TGS and amino acids (L-arginine, L-histidine and L-alanine) doped TGS crystals were grown by slow evaporation solution growth technique at room temperature. The optical transmission window and optical band gap of the crystals were found by UV-Vis studies. The cut off wavelengths of the grown crystals were observed between 220 nm and 290 nm. The dielectric behaviour was investigated at different frequencies and temperatures. AC conductivity was determined. Photoconductivity study reveals that the grown crystals exhibit negative photoconductivity. The ferroelectric nature of the crystals was identified by P–E hysteresis loop analysis. The piezoelectric d33 coefficient has been measured for the doped TGS crystals. Two close emission bands in the luminescence spectra in the near UV region reveal their application in developing new coherent sources of radiation in this region. Among the three dopants, L-arginine doped TGS possesses low dielectric constant and high piezo electric coefficient, suggesting that this can be a potential material for infrared detectors.
Introduction
Triglycinesulphate (TGS) is one of the extensively studied ferroelectric materials, which has a wide range of applications, due to its low cost, low power requirement and wide operating range of temperature and frequency, in room temperature infrared (IR) detectors, pyroelectric vidicon tubes, transducers and sensors.1,2 TGS shows a second order phase transition at the Curie point Tc = 49 °C. In ferroelectric phase below the Curie point the symmetry is monoclinic with space group P21. Above Tc, the structure gains an additional set of mirror planes in the space group P21/m.3 According to the structural analysis of ferroelectric triglycinesulphate, there are two kinds of glycine group, glycinium ions and zwitter ions. Such configuration of glycine ions interconnected by short O–H⋯O hydrogen bonds are regarded as particularly important for the ferroelectric behavior of this crystal.4 A disadvantage of these crystals is the tendency of their polarization to spontaneous reversal. Therefore, studies dealing with the influence of doping TGS crystals on their physical properties are of particular interest.In recent years, the interest in studying pure and doped TGS crystals has increased because of their application in various devices. Crystals of pure TGS with different additives have been used for the construction of the most sensitive detectors, because of their high value of figure of merit.5 However, TGS crystals are found to depolarize by thermal, electrical or mechanical means.6 An efficient way to stabilize the single domain state is practiced by doping an optically active molecule into TGS. The partial substitution of an optically active molecule in the place of glycine molecule causes an internal bias field, resulting in a permanent polarization.7 Many efforts have been made to improve the optical, ferroelectric, pyroelectric and other properties of the TGS family crystals by doping with various amino acids.8–12
In the present paper, the effect of L-amino acids on the growth of TGS by slow evaporation method at room temperature has been studied. The grown crystals were characterized by UV-Vis, ferroelectric analysis, photoconductivity, dielectric and photoluminescence. A comparative study on the results obtained for pure TGS, L-arginine, L-histidine and L-alanine doped TGS crystals (pure TGS, L-Ar TGS, L-H TGS and L-Al TGS) are detailed below.
Materials and methods
Synthesis and crystal growth
Analar grade reagents glycine and concentrated sulphuric acid (H2SO4) were dissolved in deionized water in the molar ratio of 3![[thin space (1/6-em)]](https://www.rsc.org/images/entities/char_2009.gif) :1, and the solution was heated at 50 °C to obtain synthesized TGS salt. Glycine reacts with sulphuric acid as follows.
:1, and the solution was heated at 50 °C to obtain synthesized TGS salt. Glycine reacts with sulphuric acid as follows.| 3(NH2CH2COOH) + H2SO4 → (NH2CH2COOH)3·H2SO4 |
The synthesized salt was again dissolved in double distilled water and then recrystallized by natural evaporation process. This process was repeated two times to improve the purity of the material. Well defined and transparent crystals of dimension up to 9 × 11 × 5 mm3 were formed within 15 days.
In the case of amino acids doped TGS crystals, the saturated solution of TGS was first prepared. To this solution, appropriate mole of L-arginine, L-histidine and L-alanine was added as dopant. The seed crystals were obtained over a period of five days and suspended in the parent solution to get good quality crystals. Transparent crystals of L-arginine doped TGS crystals of dimension 15 × 14 × 8 mm3 and L-alanine doped TGS crystals of dimension 9 × 10 × 8 mm3 were obtained over a period of three weeks whereas on doping with L-histidine full faced crystals of dimension 9 × 11 × 6 mm3 were obtained within two weeks. The photographs of the grown pure and doped TGS crystals are shown in Fig. 1.
 | ||
| Fig. 1 The photograph of the grown crystals of (a) pure TGS (b) L-Ar TGS (c) L-H TGS and (d) L-Al TGS. | ||
Results and discussion
UV-Visible analysis
The optical properties of materials provide information on the electronic band structures, localized states and types of optical transitions. The desired lower cut off in the transmittance analysis is to be between 200 and 400 nm for effective optical applications: lower the value of cut off wider is the optical window.13 UV-Visible studies also give important structural information because the absorption of UV and visible light involves promotion of the electrons in p and s orbital from the ground state to high energy states. To determine the optical transmittance range and hence to know the suitability of pure and amino acids doped TGS single crystals for optical applications, the UV-Vis transmittance spectra were recorded using SHIMADZU UV-Spectrometer 1601 in the range of 200 to 1000 nm and is as shown in Fig. 2. | ||
| Fig. 2 UV-Visible transmission spectra of pure and doped TGS crystals. | ||
The lower cut off region for pure TGS is obtained at 224 nm and band gap is found to be 5.54 eV, which is in good agreement with the reported values.14 Almost there is a steady transmittance in the visible region. From the UV-Visible spectrum, it is found that the pure triglycine sulphate crystal is conveniently transparent from 380 to 1000 nm with around 80% of transmittance for pure TGS.
The cut off wavelength is 289 nm and band gap is found to be 4.29 eV for L-Ar TGS crystal. From the UV-Visible spectrum, it is found that the L-Ar TGS crystal is transparent in the visible region with around 90% of transmittance. The cut off wavelength is 262 nm and band gap is found to be 4.74 eV for L-H TGS crystal. It is found that L-H TGS crystal is conveniently transparent from 380 to 900 nm with around 80% of transmittance. The cut off wavelength is 271 nm and band gap is found to be 4.58 eV for L-Al TGS crystal. It is found that the L-Al TGS crystal is transparent in the visible region with about 85% of transmittance.
The optical absorption coefficient (α) was calculated from transmittance using the relation  , where ‘T’ is the transmittance, and ‘d’ is the thickness of the crystal. Owing to the direct band gap, the crystal under study has an absorption coefficient (α) obeying the relation for high photon energies (ν),
  where Eg is the optical band gap of the crystal and A is a constant. The variation of (αhν)2 vs. (hν) is plotted and is shown in Fig. 3. From the plot Eg is evaluated by the extrapolation of the linear part. The measured band gap is found to be 5.51 eV for pure TGS, 4.31 eV for L-Ar TGS, 4.74 eV for L-H TGS and 4.69 eV for L-Al TGS.
 | ||
| Fig. 3 (αhν)2 vs. hν spectra of pure and doped TGS crystals. | ||
Ferroelectric measurements
The properties of ferroelectrics are governed by their crystallographic structure15–17 and strongly influenced by the lattice defects, presence of which in crystals leads to appearing and existence of internal bias field.18 Ferroelectricity of the material is ascertained by P–E hysteresis loop. The polarization and electric field (P–E) curve was traced in L-Ar TGS, L-H TGS and L-Al TGS crystals using a standard computer controlled Sawyer–Tower P–E hysteresis analyser. A good quality crystal of size 10 mm × 10 mm × 1 mm was used for the study. The opposite faces were electroded with conducting silver paste.Observed hysteresis loops in present investigation are in elliptical shape which shows the ferroelectric nature of the materials. Area of the hysteresis curve increases along with the remnant polarization and coercive field with increase of applied electric field. The squareness of hysteresis loop was determined. For an ideal hysteresis loop the squareness parameter (Rsq) is equal to 2. The value of squareness close to 2 in the case of grown doped TGS crystals indicates a very good switching behaviour of the crystal. The ferroelectric parameters were calculated and presented in Table 1.
| Crystal | PS (μC cm−2) | Pr (μC cm−2) | Ec (kV cm−1) | Rsq | Area enclosed |
|---|---|---|---|---|---|
| L-Ar TGS | 0.94 | 0.46 | 12.46 | 2.16 | 49.57 |
| L-H TGS | 0.71 | 0.50 | 15.53 | 2.14 | 46.20 |
| L-Al TGS | 2.26 | 1.73 | 16.92 | 1.93 | 137.01 |
The coercive field (Ec) value will be large in the case of specimens having a single domain compared to the multi domain specimen.19 The coercive field (Ec) value and spontaneous polarization (PS) for pure TGS have been reported in literature.20,21 The reported coercive field value for pure TGS is 2.58 kV cm−1 and the spontaneous polarization is 3.4 μC cm−2. The coercive field (Ec) value of the L-arginine, L-histidine and L-alanine crystals is more than the pure one, implying that the crystals are in the single-domain state. A similar effect was observed in literature when L-cysteine was used as the dopant.8 Polarization reversal in TGS occurs very easily (low Ec) if many domains are present, but with great difficulty (large Ec) in single-domain crystals. The mono domain state of the specimen is the one in which the dipolar moments are unswitchable. Owing to the high dipole moment of the substituted amino acid, a bias field is created, which results in the shift of the entire loop.
Piezoelectric (d33) measurements
The piezoelectric applications, such as ultrasonic transducers and piezoelectric actuators demand high electromechanical coupling coefficients and relatively large dielectric constants in addition to a large piezoelectric d33 coefficient. The piezoelectric property is related to the polarity of the material.22 Piezoelectric behaviour of the pure and doped TGS crystals was confirmed by determining the piezoelectric coefficient (d33) using PM-300 piezometer system. A piezoelectric substance is one that produces an electric charge when a mechanical stress is applied and the piezoelectric property is related to the polarity of the crystalline material. A precision force generator applied a calibrated force (0.25 N) that generated a charge on the piezoelectric material under test. The output was measured directly from oscilloscope, which gives the d33 coefficient in units of pC N−1. The reported d33 coefficient value for pure TGS is 10.22 pC N−1.20 The obtained d33 coefficient value for doped TGS crystals is given in Table 2.| Crystal | d33 (pC N−1) |
|---|---|
| Pure TGS | 10.22 |
| L-Ar TGS | 5 |
| L-H TGS | 2 |
| L-Al TGS | 2 |
The obtained low value of d33 coefficient (2 pC N−1) in L-H TGS and L-Al TGS crystals could be due to the higher density of dislocations present in both crystals when compared with L-Ar TGS crystal whose d33 coefficient is 5 pC N−1. It has been already reported that the piezoelectric properties are largely affected by the dislocations.23 Any defects irrespective of their origin may cause slowing down of the domain wall mobility and tends to reduce the d33 coefficient.24
Photoconductivity measurement
Photoconductivity measurements were carried out on a cut and well-polished sample of the grown single crystal by fixing it onto a microscope slide. Two electrodes of thin copper wire of 0.3 mm thickness were fixed using silver paint and the sample was connected in series with a dc power supply and KEITHLEY 485 pico ammeter. The dark current was recorded by keeping the sample unexposed to any radiation. The sample was covered with a black cloth and the voltage applied was increased from 0 to 300 volts in steps of 20 volts and the dark current was recorded. The sample was illuminated by the radiation from 100 W halogen lamp containing iodine vapour and tungsten filament. The photocurrent was recorded for the same values of the applied voltage. Field dependence of dark and photo currents is depicted in Fig. 4 for pure TGS, L-Ar TGS, L-H TGS and L-Al TGS crystals. It is observed that the dark current (Id) and the photocurrent (Ip) show linear response for all the crystals with respect to applied field.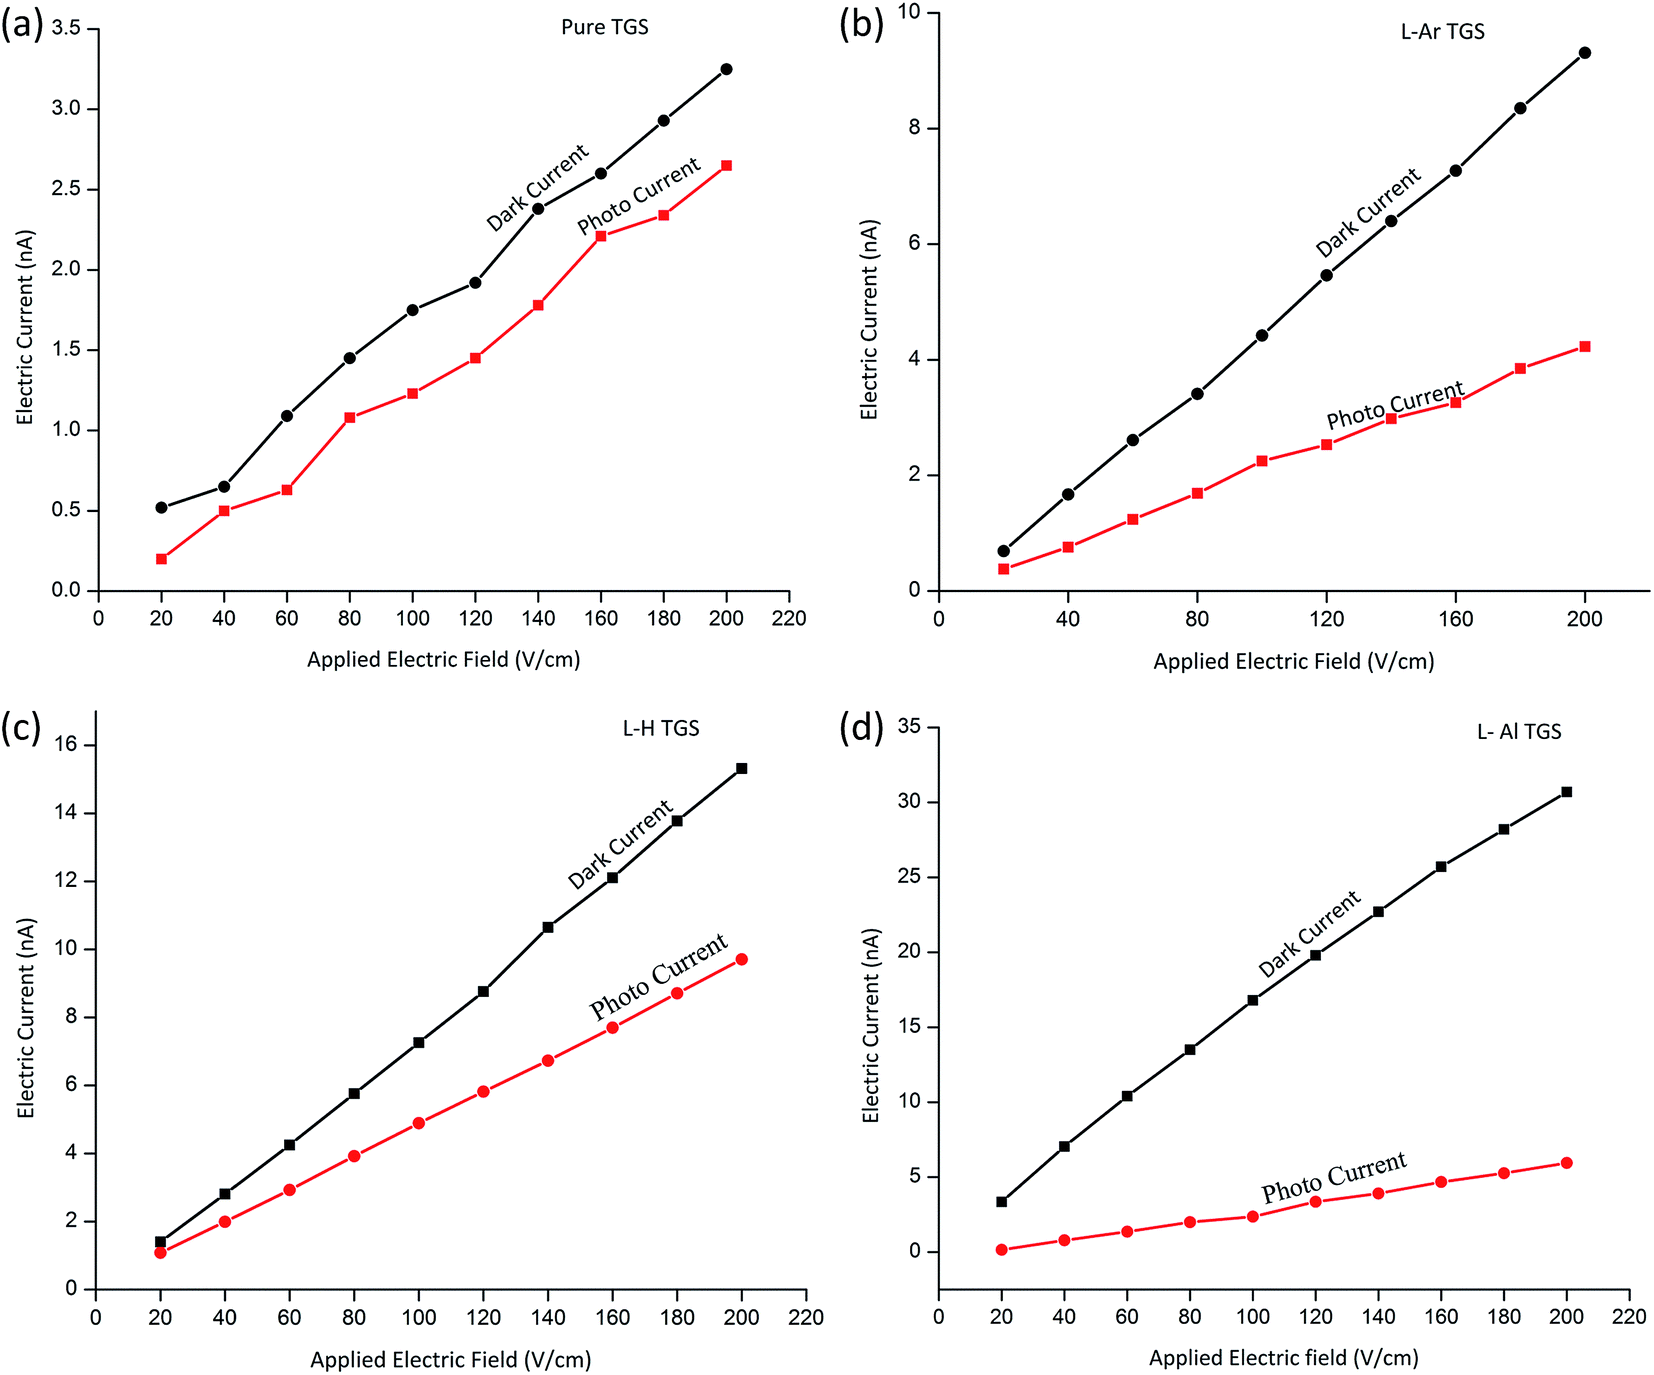 | ||
| Fig. 4 Field dependence of dark and photo currents for (a) pure TGS (b) L-Ar TGS (c) L-H TGS and (d) L-Al TGS. | ||
It is seen from the plots that both dark current and photo current of the samples increase linearly with applied field. The dark current is always higher than the photo current, thus confirming negative photoconductivity. The phenomenon of negative photoconductivity is explained by Stockmann model.25 The negative photoconductivity in a solid is due to the decrease in the number of charge carriers or their lifetime, in the presence of radiation.26
Table 3 gives a comparison of cross analysis of percentage of depression at two different applied field namely 60 V cm−1 and 100 V cm−1. The depression is maximum in L-alanine doped TGS and minimum in L-histidine doped TGS. A probable mechanism is sought through the literature and found from reported works on L-arginine27 and L-amino acids28 that there is a probable correlation of this photoconductive action to the dopants. The carbon length and the planarity of the molecules appear to have relevance with the percentage of depression. In L-arginine the guanidyl group falls in plane with carbon back bone though there is angular variation till the C4 position (Fig. 5 and 6) which provides the possibility of the electron transfer when photo electrons are generated (the L-histidine does not have such coplanar carbon back bone to transfer the photo electrons in the system).
| Sample | Photoconductivity analysis | Slope calculation based on hysteresis curve | |
|---|---|---|---|
| Depression at 60 V cm−1 | Depression at 100 V cm−1 | ||
| L-Ar TGS | 52% | 49% | 140 × 10−6 |
| L-H TGS | 34% | 37% | 37.75 × 10⁻⁶ |
| L-Al TGS | 87% | 86% | 127.5 × 10⁻⁶ |
 | ||
| Fig. 5 Bond lengths for L-arginine molecule. | ||
 | ||
| Fig. 6 Bond angles for L-arginine molecule. | ||
In contrary L-alanine28 possess a short chain thus providing possibility of interlock to a greater extent packing it stronger. The shorter chain brings the molecules more packed and forms a bond parallel to itself forming an interlocking layer. Hence the photoelectron does not have possibility of draining and leads to severe polarization. Hence it is very obvious that lighter the polarization more would be the depression in photocurrent (Table 3).
Dielectric studies
The measurement of dielectric constant as a function of frequency and temperature is of considerable interest. The dielectric measurements were carried out using an LCR meter. The dielectric constants were determined at different frequencies viz., 50 Hz to 50 MHz at room temperature. Crystals with high transparency and defect free were used for study. The extended portions of the crystals were removed completely and the opposite faces were polished and coated with graphite to get a good conductive surface layer. The dimensions of the crystals were measured using a travelling microscope. The readings were taken when the sample was cooled. The air capacitance was also measured.The variation of dielectric constant and dielectric loss with frequency for pure and doped TGS crystals is shown in Fig. 7(a) and (b) respectively. It is seen that the value of dielectric constant and dielectric loss decrease exponentially with frequency and increase with temperature. This is a normal behaviour of polar (non-centro symmetric) dielectric and it obeys Debye equation. The behaviour is due to the fact that at low frequency, dipoles follow the applied field whereas at high frequency they do not. The dielectric constant of the materials is due to the contribution of electronic, ionic, dipolar, space charge polarizations, which depend on frequencies. At low frequencies, space charge polarization is more predominant and hence the dielectric constant increases abnormally. As frequency increases to a point where space charge cannot sustain and comply with the external field and hence polarization decreases, it gives rise to diminishing values of dielectric constant. A similar effect was observed in literature28 when TGS crystals were doped with amino acids. However, the values obtained are still lower in comparison to those for other TGS-doped crystals.29,30 The low value of dielectric constant at high frequencies are important for the materials in the construction of photonic and NLO devices.
 | ||
| Fig. 7 (a) Dielectric constant versus logf for pure and doped TGS crystals and (b) dielectric loss versus logf for pure and doped TGS crystals. | ||
Usually the dielectric losses fall into two categories, intrinsic and extrinsic. Intrinsic losses are dependent on the crystal structure and can be described by the interaction of the phonon system with the varying electric field. The applied electric field alters the equilibrium of the phonon system and the subsequent relaxation is associated with energy dissipation. These intrinsic losses set the lower limit of losses found in pure “defect free” single crystals. Extrinsic losses are associated with imperfections in the crystal such as impurities, micro structural defects, porosity, micro cracks and random crystallite orientation. The decrease in dielectric loss with increasing frequency accounts for good chemical homogeneity of the grown crystal with lesser defects and this parameter is important for the fabrication of materials for photonic and electro optic devices. An essential property of NLO material is its ability to support an electrostatic field while dissipating minimal energy in the form of heat. The lower is the dielectric loss (the proportion of energy lost as heat), the more effective is a dielectric material.31
AC conductivity
The AC conductivity was calculated using the formula.| σac = 2πfε0εrtanδ |
 | ||
| Fig. 8 AC conductivity versus logf for (a) pure TGS, (b) L-Ar TGS, (c) L-H TGS and (d) L-Al TGS. | ||
AC conductivity values are fitted in equation
 σac gives a straight line (Fig. 9), and the slope of the straight line is equal to (Ea/k), from which the activation energy (Ea = −slope × k × 1000) is calculated to be 0.34 eV for pure TGS, 0.213 eV for L-H TGS, 0.204 eV for L-Ar TGS and 0.65 eV for L-Al TGS. The activation energy is the energy required for the charge carriers to take part in the conduction process. As the value of Ea is less than 0.5 eV, it is concluded that the material possesses ionic conductivity.33
 | ||
| Fig. 9 Plot of 1000/T versus lnσac. | ||
Photoluminescence studies
The photoluminescence spectrum of pure and amino acids doped TGS crystals were recorded at 310 K and 340 K and the spectrum is shown in Fig. 10(a) and (b) respectively. All crystals were excited at 240 nm. A sharp emission band was clearly observed near 361 nm for pure TGS crystal with a small peak at 389 nm. A similar effect was observed very recently upon doping TGS crystals with crystal violet and amaranth dye.2,34 These two close emission bands appearing in the near UV region in TGS crystal is strongly related to the electronic structure of the material and is termed as hyper-luminescence.35,36 The observed luminescence spectrum can be interpreted as a manifestation of electron–hole recombination and de-excitation of exciton terms, accompanied by transitions to vibrational sub levels of the ground state of the crystal. This type of luminescence in TGS crystal is termed as hyper-luminescence in which two closely placed equal intensity peaks are observed and the relative intensity of these peaks is changed by the excitation wavelength as discussed by Gorelik et al.36 | ||
| Fig. 10 The photoluminescence spectrum of pure and amino acids doped TGS crystals at (a) 310 K and (b) 340 K. | ||
Conclusions
Crystals of pure TGS, L-arginine, L-histidine and L-alanine doped TGS have been grown by slow solvent evaporation technique at room temperature. The crystals were found to show good transparency in the UV-Visible region with increased band gap and enhanced optical constants making them useful for photonic device applications. P–E hysteresis loop measurements reveals that the grown crystals are ferroelectric in nature. The coercive field value of the doped crystals is more than the pure one, implying that the crystals are in the single-domain state. It is seen that the value of dielectric constant and dielectric loss decreases exponentially with frequency. Further, low dielectric loss of the crystals at high frequency range, is an ideal condition for NLO materials. In summary, a decrease in the dielectric constant, low dielectric loss, increased uniform figure of merit and coercive field suggests that amino acids doped TGS crystals are potential material for IR sensors. Photoconduction studies reveal that the grown crystals have negative photoconductivity. Two close emission bands in the luminescence spectra in near UV region reveal their application in developing new coherent sources of radiation in this region.Acknowledgements
The authors thank Dr Binay Kumar, Crystal Growth Centre, Delhi University for Ferroelectric studies and also place on record the support given by SAIF, Kochi, where the analyses were done.References
- H. V. Alexandru, C. Berbecaru, L. Ion, A. Dutu, F. Ion, L. Pintilie and R. C. Radulescu, Appl. Surf. Sci., 2006, 253, 358 CrossRef CAS
.
- N. Sinha, N. Goel, B. K. Singh, M. K. Gupta and B. Kumar, J. Solid State Chem., 2012, 190, 180 CrossRef CAS
- N. Kartheeswari and K. Viswanathan, J. Spectrosc., 2013, 2013, 1 CrossRef
- V. Lhotska, J. Fousek and N. Neumann, Phys. Status Solidi A, 1990, 120, 273 CrossRef CAS
- R. Muralidharan, R. Mohankumar, R. Dhanasekaran, A. K. Tirupathi, R. Jayavel and P. Ramasamy, Mater. Lett., 2003, 57, 3291 CrossRef CAS
- N. Nakatani, Jpn. J. Appl. Phys., 1973, 12, 1723–1728 CrossRef CAS
- J. Stankowska, A. Czarrecka and B. D. Gemi, Acta Phys. Pol., 1993, 83, 485 CrossRef CAS
- K. Meera, R. Muralidharan, P. Santhanaraghavan, R. Gopalakrishnan and P. Ramasamy, J. Cryst. Growth, 2001, 226, 303 CrossRef CAS
- R. M. Kumar, R. Muralidharan, D. R. Babu, K. V. Rajendran, R. Jayavel, D. Jayaraman and P. Ramasamy, J. Cryst. Growth, 2001, 229, 568 CrossRef
- R. Malekfar and A. Daraei, Acta Phys. Pol., A, 2008, 114, 859 CrossRef CAS
- J. Novotny, L. Prokopova and Z. Micka, J. Cryst. Growth, 2001, 226, 333 CrossRef CAS
- A. P. Levanyuk, V. V. Osipov, A. S. Sigov and A. A. Sobyanin, J. Exp. Theor. Phys., 1979, 76, 345 Search PubMed
- K. Balasubramanian and P. Selvarajan, Recent Res. Sci. Technol., 2010, 2, 6 CAS
- X. Zhao, C. Sun, Y. Si, M. Liu and D. Xue, Mod. Phys. Lett. B, 2009, 23, 3809 CrossRef CAS
- D. Xue and K. Kitamura, Ferroelectrics, 2003, 297, 19 CrossRef CAS
- X. Zhang and D. Xue, J. Phys. Chem. B, 2007, 111, 2587 CrossRef CAS PubMed
- O. V. Rogazinskaya, S. D. Milovidova, A. S. Sidorkin, A. B. Plaksizkii, A. A. Sidorkin and T. V. Vorobzhanskaya, Ferroelectrics, 2004, 307, 255 CrossRef CAS
- J. Stankowska, Ferroelectrics, 1978, 22, 753 CrossRef CAS
- M. Senthil Pandian, P. Ramasamy and B. Kumar, Mater. Res. Bull., 2012, 47, 1587 CrossRef CAS
- T. Bharthasarathi, V. Siva Shankar, R. Jayavel and P. Murugakoothan, J. Cryst. Growth, 2009, 311, 1147 CrossRef CAS
- W. Ge, H. Liu, X. Zhao, X. Pan, T. He, D. Lin, H. Xu and H. Luo, J. Alloys Compd., 2008, 456, 503 CrossRef CAS
- X. Guisheng, L. Haosu, W. Pingchu, X. Haiqing and Y. Zhiwen, Chin. Sci. Bull., 2000, 45, 491 CrossRef
- A. Saxena, V. Gupta and K. Sreenivas, J. Cryst. Growth, 2004, 263, 192 CrossRef CAS
- V. N. Joshi, Photoconductivity, Marcel Dekker, New York, 1990 Search PubMed
- R. H. Bube, Photoconductivity of solids, Wiley, New York, 1981 Search PubMed
- I. L. Karle and J. Karle, Acta Crystallogr., 1964, 17, 835 CrossRef CAS
- P. R. Tulip and S. J. Clark, Phys. Rev. B: Condens. Matter Mater. Phys., 2005, 71, 195117 CrossRef
- J. Mary Linet, S. Mary Navis Priya, S. Dinakaran and S. Jerome Das, Cryst. Res. Technol., 2008, 43, 806 CrossRef
- R. Parimaladevi, C. Sekar and V. Krishnakumar, Spectrochim. Acta, Part A, 2010, 75, 617 CrossRef CAS PubMed
- P. K. Bajpai, D. Shah and R. Kumar, Nucl. Instrum. Methods Phys. Res., Sect. B, 2012, 270, 93 CrossRef CAS
- Z. Sun, T. Chen, N.-N. Cai, J.-W. Chen, L. Li, Y. Wang, J. Luo and M. Hong, New J. Chem., 2011, 35, 2804 RSC
- B. D. Hatton, K. Landskron, W. J. Hunks, M. R. Bennett, D. Shukaris, D. D. Pervoic and G. A. Ozin, Mater. Today, 2006, 9, 22 CrossRef CAS
- A. Cyrac Peter, M. Vimalan, P. Sagayaraj and J. Madhavan, Phys. Rev. B: Condens. Matter Mater. Phys., 2010, 405, 65 CrossRef CAS
- N. Sinha, S. Bhandari, H. Yadav, G. Ray, S. Godara, N. Tyagi, J. Dalal, S. Kumar and B. Kumar, CrystEngComm, 2015, 17, 5757 RSC
- V. S. Gorelik and E. V. Zhabotinskii, J. Russ. Laser Res., 1995, 16, 287 CrossRef
- V. S. Gorelik and E. V. Zhabotinskii, Quantum Electron., 1993, 23, 1053–1054 CrossRef
| This journal is © The Royal Society of Chemistry 2016 |