Catalytic oxidation of aromatic amines to azoxy compounds over a Cu–CeO2 catalyst using H2O2 as an oxidant†
Astha Shuklaa,
Rajib Kumar Singhaa,
L. N. Sivakumar Konathalaa,
Takehiko Sasaki b and
Rajaram Bal*a
aRefining Technology Division CSIR-Indian Institute of Petroleum, Dehradun 248005, India. E-mail: raja@iip.res.in; Fax: +91-135-26660202; Tel: +91-135-2525917
bDepartment of Complexity Science and Engineering, Graduate School of Frontier Sciences, The University of Tokyo, Kashiwanoha Kashiwa-Shi, Chiba, 277-8561, Japan
First published on 22nd February 2016
Abstract
We have prepared Cu-nanoparticles supported on nanocrystalline CeO2 by a one pot hydrothermal method using cetyltrimethylammonium bromide (CTAB) surfactant. The prepared catalyst was characterised by XRD, SEM, TEM, XPS, TPR, EXAFS, BET-surface area and UV-Vis spectroscopy. This prepared catalyst was highly active for the selective oxidation of aromatic amines to corresponding N-oxides with very high yield. It was observed that 5–10 nm Cu-nanoparticles supported on 20–40 nm CeO2 nanoparticles was formed when Cu loading was 3.8 wt%. 3.8 wt% Cu was the optimum loading to give maximum catalytic activity and above 3.8 wt% Cu loading due to the formation of agglomerated Cu species, catalytic activity decreases. The 3.8% Cu–CeO2 catalyst showed 95% aniline conversion and 92% selectivity towards azoxybenzene formation using H2O2 as an oxidising agent. The effect of different reaction parameters like temperature, reaction time, substrates and H2O2 mole ratio were investigated in detail.
Introduction
In the emerging field of nanocatalysis, the development of an efficient heterogeneous catalytic system with a tuned structural geometry, unique physical chemical properties, and improved catalytic activity is greatly need for sustainable development.1 Nanometer-sized metal particles are better potential candidates than their bulk counterparts due to their high surface to volume ratio, and easily accessible active site for the chemical transformations.2 The interaction of active metal with the support plays a remarkable role on the physicochemical properties of a catalyst as well as their performances.3 Beside this, it is also necessary to overcome the environmental issues by replacing organic pollutants into corresponding value added products. From the last decades, CeO2 is becoming more attractive in the field of medicine, electronic, and chemistry due to its remarkable properties.4 CeO2 is found to be most significant rare earth metal oxides with the wide range applications in solid oxide fuel cells, solar cells and oxygen membranes etc. and it is often used as excellent support in preferential oxidation (PROX), water gas-shift (WGS) and H2O2 synthesis reactions, oxidations reaction, due to its high oxygen (ion conductivity) storage and releasing capacity i.e. redox properties.5 Various synthetic procedure have been reported in the literature for the preparation of CeO2 nanoparticles such as solvothermal synthesis,6 electrode deposition,7 hydrothermal,8 sol–gel9 and precipitation method10 etc. There are also reports in the literature that the CeO2 with different morphology can be prepared with different shape and size ranging from nanowires, nanocubes to nanorods.11 Extensive efforts have been made in preparing the copper supported on cerium oxide catalysts with different morphologies for their superior catalytic activities. Cu–CeO2 catalysts can be prepared by different preparation methods like co-precipitation, the citrate-hydrothermal, the urea-nitrates combustion and the impregnation methods12 but the controlled synthesis of nanoparticles by a single preparation method in a large scale still remains a challenge for the researchers. Our group has developed a new synthesis strategy for the preparation of supported nanoparticles in a single hydrothermal preparation method.13 We reported here the preparation of copper nanoparticles supported on CeO2 nanoparticles by one pot preparation method.Selective oxidation of aromatic amines are one of the challenging reaction for converting amines into valuable intermediates in the field of pharmaceutical industries ranging from dyes, reducing agents, polymer stabiliser, and food additives and also used as liquid crystals in electronic display and therapeutic medicine.14 Azoxy compounds are the N-oxides of azo compounds which are formed by the dehydration of N-phenylhydroxyl amine and nitrosobenzene during catalytic oxidation of aromatic amines. It is also used as the starting material for the Wallach transformation that has been applicable in coloration of dye, resin and lacquer.15 From the literature survey, aromatic amines was oxidised by peracetic acid,16 MnO2,17 Pd(OAc)2,18 and Hg(OAc)2![[thin space (1/6-em)]](https://www.rsc.org/images/entities/char_2009.gif) 19 respectively. The selectivity of products obtained during oxidation of aniline depends on catalytic system, quaternary ammonium salts, type of oxidant used as well as reaction conditions.20 There are several reports where nitrosobenzene was obtained as a major product using Pt/P25 (TiO2),21 titanium silicate molecular sieves (TS-I),22 CH3ReO3,23 and heteropolyoxometalates.24 Corma et al. reported the aerobic oxidation of aniline to azobenzene over Au–TiO2.25 Furthermore, Zhang et al. reported mesoporous TiO2 catalysed oxidation of aniline to azoxybenzene using H2O2 as an oxidant.26 Dupont et al. reported oxidative coupling of aniline to azoxybenzene over P25 (comm. TiO2) in presence of ionic liquid by using molecular oxygen at 100 °C.27 Among the various oxidising agents hydrogen peroxide and molecular oxygen have their own importance and regarded as a greener oxidising agents as they do not produce any waste. Although molecular oxygen have greater (50%) oxygen content than H2O2, but it requires harsh condition to activate the molecular O2 at normal temperature and pressure by heterogeneous system. Therefore, from the safety and cost point of view, H2O2 can be preferred over molecular O2 as oxidising agent. Our group also reported the oxidation of aromatic amines to azoxy compounds over different nanostructured catalyst.28
19 respectively. The selectivity of products obtained during oxidation of aniline depends on catalytic system, quaternary ammonium salts, type of oxidant used as well as reaction conditions.20 There are several reports where nitrosobenzene was obtained as a major product using Pt/P25 (TiO2),21 titanium silicate molecular sieves (TS-I),22 CH3ReO3,23 and heteropolyoxometalates.24 Corma et al. reported the aerobic oxidation of aniline to azobenzene over Au–TiO2.25 Furthermore, Zhang et al. reported mesoporous TiO2 catalysed oxidation of aniline to azoxybenzene using H2O2 as an oxidant.26 Dupont et al. reported oxidative coupling of aniline to azoxybenzene over P25 (comm. TiO2) in presence of ionic liquid by using molecular oxygen at 100 °C.27 Among the various oxidising agents hydrogen peroxide and molecular oxygen have their own importance and regarded as a greener oxidising agents as they do not produce any waste. Although molecular oxygen have greater (50%) oxygen content than H2O2, but it requires harsh condition to activate the molecular O2 at normal temperature and pressure by heterogeneous system. Therefore, from the safety and cost point of view, H2O2 can be preferred over molecular O2 as oxidising agent. Our group also reported the oxidation of aromatic amines to azoxy compounds over different nanostructured catalyst.28
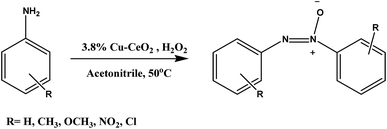
Herein, we reported the preparation of copper nanoparticles supported on cerium oxide nanoparticles and their application on the catalytic oxidation of aromatic amines to corresponding azoxy compounds with at 50 °C as shown in Scheme 1. Although ceria has a good oxygen storage capacity but in our case copper facilitate the selective oxidation of aromatic amines toward azoxybenzene which has been discussed in activity table.
Experimental section
Materials
Copper chloride (CuCl2), cerium chloride (CeCl3·7H2O), cetyltrimethylammonium bromide (CTAB), etc. were purchased from Sigma-Aldrich. Whereas ammonium hydroxide (NH4OH), ethanol, and H2O2 (50% aq. solution) were purchased from Merck KGaA, Darmstadt, Germany. Double distilled water was prepared with a BOROSIL® water distillation unit. Different aromatic amines were purchased from Sigma-Aldrich.Catalyst preparation
Cu–CeO2 catalyst was prepared by surfactant assisted hydrothermal method under autogenous pressure which was obtained by modifying our own preparation method.13 In a typical synthesis procedure, 1.8 g CTAB was dissolved with a mixture of 150 ml distilled water and 10 ml ethanol and 10.8 g CeCl3·7H2O was added with constant stirring. An alcoholic solution of 0.528 g CuCl2 was added drop wise to previously prepared solution and stirred for 3 h. The pH of solution was adjusted to 8 with the addition of 30% NH4OH solution. The whole solution was stirred for another 20 h at room temperature and 2 ml hydrazine monohydrate was added dropwise and stirred for 1 h. Finally, the solution was transferred into a Teflon lined stainless steel autoclave. The autoclave was maintained at 180 °C for 24 h in an oven and was allowed to cool at room temperature. The obtained material was filtered and washed with excess of H2O and ethanol and dried at 100 °C for 12 h. During filtration, the silver nitrate test was performed for complete removal of chloride ions in the samples and the further confirmation of chloride ions in the samples was estimated by means of ICP-AES analysis. Finally, the obtained powdered material was calcined at 550 °C for 6 h at a heating rate of 1 °C min−1 in presence of air to remove the organic moieties. The obtained greenish coloured powder material was denoted as (Cu wt%) Cu–CeO2. The catalyst prepared by impregnation method and co-precipitation methods were denoted as 4% Cu–CeOImp.2 and 4% Cu–CeOCo.ppt.2, the spent catalyst after four successive runs was denoted as 3.8% Cu–CeOr2.Result and discussion
The amount of Cu present in Cu–CeO2 catalysts were estimated by ICP-AES. The crystalline nature and exposed phase of prepared catalyst was determined by powder X-ray diffraction (XRD) analysis. XRD patterns of CuOcom. (commercial catalyst), CeOcom.2 (commercial catalyst), 4% Cu–CeOImp.2, 4% Cu–CeOCo.ppt.2, 3.8% Cu–CeO2, 7.5% Cu–CeO2, 3.8% Cu–CeOr2 are shown in Fig. 1. All the catalysts showed peaks at 2θ value of 28.51°, 33.10°, 47.51°, and 56.31°, corresponding to the (111), (200), (220), (311) planes attributed to those of CeO2 (JCPDS card no. 81-0792). It has to be noted that all the diffraction peaks of cerium oxide are assigned to the cubic phase with space group of Fm3m (225) and matches well with standard data given in the JCPDS card no. 81-0792 as shown in Fig. 1e. No crystalline phase of metallic Cu or any oxides of Cu were detected by XRD for 3.8% Cu–CeO2 (Fig. 1d), indicating the very small crystallite size. The crystallite size of Cu–CeO2 prepared catalysts were estimated by using Scherrer equation. The XRD diffractogram of 7.5% Cu–CeO2 showed characteristic peak for CuO that indicates the presence of bigger particles over CeO2 as shown in Fig. 1f. XRD pattern of 4% Cu–CeOImp.2 and 4% Cu–CeOCo.ppt.2 catalyst showed peaks corresponding to both CuO and CeO2 as shown in Fig. 1c and d. Hence, the absence of CuO in the 3.8% Cu–CeO2 catalyst indicated the presence of highly dispersed copper species on the surface of cerium oxide. The spent catalyst after four successive reuses showed the characteristic peaks for ceria only, indicating that catalyst does not change its phase during catalysis. The BET surface area of 3.8% Cu–CeO2 catalyst was found to be 75.4 m2 g−1 whereas, the 4% Cu–CeOImp.2 and 4% Cu–CeOCo.ppt.2 catalysts showed the surface area of 12 m2 g−1 and 15 m2 g−1 respectively.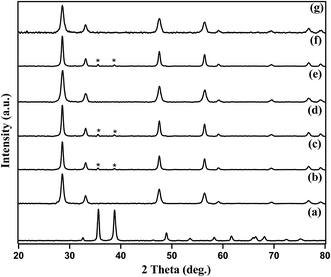 | ||
| Fig. 1 XRD patterns of (a) CuOcom., (b) CeOcom.2, (c) 4% Cu–CeOImp.2, (d) 4% Cu–CeOCo.ppt.2, (e) 3.8% Cu–CeO2, (f) 7.5% Cu–CeO2, (g) 3.8% Cu–CeOr2 (spent catalyst after 4 successive reuses). | ||
The morphology of prepared Cu–CeO2 catalysts was determined by scanning electron microscopy. The representative SEM images of the 3.8% Cu–CeO2 catalyst showed almost spherical shaped particles with size between 20–40 nm, whereas the catalyst prepared by impregnation method and co-precipitation method showed agglomerated particles and without any distinct shape as shown in Fig. S1 in ESI.† Cu dispersion on the nanocrystalline CeO2 support was confirmed by energy dispersive X-ray analysis (EDX) as shown in Fig. 2c. The elemental mapping of the catalyst revealed the homogenous distribution of Cu on nanocrystalline CeO2 support (Fig. 3).
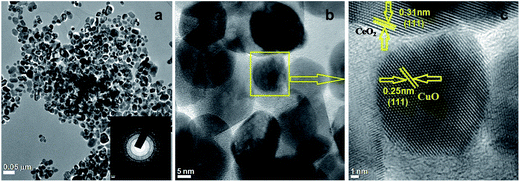
TEM micrographs reflected the alternative intuitive evidence of the morphology and lattice parameters of 3.8% Cu–CeO2. The average particle size of copper nanoparticles was observed in the ranges between 5–10 nm supported on 20–40 nm CeO2 particles which were estimated by HRTEM images as shown in Fig. 4b and c. The lattice fringes corresponding to (111) plane of CuO with a d-spacing 0.25 nm and the lattice fringes with a d-spacing of 0.32 nm corresponding to (111) plane of CeO2 is also presented in Fig. 4c. The SAED pattern of the Cu–CeO2 catalyst is also presented in Fig. 4a (inset). The particle size distribution histogram is presented in the ESI (Fig. S3 in ESI†). The morphology of the spent catalyst is also similar that of the fresh catalyst as estimated by TEM analysis and shown in Fig. S2 in ESI.†
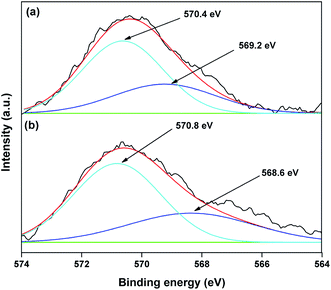
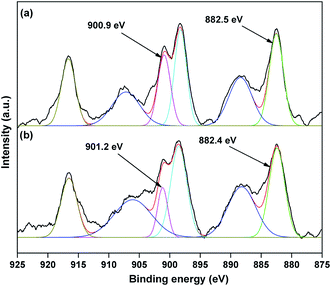
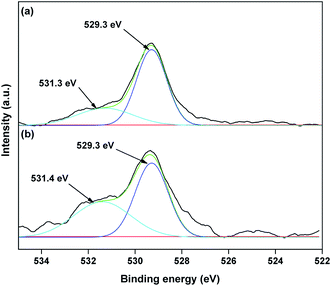
The valence state of Cu species in 3.8% Cu–CeO2 was estimated by X-ray photoelectron spectroscopy (XPS) as shown in Fig. 5a and b. The Cu 2p3/2 binding energies in the XPS spectra for the fresh catalyst showed two peaks at 931.9 eV and 933.7 eV, confirming the presence of the both Cu2+ and Cu1+ as the binding energies of Cu0 and Cu1+ are same. The CuLMM Auger spectra for the fresh catalyst showed the peak at 570.4 eV and 569.2 eV confirmed the presence of Cu1+ as well as Cu2+ in the fresh catalyst (Fig. 6a). The Cu 2p3/2 binding energies in the XPS spectra for the spent catalyst showed a broad peak and after deconvolution it showed the mixture of two peaks at binding energy values of 932.4 eV and 934.4 eV confirmed the presence of Cu2+ and Cu0/Cu1+. The CuLMM Auger spectra for the spent catalyst at 570.8 eV and 568.6 eV also confirmed the presence of Cu1+ and Cu2+ in the spent 3.8% Cu–CeO2 catalyst (Fig. 6b). Fig. 7 showed the Ce 3d binding energy spectra of the fresh 3.8% Cu–CeO2 catalyst which showed mainly six peaks at about 882.5, 888.9, 898.8, 900.9, 906.9 and 915.7 eV can be assigned to the Ce4+ by comparing with the data reported in the literature.29 So, the main valence state of CeO2 in the 3.8% Cu–CeO2 is +4. The O 1s spectra of 3.8% Cu–CeO2 catalyst is shown in Fig. 8. The main peak appeared at 529.3 eV which is assigned to lattice oxygen of the CeO2 and Cu2O phase.30 This type of lattice vacancies can be found for highly polarised oxides ions at the interface of the surface nanocrystalline oxides with low co-ordination states.31 In addition, a shoulder peak at about 531.4 eV indicating the presence of absorbed oxygen or oxygen in hydroxyl groups.32
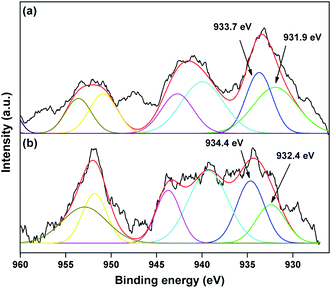 | ||
| Fig. 5 XPS spectra of Cu 2p species in 3.8% Cu–CeO2 catalyst (a) fresh catalyst, (b) spent catalyst. | ||
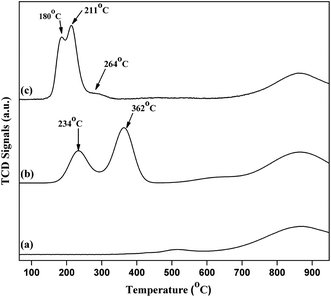
H2-temperature-programmed-reduction (TPR) was employed to determine the reducible behaviour of the Cu species present in the catalysts as shown in Fig. 9. Typical TPR profile of pure commercial CeO2 exhibited two broad high temperature reduction peaks around 518 °C and 868 °C. The peak at 518 °C is due to the presence of surface oxygen (capping oxygen) and the high temperature peak (868 °C) is due to the reduction of bulk oxygen in CeO2.33 Literature reports also revealed that Cu–CeO2 catalyst showed two peaks, where the low temperature peak exist between 180–270 °C and a high temperature peak exist in the range of 250–420 °C. It is well known that due to synergistic interaction between CuOx and CeO2 support, Tmax value decreases for the Cu species. It is also reported that CeO2 promotes the reducible behaviour of highly dispersed CuOx.34 3.8% CuO–CeO2 catalyst showed three different peaks at 180 °C, 211 °C, and 264 °C. Similar results were reported by earlier workers, where the first peak (180 °C) is the reduction of highly dispersed copper oxide, strongly interacting with the ceria surface, the second reduction peak (211 °C) is the reduction of Cu2+ ions which has weak interaction with the CeO2 and also the small size copper particles and the third one (264 °C) is the reduction of bulk CuO particles. In contrary to 4% Cu–CeOImp.2 catalyst, 3.8% CuO–CeO2 is showing superior activity mainly due to the presence of highly dispersed CuOx species interacting strongly with the CeO2 surface, with superior reducibility (reduction peak at 180 °C). The TPR profile of 4% Cu–CeOImp.2 catalyst shows 234 °C and 362 °C and the shifting of such high temperature peaks in comparison to 3.8% CuO–CeO2 hydrothermally prepared indicating the presence of agglomerated and bulk copper oxide which showed poor activity towards product formation as discussed in the activity tests.
UV-Vis DRS of 4% Cu–CeOImp.2 and 3.8% Cu–CeO2 catalyst are shown in Fig. 10. The 3.8% Cu–CeO2 shows band around 249 nm, whereas 4% Cu–CeOImp.2 showed the band around 261 nm. The blue shift can be the result of charge transfer interaction between Cu nanoparticles and nanocrystalline CeO2 particles.35
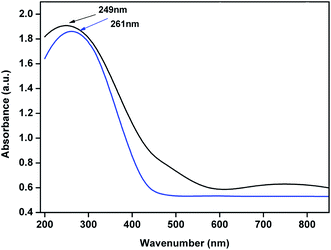 | ||
| Fig. 10 UV-Vis Diffuse Reflectance Spectroscopy spectra of the 4% Cu–CeOImp.2 (blue line) and 3.8% Cu–CeO2 catalyst (black line). | ||
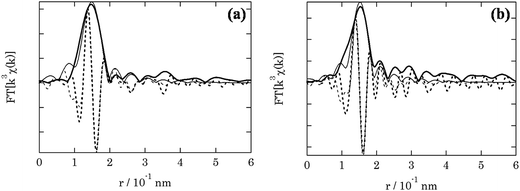
The local environment of the fresh and spent 3.8% Cu–CeO2 catalyst was analysed by EXAFS spectroscopy. Table 1 shows the structure parameters of 3.8% Cu–CeO2 catalyst analysed by the curve fitting of the Cu-k edge spectra. In the fresh sample, EXAFS shows the Cu–O bond distance 0.1943 nm with the co-ordination no. of 3. While in the spent sample, EXAFS shows the Cu–O bond distance 0.1947 nm with the co-ordination no. of 2.5. The absence of Cu–Cu bond confirmed that the metallic copper is absent in the catalysts. The EXAFS analysis also confirmed that the particle size and oxidation state of Cu was almost unchanged during the catalysis (Fig. 11).
| Sample | Path | R (10−1 nm) | CN | DW (10−5 nm2) | ΔK (10 nm−1) | ΔR (10−1 nm) | ΔE0 (eV) | Rf (%) |
|---|---|---|---|---|---|---|---|---|
| a EXAFS = extended X-ray absorption fine structure; CN = co-ordination number; R = bond length; DW: Debye–Waller factor; ΔK: the range of wavenumbers used in the fitting; ΔR: the range of bond distances used in the fitting; S02 = 0.95, S02: amplitude reducing factor; ΔE0: the shift of the edge-position; Rf: reliability factor. | ||||||||
| Fresh catalyst | Cu–O | 1.943 ± 0.013 | 3.0 ± 0.6 | 4.4 ± 1.2 | 3–10 | 1.2–2.2 | −1.7 ± 2.6 | 1.0 |
| Spent catalyst | Cu–O | 1.947 ± 0.015 | 2.5 ± 0.6 | 2.1 ± 1.2 | 3–11 | 1.2–2.2 | 0.4 ± 3.3 | 2.7 |
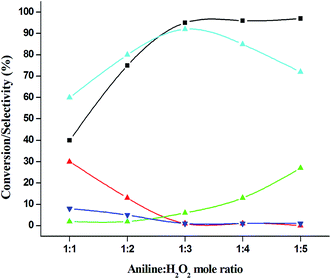
The catalytic performance of 3.8% Cu–CeO2 catalyst was tested in the selective oxidation of different aromatic amines where aniline was taken as model substrate for oxidation reaction as summarised in Table 2. Generally, nitrobenzene, azobenzene, azoxybenzene and nitrobenzene were obtained as products or by-products from the catalytic oxidation of aniline depending on catalytic system. The catalytic experiments were carried out in presence of H2O2 as the oxidising agent and acetonitrile as a solvent keeping the aniline: H2O2 mole ratio constant (1![[thin space (1/6-em)]](https://www.rsc.org/images/entities/char_2009.gif) :
:![[thin space (1/6-em)]](https://www.rsc.org/images/entities/char_2009.gif) 3) at 50 °C for 6 h. In this condition, catalyst showed maximum aniline conversion 95% with 92% selectivity towards azoxybenzene at 50 °C. Bare commercial CuO did not show any activity while commercial CeO2 showed little activity, showing 20% aniline conversion and 25% azoxybenzene selectivity as shown in entry 2 and 3, whereas blank experiment without catalyst was not able to initiate the reaction as mentioned in entry 1. Furthermore, we have synthesized CeO2 catalyst under same hydrothermal condition and found that the hydrothermally prepared CeO2 showed very low conversion (28%) and lower selectivity (27%) with respect to hydrothermally prepared 3.8% Cu–CeO2 catalyst (entry 4). The catalyst prepared by conventional impregnation (4% Cu–CeOImp.2) method showed 10% aniline conversion and 8% azoxybenzene selectivity (entry 5), while the catalyst prepared by co-precipitation method showed 32% aniline conversion with 28% azoxybenzene selectivity (entry 6). From the above results, it can be concluded that presence of highly dispersed CuOx on the surface of CeO2 definitely played a crucial role in the presented reaction. A series of experiments were conducted in order to get maximum selectivity by changing reaction parameters such as temperature, time, substrates and H2O2 mole ratio. It was observed that when the aniline H2O2 mole ratio was 1
3) at 50 °C for 6 h. In this condition, catalyst showed maximum aniline conversion 95% with 92% selectivity towards azoxybenzene at 50 °C. Bare commercial CuO did not show any activity while commercial CeO2 showed little activity, showing 20% aniline conversion and 25% azoxybenzene selectivity as shown in entry 2 and 3, whereas blank experiment without catalyst was not able to initiate the reaction as mentioned in entry 1. Furthermore, we have synthesized CeO2 catalyst under same hydrothermal condition and found that the hydrothermally prepared CeO2 showed very low conversion (28%) and lower selectivity (27%) with respect to hydrothermally prepared 3.8% Cu–CeO2 catalyst (entry 4). The catalyst prepared by conventional impregnation (4% Cu–CeOImp.2) method showed 10% aniline conversion and 8% azoxybenzene selectivity (entry 5), while the catalyst prepared by co-precipitation method showed 32% aniline conversion with 28% azoxybenzene selectivity (entry 6). From the above results, it can be concluded that presence of highly dispersed CuOx on the surface of CeO2 definitely played a crucial role in the presented reaction. A series of experiments were conducted in order to get maximum selectivity by changing reaction parameters such as temperature, time, substrates and H2O2 mole ratio. It was observed that when the aniline H2O2 mole ratio was 1![[thin space (1/6-em)]](https://www.rsc.org/images/entities/char_2009.gif) :
:![[thin space (1/6-em)]](https://www.rsc.org/images/entities/char_2009.gif) 1, then 40% aniline conversion was achieved with 60% azoxybenzene selectivity and 30% nitrosobenzene selectivity but on increasing the mole ratio of aniline and H2O2 (1
1, then 40% aniline conversion was achieved with 60% azoxybenzene selectivity and 30% nitrosobenzene selectivity but on increasing the mole ratio of aniline and H2O2 (1![[thin space (1/6-em)]](https://www.rsc.org/images/entities/char_2009.gif) :
:![[thin space (1/6-em)]](https://www.rsc.org/images/entities/char_2009.gif) 5) up to five fold excess, the conversion reached up to 97% and selectivity dropped to 72% with the increase in nitrobenzene formation (Fig. 12). During the experiments, it has been noted that there was decrease in the catalytic activity when the aniline to H2O2 mole ratio was very low (i.e. 1
5) up to five fold excess, the conversion reached up to 97% and selectivity dropped to 72% with the increase in nitrobenzene formation (Fig. 12). During the experiments, it has been noted that there was decrease in the catalytic activity when the aniline to H2O2 mole ratio was very low (i.e. 1![[thin space (1/6-em)]](https://www.rsc.org/images/entities/char_2009.gif) :
:![[thin space (1/6-em)]](https://www.rsc.org/images/entities/char_2009.gif) 1), because the reactant got lesser number of active oxidising species for catalysis and the better catalytic results was obtained with the 95% of aniline conversion when the aniline to H2O2 mole ratio was 1
1), because the reactant got lesser number of active oxidising species for catalysis and the better catalytic results was obtained with the 95% of aniline conversion when the aniline to H2O2 mole ratio was 1![[thin space (1/6-em)]](https://www.rsc.org/images/entities/char_2009.gif) :
:![[thin space (1/6-em)]](https://www.rsc.org/images/entities/char_2009.gif) 3, whereas the activity was decreased on increasing aniline to H2O2 mole ratio (1
3, whereas the activity was decreased on increasing aniline to H2O2 mole ratio (1![[thin space (1/6-em)]](https://www.rsc.org/images/entities/char_2009.gif) :
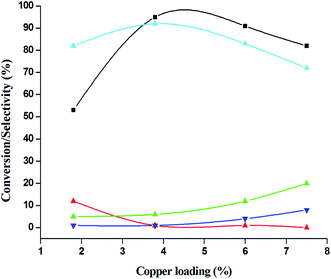
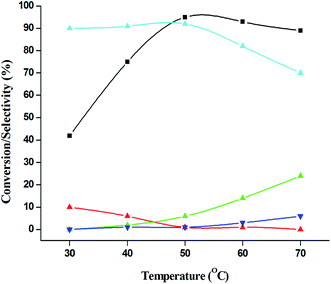
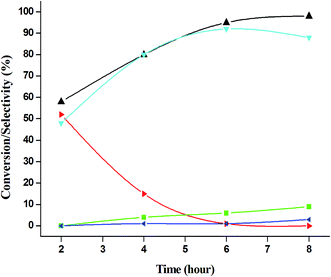
:![[thin space (1/6-em)]](https://www.rsc.org/images/entities/char_2009.gif) 5), because of over oxidation which was taking place due to the presence of excess active oxidising species (formed from excess H2O2). When the Cu loading was 1.8 wt% (1.8% Cu–CeO2), the catalysts showed 53% aniline conversion with 82% azoxybenzene selectivity while on increasing Cu content to 7.5 wt%, aniline conversion was decreased to 82% and the selectivity of azoxybenzene was decreased to 72% due to formation of azobenzene and nitrobenzene as by-product (Fig. 13). From the XRD pattern it has been noted, although lower loading of Cu (1.8% Cu–CeO2) did not show characteristic peak for CuOx, but from the experimental results, we observed lesser conversion with respect to 3.8% Cu–CeO2 catalyst which may be due to the lesser number of active site present on the surface of CeO2. Furthermore, the presence of characteristic peak for CuO in the XRD pattern of 7.5% Cu–CeO2 indicated the agglomerated species of Cu as well as bigger particle size that may be the reason of decrease in catalytic results (product selectivity). We believed that the activity of the catalysts strongly depends on Cu particle size and also the metal support interaction. At 30 °C temperature, the conversion of aniline was found to 42% with 90% azoxybenzene selectivity, whereas with increasing the temperature to 70 °C, the catalyst showed 89% aniline conversion with the decrease in azoxybenzene selectivity to 70% and nitrobenzene was formed as a by-product (Fig. 14). We believed that with increasing temperature the decomposition of H2O2 taken place and the conversion and selectivity of desired product dropped down. Therefore, it can be concluded that 3.8% Cu–CeO2 showed superior activity toward azoxybenzene due to the almost uniform Cu particle size (5–10 nm), and strong metal support interaction. The effect of run time was also investigated during catalytic aniline oxidation reaction as shown in (Fig. S4 in ESI†). It was clearly observed that the selectivity of azoxybenzene was found to be maximum (92%) after 6 h and beyond 6 h selectivity of azoxybenzene decreased due to the formation of nitrobenzene, which is the over oxidised product (Fig. 15). It was also observed that the selectivity of nitrosobenzene was maximum within 2 h and decreased with increasing time. From the experimental results, it can be summarised that 3.8% Cu–CeO2 was found to be more suitable for catalytic oxidation of aromatic amine having a substrate: H2O2 mole ratio of 1
5), because of over oxidation which was taking place due to the presence of excess active oxidising species (formed from excess H2O2). When the Cu loading was 1.8 wt% (1.8% Cu–CeO2), the catalysts showed 53% aniline conversion with 82% azoxybenzene selectivity while on increasing Cu content to 7.5 wt%, aniline conversion was decreased to 82% and the selectivity of azoxybenzene was decreased to 72% due to formation of azobenzene and nitrobenzene as by-product (Fig. 13). From the XRD pattern it has been noted, although lower loading of Cu (1.8% Cu–CeO2) did not show characteristic peak for CuOx, but from the experimental results, we observed lesser conversion with respect to 3.8% Cu–CeO2 catalyst which may be due to the lesser number of active site present on the surface of CeO2. Furthermore, the presence of characteristic peak for CuO in the XRD pattern of 7.5% Cu–CeO2 indicated the agglomerated species of Cu as well as bigger particle size that may be the reason of decrease in catalytic results (product selectivity). We believed that the activity of the catalysts strongly depends on Cu particle size and also the metal support interaction. At 30 °C temperature, the conversion of aniline was found to 42% with 90% azoxybenzene selectivity, whereas with increasing the temperature to 70 °C, the catalyst showed 89% aniline conversion with the decrease in azoxybenzene selectivity to 70% and nitrobenzene was formed as a by-product (Fig. 14). We believed that with increasing temperature the decomposition of H2O2 taken place and the conversion and selectivity of desired product dropped down. Therefore, it can be concluded that 3.8% Cu–CeO2 showed superior activity toward azoxybenzene due to the almost uniform Cu particle size (5–10 nm), and strong metal support interaction. The effect of run time was also investigated during catalytic aniline oxidation reaction as shown in (Fig. S4 in ESI†). It was clearly observed that the selectivity of azoxybenzene was found to be maximum (92%) after 6 h and beyond 6 h selectivity of azoxybenzene decreased due to the formation of nitrobenzene, which is the over oxidised product (Fig. 15). It was also observed that the selectivity of nitrosobenzene was maximum within 2 h and decreased with increasing time. From the experimental results, it can be summarised that 3.8% Cu–CeO2 was found to be more suitable for catalytic oxidation of aromatic amine having a substrate: H2O2 mole ratio of 1![[thin space (1/6-em)]](https://www.rsc.org/images/entities/char_2009.gif) :
:![[thin space (1/6-em)]](https://www.rsc.org/images/entities/char_2009.gif) 3 by using acetonitrile as a solvent at 50 °C. Different aromatic amines were also tested in the reactions over 3.8% Cu–CeO2 catalyst and their activities is summarised in Table 1 (ESI†). All the aromatic amines produced corresponding azoxybenzene with high selectivity showing that the catalyst is highly active for any aromatic amines.
3 by using acetonitrile as a solvent at 50 °C. Different aromatic amines were also tested in the reactions over 3.8% Cu–CeO2 catalyst and their activities is summarised in Table 1 (ESI†). All the aromatic amines produced corresponding azoxybenzene with high selectivity showing that the catalyst is highly active for any aromatic amines.
| Entry | Catalyst | CAniline (%) | S (%) | H2O2 efficiency | ||||
|---|---|---|---|---|---|---|---|---|
| Nitrosobenzene | Azobenzene | Nitrobenzene | Azoxybenzene | Other (%) | ||||
a Reaction conditions: substrate (aniline) = 1 g; solvent (acetonitrile) = 15 ml; 50 °C; time = 6 h; aniline: H2O2 = 1![[thin space (1/6-em)]](https://www.rsc.org/images/entities/char_2009.gif) : :![[thin space (1/6-em)]](https://www.rsc.org/images/entities/char_2009.gif) 3 (mole ratio); catalyst weight = 0.1 g, CAniline (%): conversion of aniline based on FID-GC result = moles of aniline reacted/initial moles of aniline used] × 100; S (%): selectivity of product calculated by total moles of product formed/total moles of aniline converted × 100; YAz: yield of azoxybenzene = conversion × selectivity/100; com. = commercial; CeOHydro.2 = hydrothermally prepared CeO2; Imp. = impregnation method (on comm.); Co.ppt. = catalyst prepared by co-precipitation method; r = catalyst after 4 reuses; Ph when phenyl hydroxyl amine was used as reactant with time 4 h. 3 (mole ratio); catalyst weight = 0.1 g, CAniline (%): conversion of aniline based on FID-GC result = moles of aniline reacted/initial moles of aniline used] × 100; S (%): selectivity of product calculated by total moles of product formed/total moles of aniline converted × 100; YAz: yield of azoxybenzene = conversion × selectivity/100; com. = commercial; CeOHydro.2 = hydrothermally prepared CeO2; Imp. = impregnation method (on comm.); Co.ppt. = catalyst prepared by co-precipitation method; r = catalyst after 4 reuses; Ph when phenyl hydroxyl amine was used as reactant with time 4 h. |
||||||||
| 1 | No catalyst | — | — | — | — | — | — | — |
| 2 | CuOcom. | — | — | — | — | — | — | — |
| 3 | CeOcom.2 | 20 | 22 | 30 | 23 | 25 | — | 1.7 |
| 4 | CeOHydro.2 | 28 | 20 | 27 | 26 | 27 | — | 2.5 |
| 5 | 4% CuCeOImp.2 | 10 | 2 | 6 | 4 | 8 | 80 | 0.3 |
| 6 | 4% CuCeOCo.ppt.2 | 32 | 21 | 26 | 25 | 28 | — | 2.9 |
| 7 | 3.8% CuCeO2 | 95 | 1 | 1 | 6 | 92 | — | 29.1 |
| 8 | 7.5% CuCeO2 | 82 | — | 8 | 20 | 72 | — | 19.7 |
| 9 | 1.8% CuCeO2 | 53 | 12 | 1 | 5 | 82 | — | 14.5 |
| 10 | 3.8% CuCeOr2 | 94 | 1 | 1 | 7 | 91 | — | 28.5 |
| 11 | 3.8% CuCeOPh2 | 98 | — | 2 | 3 | 95 | — | 31 |
The H2O2 was used in excess amount as an oxidising agent for this reaction over 3.8% Cu–CeO2 catalyst. Generally, H2O2 decomposes spontaneously over 3.8% Cu–CeO2 catalyst and we found that 85% H2O2 decomposes (without aniline and solvent) at 70 °C and 35% H2O2 decomposes 50 °C, so we used excess H2O2 to get available active oxygen for the oxidation.
The oxidative coupling of aniline is believed to occur in a stepwise oxidation process followed by condensation as shown in Fig. S5 in ESI.† Initially, aniline oxidised to give phenyl hydroxyl amine, which again oxidised to give nitrosobenzene and finally oxidised to nitrobenzene. Condensation of phenyl hydroxyl amine and nitrosobenzene formed azoxybenzene. When phenyl hydroxyl amine was subjected to oxidise using 3.8% Cu–CeO2 catalyst under same condition, it gives azoxybenzene within 4 h, which supports the stepwise formation mechanism (entry 11, Table 2).
For comparison purpose, we have synthesized CuO supported on commercial ceria using conventional wetness impregnation and co-precipitation method and found that the catalyst prepared by impregnation (4% Cu–CeOImp.2) and co-precipitation method (4% Cu–CeOCo.ppt.2) showed very low activity with respect to hydrothermally prepared 3.8% Cu–CeO2. From the characterisation results, we can see the agglomerated species of copper in the SEM images of 4% Cu–CeOImp.2 and 4% Cu–CeOCo.ppt.2 whereas the 3.8% Cu–CeO2 shows uniformly distributed as well as almost spherical shaped particles. The XRD pattern is the fingerprint region for the prepared catalysts which define the active exposed phase of catalysts. The XRD patterns of 4% Cu–CeOImp.2 and 4% Cu–CeOCo.ppt.2 showed the characteristic peaks for CuO that again indicates the presence of agglomerated species whereas 3.8% Cu–CeO2 do not show any peak for CuOx which indicates the presence of highly dispersed copper nanoparticles on to the surface of ceria. So, we can concluded that uniformly distributed, highly dispersed, smaller size with well defined morphology, strong metal support interaction between highly dispersed Cu-nanoparticles and CeO2 nanoparticles, and true heterogeneity are the key factors which are responsible for the superior catalytic activity compare to the catalyst prepared by impregnation or co-precipitation method. We also checked the role of copper in the catalysis and found that the bare CuO, commercial CeO2, hydrothermally prepared CeO2 was unable to enhance the catalytic performance. Hence, we can summarise although CeO2 has good oxygen storage capacity but in our case copper facilitate the selective oxidation of aromatic amines to azoxybenzene.
There are various reports where the CeO2 is proved to be excellent support for the gas as well as liquid phase reactions. From our experimental findings; the presence of highly dispersed CuOx (5–10 nm) supported on CeO2 (20–40 nm) surface plays a significant role towards selective oxidation of aromatic amines to corresponding azoxybenzene. To the best of our knowledge, there is no report on such hydrothermally prepared 3.8% Cu–CeO2 catalyst with the 95% aniline conversion and 92% azoxybenzene selectivity at 50 °C using H2O2 as an oxidant.
In order to check the reusability of the catalyst, the solid catalyst particles were recovered from the reaction mixture by filtration during hot condition. It was observed that the reaction was stopped after removal of catalyst from the reaction mixture. The solid catalyst particles were filtered by hot filtration method and washed with acetone followed by drying at ambient temperature for 10 h and used as such. Then, these dried catalyst particles were reused for oxidation of aniline to azoxybenzene and this process was further employed to four consecutive runs. From the tests, we observed that the 3.8% Cu–CeO2 did not lose its activity (conversion and selectivity) after four catalytic cycles (Fig. S4 in ESI†) and the true heterogeneity of catalyst was estimated by ICP-AES analysis that showed no loss of copper in spent catalyst (after 4 successive runs). The amount of Cu and Ce present in the spent catalyst was almost same as that of the fresh catalyst as estimated by ICP-AES confirmed the true heterogeneous nature of the catalyst.
Conclusion
In conclusion, we have prepared copper nanoparticles supported on nanocrystalline CeO2 by one pot hydrothermal method using cationic surfactant cetyltrimethylammonium bromide (CTAB). The catalyst was characterised by XRD, XPS, SEM, TEM, TGA, FT-IR, UV-VIS, EXAFS, and ICP-AES. HRTEM analysis showed the presence of uniformly dispersed Cu nanoparticles with size (5–10 nm) supported on CeO2 nanoparticles with size 20–40 nm. H2-TPR also showed the presence of highly dispersed Cu particles with the strong interaction with CeO2. 3.8% Cu loading was the optimum loading to give maximum activity for the aniline oxidation to azoxybenzene formation. The 3.8% Cu–CeO2 catalyst showed 95% aniline conversion with 92% azoxybenzene selectivity at 50 °C with H2O2.Acknowledgements
The authors thank Analytical Science Division, Indian Institute of Petroleum for analytical services and grateful to CSIR, New Delhi for the financial support in the form of 12 FYP Project (CSC-0125, CSC-0117). The Director, CSIR-IIP, is acknowledged for his help and support. The XAFS measurements were performed at KEK-IMSS-PF, Tsukuba, Japan with the approval of the Photon Factory Advisory Committee (Project 2013 G 208).Notes and references
- T. Seto, H. Akinaga, F. Takano, K. Koga, T. Orii and M. Hirasawa, J. Phys. Chem. B, 2005, 109, 13403–13405 CrossRef PubMed.
- S. H. Ko, Y. Choi, D. J. Hwang, C. P. Grigoropoulos and D. Poulikakos, Appl. Phys. Lett., 2006, 89, 141126 CrossRef.
- T. Mitsudome, Y. Mikami, M. Matoba, T. Mizugaki, K. Jitsukawa and K. Kaneda, Angew. Chem., Int. Ed., 2012, 51, 136–139 CrossRef CAS PubMed.
- (a) E. P. Murray, T. Tsai and S. A. Barnett, Nature, 1999, 400, 649–651 CrossRef CAS; (b) J. Chen, S. Patil, S. Seal and J. F. McGinnis, Nat. Nanotechnol., 2006, 1, 142–150 CrossRef CAS PubMed; (c) W. C. Chueh, Y. Hao, W. Jung and S. M. Haile, Nat. Mater., 2012, 11, 155–161 CrossRef CAS PubMed.
- (a) W. Deng and M. Flytzani-Stephanopoulos, Angew. Chem., Int. Ed., 2006, 45, 2285–2289 CrossRef CAS PubMed; (b) M. Cargnello, C. Gentilini, T. Montini, E. Fonda, S. Mehraeen, M. Chi, M. Herrera-Collado, N. D. Browning, S. Polizzi, L. Pasquato and P. Fornasiero, Chem. Mater., 2010, 22, 4335–4345 CrossRef CAS; (c) J. K. Edwards, J. Pritchard, L. Lu, M. Piccinini, G. Shaw, A. F. Carley, D. J. Morgan, C. J. Kiely and G. J. Hutchings, Angew. Chem., Int. Ed., 2014, 53, 2381–2384 CrossRef CAS PubMed; (d) M. Cargnello, J. J. Delgado Jaen, J. C. Hernandez Garrido, K. Bakhmutsky, T. Montini, J. J. Calvino Gamez, R. J. Gorte and P. Fornasiero, Science, 2012, 337, 713–717 CrossRef CAS PubMed.
- L. Qian, J. Zhu, W. Du and X. Qian, Mater. Chem. Phys., 2009, 115, 835–840 CrossRef CAS.
- I. Yamaguchi, M. Watanabe, T. Shinagawa, M. Chigane, M. Inaba, A. Tasaka and M. Izaki, ACS Appl. Mater. Interfaces, 2009, 1, 1070–1075 Search PubMed.
- (a) M. Hirano and M. Inagaki, J. Mater. Chem., 2000, 10, 473–477 RSC; (b) Z. Guo, F. Jian and F. Du, Scr. Mater., 2009, 61, 48–51 CrossRef CAS.
- H. Xiao, Z. Ai and L. Zhang, J. Phys. Chem. C, 2009, 113, 16625–16630 CrossRef CAS.
- P. Ji, J. Zhang, F. Chen and M. Anpo, Appl. Catal., B, 2009, 85, 148–154 CrossRef CAS.
- (a) P. Pal, S. K. Pahari, A. Sinhamahapatra, M. Jayachandran, G. V. M. Kiruthika, H. C. Bajaj and A. B. Panda, RSC Adv., 2013, 3, 10837–10847 RSC; (b) J. Han, H. J. Kim, S. Yoon and H. Lee, J. Mol. Catal. A: Chem., 2011, 335, 82–88 CrossRef CAS; (c) P. X. Huang, F. Wu, B. L. Zhu, X. P. Gao, H. Y. Zhu, T. Y. Yan, W. P. Huang, S. H. Wu and D. Y. Song, J. Phys. Chem. B, 2005, 109, 19169–19174 CrossRef CAS PubMed; (d) C. S. Pan, D. S. Zhang, L. Y. Shi and J. H. Fang, Eur. J. Inorg. Chem., 2008, 2008, 2429–2436 CrossRef.
- G. Avgouropoulos, T. Ioannides and H. Matralis, Appl. Catal., B, 2005, 56, 87–93 CrossRef CAS.
- (a) S. S. Acharyya, S. Ghosh, R. Tiwari, B. Sarkar, R. K. Singha, C. Pendem, T. Sasaki and R. Bal, Green Chem., 2014, 16, 2500–2508 RSC; (b) S. Ghosh, S. S. Acharyya, S. Adak, L. N. S. Konathala, T. Sasaki and R. Bal, Green Chem., 2014, 16, 2826–2834 RSC; (c) B. Sarkar, P. Prajapati, R. Tiwari, S. Ghosh, S. S. Acharyya, C. Pendem, R. K. Singha, L. N. S. Konathala, J. Kumar, T. Sasaki and R. Bal, Green Chem., 2012, 14, 2600–2606 RSC; (d) S. S. Acharyya, S. Ghosh and R. Bal, Chem. Commun., 2014, 50, 13311–13314 RSC; (e) S. Ghosh, S. S. Acharyya, R. Tiwari, B. Sarkar, R. K. Singha, C. Pendem, T. Sasaki and R. Bal, ACS Catal., 2014, 4, 2169–2174 CrossRef CAS; (f) A. Shukla, R. K. Singha, T. Sasaki and R. Bal, Green Chem., 2015, 17, 785–790 RSC; (g) S. Ghosh, S. S. Acharyya, T. Sasaki and R. Bal, Green Chem., 2015, 17, 1867–1876 RSC; (h) S. S. Acharyya, S. Ghosh and R. Bal, ACS Appl. Mater. Interfaces, 2014, 6, 14451–14459 CrossRef CAS PubMed.
- S. Sakuae, T. Tsubakino, Y. Nishiyama and Y. Ishii, J. Org. Chem., 1993, 58, 3633–3638 CrossRef.
- E. Buncel, Can. J. Chem., 2000, 78, 1251–1271 CAS.
- R. W. White and W. D. Emmons, Tetrahedron, 1962, 17, 31–34 CrossRef CAS.
- O. H. Wheeler and D. Gonzalez, Tetrahedron, 1964, 20, 189–193 CrossRef CAS.
- H. E. Baumgarten, A. Staklis and E. M. Miller, J. Org. Chem., 1965, 30, 1203–1206 CrossRef CAS.
- E. Wenkert and B. Wickberg, J. Am. Chem. Soc., 1962, 84, 4914–4919 CrossRef CAS.
- G. Barak and Y. Sasson, J. Org. Chem., 1989, 54, 3484–3486 CrossRef CAS.
- Y. Shiraishi, H. Sakamoto, K. Fujiwara, S. Ichikawa and T. Hirai, ACS Catal., 2014, 4, 2418–2425 CrossRef CAS.
- T. Selvam and A. V. Ramaswamy, Chem. Commun., 1996, 1215–1216 RSC.
- Z. Zhu and J. H. Espenson, J. Org. Chem., 1995, 60, 1326–1332 CrossRef CAS.
- M. H. Alizadeh and R. Tayebee, J. Braz. Chem. Soc., 2005, 16, 108–111 CrossRef CAS.
- A. Grirrane, A. Corma and H. García, Science, 2008, 322, 1661–1664 CrossRef CAS PubMed.
- L. Yang, G. Shi, X. Ke, R. Shen and L. Zhang, CrystEngComm, 2014, 16, 1620–1624 RSC.
- M. I. Qadir, J. D. Scholten and J. Dupont, Catal. Sci. Technol., 2015, 5, 1459–1462 Search PubMed.
- (a) S. S. Acharyya, S. Ghosh and R. Bal, ACS Sustainable Chem. Eng., 2014, 2, 584–589 CrossRef CAS; (b) S. Ghosh, S. S. Acharyya, T. Sasaki and R. Bal, Green Chem., 2015, 17, 1867–1876 RSC; (c) S. Ghosh, S. S. Acharyya, M. Kumar and R. Bal, Nanoscale, 2015, 7, 15197–15208 RSC.
- Y.-W. Zhang, R. Si, C.-S. Liao and C.-H. Yan, J. Phys. Chem. B, 2003, 107, 10159–10167 CrossRef CAS.
- G. Avgouropoulos and T. Ioannides, Appl. Catal., B, 2006, 67, 1–11 CrossRef CAS.
- C. D. Wagner, W. M. Riggs, L. E. Davis and J. F. Moulder, Handbook of X-ray Photoelectron spectroscopy, Perkin-Elmer corporation, Eden Prairie, 1979 Search PubMed.
- M. Boaro, M. Vicario, C. D. Leitenburg, G. Dolcetti and A. Trovarelli, Catal. Today, 2003, 77, 407–417 CrossRef CAS.
- F. Giordano, A. Trovarelli, C. D. Leitenburg and M. Giona, J. Catal., 2000, 193, 273–282 CrossRef CAS.
- (a) W. Liu and M. Flytzanistephanopoulos, J. Catal., 1995, 153, 304–316 CrossRef CAS; (b) G. Avgouropoulos, T. Ioannides and H. Matralis, Appl. Catal., B, 2005, 56, 87–93 CrossRef CAS; (c) S. Abanades, S. Tescari, S. Rodat and G. Flamant, J. Nat. Gas Chem., 2009, 18, 1–8 CrossRef CAS.
- S. R. Sahu, M. M. Devi, P. Mukherjee, P. Sen and K. Biswas, J. Nanomater., 2013, 2013, 1–9 CrossRef.
Footnote |
| † Electronic supplementary information (ESI) available. See DOI: 10.1039/c5ra25699b |
| This journal is © The Royal Society of Chemistry 2016 |

