Stereocomplex poly(lactic acid) nanoparticles crystallized through nanoporous membranes and application as nucleating agent

Hiroki Uehara*, Mina Ishizuka, Hidekazu Tanaka, Makiko Kano and Takeshi Yamanobe
Division of Molecular Science, Faculty of Science and Technology, Gunma University, Kiryu, Gunma 376-8515, Japan. E-mail: hirokiuehara@gunma-u.ac.jp

Received 2nd December 2015 , Accepted 20th January 2016

First published on 26th January 2016


Abstract

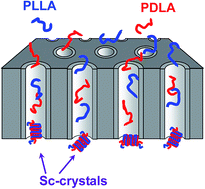
Stereocomplex crystallization of poly(L-lactic acid) (PLLA) and poly(D-lactic acid) (PDLA) was performed by flowing their blended solution through nano-channels of porous membranes. The spacing restriction within the nano-channels induces contact between the PLLA and PDLA chains. The stereocomplex crystalline structure of the obtained material was confirmed by differential scanning calorimetry and X-ray measurements. Morphological observation by scanning-electron microscopy indicated that the characteristic nano-particles with a diameter corresponding to the channel width aggregate with each other. Such nano-particles play the role of nucleating agent for matrix crystallization when they are blended with pure PLLA. The non-isothermal crystallization temperature on cooling from the melt of this blend is higher than that of pure PLLA matrix. Correspondingly, the shorter time is required for the isothermal crystallization of this blend.
Introduction

Poly(lactic acid) (PLA) is synthesized from lactic acid produced from agricultural sources, including corn, potatoes, and sugarcane. Such bio-based synthesis of PLA is beneficial for food packaging where health safety is of concern nowadays.1 Another characteristic of PLA is its unique crystal modification of a stereocomplex (Sc) composed of an equimolar pair of poly(L-lactic acid) (PLLA) and poly(D-lactic acid) (PDLA) chains, which has been reported by pioneer studies of Tsuji et al.2–6 This Sc-form exhibits a remarkably higher melting temperature (Tm). Iwata et al.7,8 reported the superior resistance to hydrolysis decomposition of Sc-form crystals, as compared with the usual α-form crystals of pure PLLA and PDLA. The high Tm of Sc-form also delay thermal degradation on heating.9

The crystallization of the Sc-form crystals is also unique. We10 discovered that the composition of Sc-form at the film surface becomes higher than that internal to the film when the blend film is crystallized even from homogeneous melt. This suggests that molecular packing within a limited space, such as film surfaces, enhances Sc-form crystallization. We11 extended this concept for constrained Sc-form crystallization within the micro-phase separation induced by a block copolymer. The blend of a block copolymer containing a PLLA segment with pure PDLA yielded a higher content of Sc-form crystals compared to the corresponding blend of pure PLLA and PDLA. The coincident size of the micro-phase separation and the resultant Sc-form crystals on the nanometer scale is a key to the accelerated pairing of PLLA and PDLA segments. Such a micro-phase separation mechanism of block copolymer has been utilized for preparing micro-particles12 or surface deposits containing Sc-form crystals.13

In this study, we achieved preferred pairing of PLLA and PDLA molecules within a limited space through the pores of nanoporous membranes. In order to crystallize into the Sc-form, the PLLA and PDLA molecules should be fully dispersed into each other. Therefore, the PLLA and PDLA molecules are dissolved in chloroform, which is a good solvent for both PLAs. The later extraction of chloroform is enabled by immersing in a poor solvent, methanol. Thus, the chloroform solution containing PLLA and PDLA and the extracting methanol are set up while separated by the nanoporous membrane. When the methanol is evacuated by an aspirator, the counter-chloroform solution is introduced into the nanopores, which are filled with methanol. The obtainable Sc-form crystals are particles with a size corresponding to the nanopore. It is considered that the PLLA and PDLA molecules crystallize within the nanopores of the adopted membrane, resulting in Sc-form nanoparticles. Similar nanopore extrusion has been applied for preparing nanoparticles of block copolymers.14 This method achieves a smaller particle size than the emulsion-droplet techniques, resulting in precisely spherical micro-particles.15–19

Nanoparticles of PLA are often used for biomedical applications, such as drug delivery20–27 and tissue engineering,28 where nanoparticle formation is mostly due to self-assembly of block copolymers containing a component other than PLA12,29 or functionalization using modifier segments.30,31 Here, we prepared nanoparticles composed of pure PLLA and PDLA, which thus are available as a nucleating agent for the PLA matrix. One of the industrial difficulties for PLA application is its slow crystallization rate,32,33 which undesirably prolongs the processing time from melt. The amorphous portion is retained after conventional molding such as injection molding or film extrusion for PLA, but gradually crystallizes while being stored, even at room temperature, causing brittleness of the PLA mold. In order to improve the crystallization rate of PLA, various fillers are added to molten PLA as nucleating agents.34–38 Recently, an organic nucleating agent specialized for PLA has been commercialized.39,40

Another approach for accelerating the crystallization of PLA is using a higher Tm of Sc-form crystals. When a blend of PLLA matrix with a small amount of PDLA is heated above the Tm of an α-form crystal, the Sc-form still remains. Such surviving Sc-form crystals play the role of nuclei for PLLA crystallization41–44 or drawing.45 We expect that the Sc-form nanoparticles prepared in this study will exhibit a similar effect on the crystallization of a PLA matrix.

Recently, Arias et al.46 developed a spray droplet technique for preparing nanoparticles of Sc-form crystals of PLLA/PDLA. Their technology utilizes the rapid evaporation of solvent from the PLLA/PDLA solution during spray drying. They47 also applied such nanoparticles as nucleating agent for PLLA matrix, and successfully obtained the PLA homocomposite with superior mechanical properties. In contrast, our nanoparticle formation is achieved by immediate extraction at the interface with a poor solvent within the nanopores of an adopted nanoporous membrane, which will give the smaller particle size. Also, we estimate the effect of the Sc-form nanoparticle on crystallization rate of PLLA matrix in this study.

Experimental section

Initial materials

A PLLA material (LACEA, Mitsui Chemicals, Inc.; weight-average molecular weight (Mw) = 2.20 × 10⁵, average-number molecular weight (Mn) = 1.30 × 10⁵) and a PDLA material (Purac Japan; Mw = 2.30 × 10⁵, Mn = 1.40 × 10⁵) were used in this study. The Mw values for the two materials were almost the same. In the case of 105 MW level, the accurate MW adjustment of PLLA and PDLA pair is not necessarily required even in the other literatures. The specific optical rotation measured in chloroform at 25 °C at a wavelength of 589 nm ([α]D) was −154° for the PLLA material and +155° for the PDLA material, suggesting that the optical purity of both of these samples was 99.5%. The PLLA and PDLA materials were used after removing the oligomer and the polymerization catalyst (stannous octoate). Before the polymer solution was prepared, both materials were dried at 100 °C for 24 hours in a vacuum. Polymer solutions of 1 wt% PLLA and PDLA were prepared separately by dissolving the requisite amount of the polymer in chloroform at room temperature. The solutions were admixed by vigorous stirring to prepare a solution of an equimolar blend of PLLA and PDLA as a PLLA/PDLA blended sample.

Nanoparticle preparation

The experiment setup depicted in Fig. 1 was designed in order to achieve Sc-crystallization within the nanopores of the porous membranes. The porous membranes used in this study were an Advantec hydrophilic PTFE membrane filter (H010A047A) with an average pore diameter of 100 nm and a thickness of 30 μm and an alumina membrane supplied by Whatman with 20 nm pores and a thickness of 60 μm. The targeted porous membrane was sandwiched between glass cells A and B, which are designed for permeation of the tested solution through the membrane. Bottom glass cell B was jointed to the circulation aspirator by a silicone tube. This cell was filled with methanol, and the height of the downstream trap was adjusted to keep a full level of methanol in the joint position.
image file: c5ra25688g-f1.tif
Fig. 1 Experimental setup designed for the preparation of PLLA/PDLA nanoparticles in this study.

To prepare this permeation setup, the above porous membrane was pre-soaked in methanol and then positioned to cover the joint region of bottom cell B filled with methanol. A 10 ml chloroform solution of PLLA/PDLA (1 wt%) was poured into upper cell A after cell B was placed on this assembly and fixed with a clip. Subsequently, the solution in cell A was passed through the porous membrane into methanol in cell B with aspiration, which was continued until cell A was empty. Cell B was stirred by a magnetic stirrer during the permeation. The volume of methanol used was 80 ml, the amount needed to fill cell B as well as part of the downstream trap and connecting tube. The aspiration pressure controls the permeation time. For the PTFE filter, permeation times varied from 1 min to 15 min. The anodic aluminum membrane would have been broken by such rapid permeation, so its permeation time was increased to three hours.

Blending with pure PLLA

The above solutions containing pure PLLA and nanoparticles were mixed with pure PLLA solution before permeation at room temperature, and then poured into a Petri dish and dried under ambient conditions. The volume ratios of pure PLLA and PLLA/PDLA varied from 95[thin space (1/6-em)]:[thin space (1/6-em)]5 to 80[thin space (1/6-em)]:[thin space (1/6-em)]20. The obtained aggregates of the blends with pure PLLA were used for the DSC crystallization measurements. For comparison, the aggregate of the original PLLA/PDLA nanoparticles was also prepared in the same manner. The other 90[thin space (1/6-em)]:[thin space (1/6-em)]10 blend was prepared from the PLLA/PDLA suspension prepared by direct pouring into methanol without passing through a nanoporous membrane. In this case, the blend ratio of 90[thin space (1/6-em)]:[thin space (1/6-em)]10 was chosen for comparison.

Measurements

The morphologies of the prepared PLLA/PDLA nanoparticles were analysed using a Hitachi field-emission SEM S-4800 operated at 1.0 kV. Nanoparticle solutions prepared under different conditions were put on the freshly cleft mica surface at room temperature. Pt–Pd coating with 5 angstrom thickness was performed by a Hitachi ion-sputter E-1045 at room temperature. The 500 nanoparticles were selected in SEM images obtained under the targeted preparation condition, and their sizes were measured by scaling software equipped with SEM facility. The volume-averaged size was calculated from these accumulated data sets.

Wide-angle X-ray diffraction (WAXD) measurements of the prepared nanoparticles were performed using a Rigaku MicroMAX-007HF X-ray generator with a confocal multilayer mirror. The wavelength of the incident CuKα beam was 1.54 angstroms. The obtained WAXD patterns were recorded using a cooled CCD camera (Hamamatsu Photonics, C4742-98) with an image intensifier (Hamamatsu Photonics, V7739P). The aggregates of the original PLLA/PDLA nanoparticles were put into a silica glass capillary tube with 0.05 mm thickness and 1.0 mm diameter (W. Muller, Germany). This capillary was set into a heating device designed for in situ X-ray measurements.11 The temperature was raised from room temperature to 250 °C. Heating rate was 5 °C min−1.

A Perkin-Elmer Diamond DSC was used for crystallization measurements in a nitrogen gas flow. The aggregates of the original PLLA/PDLA nanoparticles and the blends with pure PLLA matrix were sealed in DSC pans. Cooling scans were performed from 30 to 200 °C at a rate of 10 °C min−1 after holding at 200 °C for 5 min. Isothermal crystallization was also performed over a temperature range from 110 to 140 °C. The temperature and fusion heat were calibrated using indium and tin standards.

Results and discussion

Solution containing nanoparticles

The permeated solutions obtained in Fig. 1 were stored in glass tubes. Their appearances were compared after standing. For permeation through the PTFE filter, clouded solutions were obtained, independent of permeation time. In contrast, the solution permeated through the alumina membrane was less clouded, due to the lower concentration of resultant PLA particles. These differences are attributed to the pore geometries of the targeted membranes. The PTFE filter is composed of fibrillar networks, allowing various routes through the membrane. This is advantageous for yielding a higher amount of nanoparticles. In contrast, the pore channels of alumina membrane are straight and oriented perpendicular to the membrane surface. Such one-way geometry of the pores is often blocked by particles produced within the pore channels.

Preparation of PLA nanoparticles

The obtained solution containing PLLA/PDLA nanoparticles was deposited on a freshly cleaved mica substrate and observed by SEM. Fig. 2 compares the morphologies of the nanoparticles obtained from the solution permeated through a PTFE filter for 15 min and those through an alumina membrane for three hours. The nanoparticles obtained for the shorter permeation times through the former membrane are also depicted in Fig. S1 and S2 (ESI). The permeation through alumina membrane seems to yield a smaller particle size with a homogeneous size distribution.
image file: c5ra25688g-f2.tif
Fig. 2 SEM photographs of nanoparticles prepared through PTFE filter (top) and alumina membrane (bottom). Filtration times were 15 min for the former (A and B) and 3 hours for the latter (C and D). Low (left) and high magnification images (right) are compared with scale bars of 2 μm and 200 nm.

In order to evaluate the particle size quantitatively, the diameters of 500 nanoparticles were measured in SEM images, and the particle numbers in every 100 nm diameter range were plotted in a histogram. Fig. 3A to C compare the histograms for nanoparticles obtained through the PTFE filter for different permeation times. The result obtained through the alumina membrane is depicted in Fig. 3D. The mean diameter is 200 to 400 nm for 5 min permeation through the PTFE filter in Fig. 3A, but larger particles with 400 nm diameter are also observable. Increasing the permeation time to 15 min increases the fraction of particles smaller than 400 nm, as depicted in Fig. 3B. In Fig. 3C, most of the obtained particles have sizes from 100 to 300 nm, representing a homogeneous size distribution for 15 min permeation. The nanoparticles obtained through the alumina membrane after three hours of permeation had the narrowest size distribution in this study, as depicted in Fig. 3D.


image file: c5ra25688g-f3.tif
Fig. 3 Size histograms of the aggregates of nanoparticles prepared through PTFE filter for 1 (A), 5 (B) and 15 min (C) and alumina membrane for 3 hours (D).

The obtained particle sizes are often larger than the pore size of the used membrane. The PLLA/PDLA solution is extruded through pores filled with the methanol which solidifies the solution into the noodle-like aggregates, as depicted in Fig. S2. Such noodle-like aggregates can easily coagulate into the spherical particles, giving the larger size than that expected from the pore size of the used membrane.

The volume-averaged particle size was calculated from these histograms and is plotted in Fig. 4A. The blue triangles (red squares) indicate data for the nanoparticles passing through the PTFE filter (alumina membrane). An increase in permeation time reduces the particle size, as mentioned above. However, the alumina membrane requires the slowest permeation (three hours), and fewer nanoparticles obtained through the PTFE filter. Fig. 4B schematically depicts the nanoparticle formation from the solution containing PLLA and PDLA. Here, the enhanced Sc-form crystallization within such limited space is expected, thus crystalline modification of the obtained nanoparticles was confirmed by wide-angle X-ray diffraction (WAXD).


image file: c5ra25688g-f4.tif
Fig. 4 Size and model for permeated nanoparticles. (A) Averaged particle size of the particles calculated from the histograms depicted in Fig. 3. (B) Illustration of the formation model of PLLA/PDLA nanoparticles during passing through porous membrane.

Crystalline structure of prepared nanoparticles

Fig. 5 depicts the 2θ profiles for the PLLA/PDLA nanoparticles permeated through the PTFE filter for 15 min. The main peaks are (110), (200,110,121), and (220) reflections assigned to Sc-form crystal and the broad amorphous halo. The other reflection set is attributed to the α-form, i.e. the (200,110) and (203) reflections. These results suggest that the crystalline modification for PLLA/PDLA nanoparticles prepared in this study is preferentially Sc-form, but accompanied by minor α-form crystals. Peak fitting with Sc- and α-form reflections and the amorphous halo indicate that the Sc-form (α-form) fraction is 32% (17%). Such lower Sc efficiency in this study is ascribed to the higher MW level in the range of 105, which has been similarly reported.48
image file: c5ra25688g-f5.tif
Fig. 5 WAXD profile recorded at room temperature for the PLLA/PDLA nanoparticles prepared by passing through PTFE filter for 15 min. Peak resolutions into the Sc- and α-form reflections and amorphous halo were also included.

We focus on the higher Tm of Sc-form than that of α-form. If the above-mentioned PLLA/PDLA nanoparticles prepared in this study are annealed above the Tm of α-form, the α-form crystals melt, but the Sc-crystals survive. Indeed, Fujita et al.49 has revealed the annealing-enhanced Sc-crystallization by using in situ WAXD measurement during annealing the mixture of single crystals of PLLA and PDLA. Therefore, we also adopt this in situ WAXD measurement technique for heating of PLLA/PDLA nanoparticles prepared by 15 min-permeation through the PTFE filter. The heating rate was 5 °C min−1. The obtained 2θ profiles are duplicated as a function of the measurement temperature in Fig. 6A. The diffraction intensity is represented by color gradations from lower (blue) to higher (red). With increasing temperature, the (200,110)α and (203)α reflection peaks are gradually reduced and disappear around 160 °C. In contrast, the intensities of the (110)Sc, (200,110,121)Sc, and (220)Sc reflection peaks increase during heating. These intensity changes were quantitatively separated by peak deconvolution into α-form and Sc-form reflections and the amorphous halo, similar to Fig. 5. The integral intensities of the resolved peaks are plotted as a function of temperature in Fig. 6B. At 100 °C, the intensity of the reflections assigned to the α-form crystals significantly increase, but that of the amorphous halo rapidly decreases. Such corresponding changes in intensity indicate cold-crystallization from amorphous to α-form crystals during heating. In contrast, the monotonical increases of the Sc-form reflections suggest that cold-crystallization into the Sc-form also continues in this temperature region. The intensity increases of the Sc-form reflections are accelerated beyond the Tm of α-form crystals. In contrast, the amorphous intensity is almost constant in this temperature range. These results mean that the melt originates from α-form crystals above its Tm, followed by immediate Sc-crystallization during further heating.


image file: c5ra25688g-f6.tif
Fig. 6 In situ WAXD measurement results during heating for the PLLA/PDLA nanoparticles prepared by passing through PTFE filter for 15 min. Heating rate was 5 °C min−1. (A) Duplicated line profiles extracted from the series of in situ WAXD patterns. The intensity was represented by a colour gradation from blue (low) to red (high). (B) Temperature dependence of the reflection intensities of Sc- and α-form with that of amorphous halo in (A).

Namely, there are two different mechanisms of Sc-crystallization in this study. One is the Sc-crystallization during nanoparticle formation where PLLA and PDLA molecules contained within chloroform are extruded into the membrane pores filled with the methanol. The other is later cold-crystallization when the nanoparticles are heated beyond 200 °C, where the amorphous phase obtained from melting α-form crystals crystallizes into Sc-form crystals.

Therefore, the PLLA/PDLA nanoparticles prepared in this study were annealed at 200 °C. To optimize the annealing conditions, the heating rates were varied from 5 to 100 °C min−1. The resultant WAXD profiles, recorded at room temperature, are compared in Fig. 7. Only reflections assigned to the Sc-form were recognized, independent of the applied cooling rate. However, a higher Sc-crystallinity was obtained for the lower cooling rate. The highest Sc-crystallinity was 64% for 5 °C min−1, which is twice the original value. This means that perfectly Sc-crystalline nanoparticles are obtainable when annealed at 200 °C.


image file: c5ra25688g-f7.tif
Fig. 7 WAXD profiles of the PLLA/PDLA nanoparticles cooled at 5 (A), 10 (B), 40 (C), and 100 °C min−1 (D) after heating to 200 °C. WAXD measurements were performed at room temperature.

Matrix crystallization with prepared nanoparticles

As mentioned above, a slow crystallization rate is disadvantageous for industrial usage of PLA, thus various nucleating agents, including inorganic fillers, have been applied to increase the crystallinity of PLA moulds. The annealed PLLA/PDLA nanoparticles prepared in this study are available as a candidate such nucleating agent because they are composed of Sc-form crystals with higher content, as depicted in Fig. 7. Therefore, the PLLA/PDLA nanoparticles were mixed with PLLA matrix, and this assembly was once annealed at 200 °C. Subsequent crystallization upon cooling was analysed. The tested nanoparticles were prepared through the PTFE filter for 15 min. PLLA nanoparticles were also prepared as the matrix content in the same manner from pure PLLA solution. Blending with these nanoparticles is beneficial for ideal dispersion of Sc-form nanoparticles within the PLLA matrix. Such blending is enabled by mixing methanol dispersions containing nanoparticles of PLLA/PDLA and pure PLLA with the various contents, 95[thin space (1/6-em)]:[thin space (1/6-em)]5 to 80[thin space (1/6-em)]:[thin space (1/6-em)]20. Dried assemblies are analysed by WAXD and differential scanning calorimetry (DSC). For comparison, pure PLLA nanoparticles alone were also tested.

First, the cooling process after annealing was analysed by in situ WAXD measurements. An 80[thin space (1/6-em)]:[thin space (1/6-em)]20 blend of PLLA matrix and PLLA/PDLA nanoparticles was heated to 200 °C at a heating rate of 5 °C min−1 and subsequently cooled to room temperature at 5 °C min−1. A series of 2θ profiles obtained during cooling is duplicated as a function of temperature in Fig. 8B. For comparison, the data for pure PLLA nanoparticles alone in Fig. 8A were also evaluated as matrix behaviour in Fig. 8A. At 200 °C before cooling, only the amorphous halo was observed for pure PLLA matrix in molted state. With cooling, (200,110)α and (203)α reflection peaks appear around 110 °C. In contrast, the 80[thin space (1/6-em)]:[thin space (1/6-em)]20 blend exhibits the Sc-form reflection set of (110)Sc, (200,110,121)Sc, and (220)Sc with the amorphous halo at 200 °C. With further decreasing temperature, the other α-form reflection set was recognizable below 130 °C. Simultaneously, the Sc-form reflection intensity seemed to decrease slightly, which is ascribed to a reduction in the overlapped amorphous halo due to crystallization. It should be noted that the PLLA/PDLA nanoparticles never crystallized into the α-form, as seen in Fig. 7. Therefore, any α-form crystallization during cooling is attributed to the matrix PLLA.


image file: c5ra25688g-f8.tif
Fig. 8 Duplicated line profiles extracted from the series of in situ WAXD patterns recorded during cooling for pure PLLA particles (A) and the 80[thin space (1/6-em)]:[thin space (1/6-em)]20 blend of pure PLLA matrix and PLLA/PDLA nanoparticles (B). These aggregates were first heated at 200 °C and maintained for 5 min, followed by cooling at 5 °C min−1 to room temperature. The intensity was represented by a colour gradation from blue (low) to red (high).

Such α-form crystallization of the matrix PLLA is also confirmed from the WAXD reflection intensity changes, in Fig. 8. The peaks of the α-form and Sc-form reflections and the amorphous halo were deconvoluted, and the total integral intensity of each phase is plotted as a function of temperature in Fig. 9. Cooling pure PLLA nanoparticles reduces intensity in the amorphous halo at 110 °C with a corresponding increase of α-form reflections, as depicted in Fig. 9A. In contrast, the 80[thin space (1/6-em)]:[thin space (1/6-em)]20 blend exhibits similar α-form reflection growth at 130 °C, but the Sc-form intensity remains constant in Fig. 9B. These results indicate that the α-form crystallization of pure PLLA matrix is accelerated by PLLA/PDLA nanoparticles with Sc-form modification as the nuclei.


image file: c5ra25688g-f9.tif
Fig. 9 Temperature dependences of the intensities of Sc- and α-form reflections with that of amorphous halo estimated from the series of the profiles depicted in Fig. 8. (A) Pure PLLA particles; (B) the 80[thin space (1/6-em)]:[thin space (1/6-em)]20 blend of pure PLLA matrix and PLLA/PDLA nanoparticles.

Next, the influence of the blending ratio on crystallization enhancement of PLLA/PDLA nanoparticles was estimated from the DSC cooling profiles. A series of blends of PLLA matrix with PLLA/PDLA nanoparticles ranging from 95[thin space (1/6-em)]:[thin space (1/6-em)]5 to 80[thin space (1/6-em)]:[thin space (1/6-em)]20 were melted at 200 °C for 5 min and subsequently cooled to room temperature at 5 °C min−1. The obtained DSC cooling profiles are compared in Fig. 10. For comparison, the data for pure PLLA nanoparticles is also included. All of the blends exhibit apparent crystallization exotherms, but their shapes depend on the blend ratio. The pure PLLA matrix exhibits a single peak at 93.8 °C. In contrast, double peaks are recognizable for the blends with PLLA/PDLA nanoparticles. The position of the lower-temperature exotherm is similar to that for the pure PLLA matrix, but the high-temperature-side exotherm is located at 110 °C. The latter exotherm grows with increasing blend ratios of the PLLA/PDLA nanoparticles. Here, it should be noted that the PLLA/PDLA nanoparticles crystallize into the Sc-form during pre-heating above the Tm of α-form, as depicted in Fig. 8. Therefore, the high-temperature exotherm is attributed to α-form crystallization of the PLLA matrix with Sc-form nuclei composed of PLLA/PDLA nanoparticles.


image file: c5ra25688g-f10.tif
Fig. 10 DSC thermograms of cooling for the blends with various ratios recorded at 5 °C min−1. Blending ratios of pure PLLA matrix and PLLA/PDLA nanoparticles were denoted in the figure. Before cooling, the samples were heated at 200 °C for 5 min, where pure PLLA matrix is melted but the PLLA/PDLA nanoparticles remain Sc-form crystals.

The potential of PLLA/PDLA nanoparticles as a nucleating agent was quantitatively evaluated from isothermal crystallization measurements of a blend of pure PLLA and PLLA/PDLA nanoparticles. In order to confirm the efficiency of the PLLA/PDLA nanoparticles as crystallization nuclei, a lower content is preferable for improved crystallization of pure PLLA matrix. Therefore, a relatively low blend ratio of 90[thin space (1/6-em)]:[thin space (1/6-em)]10 was targeted in these isothermal crystallization experiments. Fig. 11 compares the DSC profiles for isothermal crystallization at a constant temperature ranging from 110 to 140 °C. For comparison, another 90[thin space (1/6-em)]:[thin space (1/6-em)]10 blend was precipitated with the PLLA/PDLA suspension prepared by direct pouring into methanol without passing through a nanoporous membrane (C). A comparison with the 90[thin space (1/6-em)]:[thin space (1/6-em)]10 blend with PLLA/PDLA nanoparticles (B) allow us evaluate the effect of the Sc-form nanoparticles on matrix PLLA crystallization. Here, it should be noted that the PLLA/PDLA nanoparticles in Fig. 11B were prepared from 50/50 solution, which is the standard nanoparticle preparation condition in this study.


image file: c5ra25688g-f11.tif
Fig. 11 DSC thermograms recorded during isothermal crystallization of pure PLLA (A) and blend of PLLA matrix with the PLLA/PDLA nano-particles at the weight ratio 90[thin space (1/6-em)]:[thin space (1/6-em)]10 (B). For comparison, the other 90[thin space (1/6-em)]:[thin space (1/6-em)]10 blend with the PLLA/PDLA suspension prepared by direct pouring into methanol was also tested (C).

All of the samples were melted at 200 °C and subsequently cooled at 5 °C min−1 to the given crystallization temperature. With increasing crystallization temperature, the endotherm becomes broader and its peak position shifts to a longer time. When these endotherms are compared at the same crystallization temperature of 130 °C, the endotherm of pure PLLA is the broadest and is located at the longest time (A). In contrast, the 90[thin space (1/6-em)]:[thin space (1/6-em)]10 blend with PLLA/PDLA nanoparticles exhibits the sharpest endotherm at the shortest time (B). Both the endotherm shape and position are medium for the other 90[thin space (1/6-em)]:[thin space (1/6-em)]10 blend with the PLLA/PDLA suspension prepared by direct pouring into methanol (C). These results suggest that PLLA/PDLA nanoparticles effectively shorten the time required for isothermal crystallization of pure PLLA matrix, compared to that obtained from a conventional solution-crystallized blend of PLLA/PDLA.

Detailed analyses were performed by integrating these DSC profiles, as depicted in Fig. S4 (ESI). The half time for full crystallization (t1/2) can be estimated from these integrated curves and is plotted as a function of the crystallization temperature in Fig. 12. Beyond 120 °C, t1/2 rapidly increases with increasing crystallization temperature for all the sample. However, the lowest value at any given temperature is always obtained for the 90[thin space (1/6-em)]:[thin space (1/6-em)]10 blend with the PLLA/PDLA nanoparticles. These integrated profiles were further analyzed assuming the following Avrami equation:50

 
X = 1 − exp(−ktn) (1)
where, X is the relative crystallinity, k is the crystallization rate constant, t is the time in minutes, and n is the Avrami exponent. Eqn (1) can be transformed into the following formula.
 
ln[−ln(1 − X)] = ln[thin space (1/6-em)]k + n[thin space (1/6-em)]ln[thin space (1/6-em)]t (2)


image file: c5ra25688g-f12.tif
Fig. 12 Comparison of the t1/2 values estimated for pure PLLA (A), and 90[thin space (1/6-em)]:[thin space (1/6-em)]10 blends of PLLA matrix with the PLLA/PDLA nanoparticles (B) and with the PLLA/PDLA suspension prepared by direct pouring into methanol (C).

When the value of ln[−ln(1 − X)] is plotted as a function of ln[thin space (1/6-em)]t, the inclination and intercept of the line estimated by the least-square method indicate the n and k values. Fig. 13 compares the Avrami plots for pure PLLA matrix (A) and a 90[thin space (1/6-em)]:[thin space (1/6-em)]10 blend with the PLLA/PDLA nanoparticles (B). For comparison, the other 90[thin space (1/6-em)]:[thin space (1/6-em)]10 blend was precipitated with the PLLA/PDLA suspension prepared by direct pouring into methanol without passing through a nanoporous membrane (C). The former n value was almost 3 for all the samples, independent of crystallization temperature, indicating conventional three-dimensional growth of the crystals. The obtained k values are compared in Table S1 (ESI). The apparent highest k values are obtained for the 90[thin space (1/6-em)]:[thin space (1/6-em)]10 blend with PLLA/PDLA nanoparticles below 130 °C. This means that PLLA/PDLA nanoparticles are especially effective as crystallization nuclei for pure PLLA matrix at higher temperatures, where pure PLLA alone takes a longer time for crystallization. Here, the effect of α-form particles on matrix PLLA crystallization has been discussed,43 but that for Sc-form nanoparticles has not been experimentally proved although the higher efficiency of the latter case is expected for Sc-form nanoparticles prepared by spray drying method.47


image file: c5ra25688g-f13.tif
Fig. 13 Avrami plots for isothermal crystallization of pure PLLA (A), and 90[thin space (1/6-em)]:[thin space (1/6-em)]10 blends of PLLA matrix with the PLLA/PDLA nanoparticles (B) and with the PLLA/PDLA suspension prepared by direct pouring into methanol (C).

In the case of nanoparticle preparation method depicted in Fig. 4B, the nanoparticles of the other crystalline polymers are obtainable using porous membranes. However, the PLLA/PDLA nanoparticle particularly contributes to pure PLA composite without conventional organic or inorganic nucleating agents. PLA is biomass-based and biocompatible material, thus widely applicable for food packaging or medical materials, which prefer pure PLA composite. Our PLLA/PDLA nanoparticle opens the door for such applications of pure PLA composites.

Conclusions

Passing a PLLA/PDLA chloroform solution through a porous PTFE filter into methanol yields nanoparticles of homogeneous size, depending on the permeation rate. Such PLLA/PDLA nanoparticles contain Sc-form and α-form crystals, as revealed by X-ray measurements. In situ measurements during heating of the nanoparticles reveal a combination of α-form melting and subsequent Sc-crystallization above 150 °C, resulting in Sc-form nanoparticles. In other words, the as-prepared PLLA/PDLA nanoparticles contains α-form crystals, but the later annealing gives cold-crystallization of molten α-form crystals into pure Sc-form nanoparticles, which are desirable as nucleating agent for PLLA matrix crystallization. In order to evaluate such effect as crystallization nuclei, a small amount of PLLA/PDLA nanoparticles was blended with the PLLA matrix. This blend was heated above the Tm of α-form crystals and then cooled in a DSC cell. The crystallization temperature increased to 15 °C higher than that for pure PLLA. The isothermal crystallization also reveals that a blend with PLLA/PDLA nanoparticles remarkably shortens the crystallization time of pure PLLA matrix.

Acknowledgements

This work was financially supported by the Hosokawa Powder Technology Foundation.

Notes and references

  1. S. Fiori, in Poly(lactic acid) Science and Technology: Processing, Properties, Additives and Applications, ed. A. Jiménez, M. Peltzer and R. Ruseckaite, RSC publishing, Cambridge, 2015, ch. 13, pp. 315–333 Search PubMed.
  2. Y. Ikada, K. Jamshidi, H. Tsuji and S. H. Hyon, Macromolecules, 1987, 20, 904 CrossRef CAS.
  3. H. Tsuji, S. H. Hyon and Y. Ikada, Macromolecules, 1991, 24, 5651 CrossRef CAS.
  4. H. Tsuji, S. H. Hyon and Y. Ikada, Macromolecules, 1991, 24, 5657 CrossRef CAS.
  5. H. Tsuji and Y. Ikada, Macromolecules, 1993, 26, 6918 CrossRef CAS.
  6. H. Tsuji and Y. Ikada, Polymer, 1999, 40, 6699 CrossRef CAS.
  7. W. K. Lee, T. Iwata and J. A. Gardella Jr, Langmuir, 2005, 21, 11180 CrossRef CAS PubMed.
  8. D. Ishii, T. H. Ying, A. Mahara, S. Murakami, T. Yamaoka, W. K. Le and T. Iwata, Biomacromolecules, 2009, 10, 237 CrossRef CAS PubMed.
  9. H. Ajiro, Y. J. Hsiao, T. H. Thi, T. Fujiwara and M. Akashi, Chem. Commun., 2012, 48, 8478 RSC.
  10. M. Kakiage, T. Ichikawa, T. Yamanobe, H. Uehara and D. Sawai, ACS Appl. Mater. Interfaces, 2010, 2, 633 CAS.
  11. H. Uehara, Y. Karaki, S. Wada and T. Yamanobe, ACS Appl. Mater. Interfaces, 2010, 2, 2707 CAS.
  12. X. Hou, Q. Li and A. Cao, Macromol. Chem. Phys., 2013, 214, 1569 CrossRef CAS.
  13. M. Nakajima, H. Nakajima, T. Fujiwara, Y. Kimura and S. Sasaki, Langmuir, 2014, 30, 14030 CrossRef CAS PubMed.
  14. Q. Chen, J. Wang and L. Shao, Macromol. Rapid Commun., 2013, 34, 1850 CrossRef CAS PubMed.
  15. T. Watanabe, Y. Kimura and T. Ono, Langmuir, 2013, 29, 14082 CrossRef CAS PubMed.
  16. T. Watanabe, C. G. Lopez, J. F. Douglas, T. Ono and J. T. Cabral, Langmuir, 2014, 30, 2470 CrossRef CAS PubMed.
  17. N. Visaveliya and J. M. Köhler, Langmuir, 2014, 30, 12180 CrossRef CAS PubMed.
  18. M. J. Zhang, W. Wang, X. L. Yang, B. Ma, Y. M. Liu, R. Xie, X. J. Ju, Z. Liu and L. Y. Chu, ACS Appl. Mater. Interfaces, 2015, 7, 13758 CAS.
  19. N. G. Min, B. Kim, T. Y. Lee, D. Kim, D. C. Lee and S. H. Kim, Langmuir, 2015, 31, 937 CrossRef CAS PubMed.
  20. M. J. Robb, L. A. Connal, B. F. Lee, N. A. Lynda and C. J. Hawker, Polym. Chem., 2012, 3, 1618 RSC.
  21. A. Z. Chen, C. Zhao, S. B. Wang, Y. G. Liu and D. L. Lin, J. Mater. Chem. B, 2013, 1, 2967 RSC.
  22. R. Dorresteijn, R. Ragg, G. Rago, N. Billecke, M. Bonn, S. H. Parekh, G. Battagliarin, K. Peneva, M. Wagner, M. Klapper and K. Mullen, Biomacromolecules, 2013, 14, 1572 CrossRef CAS PubMed.
  23. Y. Hu, V. Darcos, S. Monge, S. Li, Y. Zhou and F. Su, J. Mater. Chem. B, 2014, 2, 2738 RSC.
  24. L. Dai, T. Yang, J. He, L. Deng, J. Liu, L. Wang, J. Lei and L. Wang, J. Mater. Chem. B, 2014, 2, 6749 RSC.
  25. A. R. Fajardo, A. Guerry, E. A. Britta, C. V. Nakamura, E. C. Muniz, R. Borsali and S. Halila, Biomacromolecules, 2014, 15, 2691 CrossRef CAS PubMed.
  26. N. R. Ko and J. K. Oh, Biomacromolecules, 2014, 15, 3180 CrossRef CAS PubMed.
  27. R. Dorresteijn, N. Billecke, M. Schwendy, S. Pütz, M. Bonn, S. H. Parekh, M. Klapper and K. Müllen, Adv. Funct. Mater., 2014, 24, 4026 CrossRef CAS.
  28. I. Armentano, N. Bitinis, E. Fortunati, S. Mattioli, N. Rescignano, R. Verdejo, M. A. Lopez-Manchado and J. M. Kenny, Prog. Polym. Sci., 2013, 38, 1720 CrossRef CAS.
  29. K. S. Tücking, V. Grützner, R. E. Unger and H. Schönherr, Macromol. Rapid Commun., 2015, 36, 1248 CrossRef PubMed.
  30. J. Olejniczak, M. Chan and A. Almutairi, Macromolecules, 2015, 48, 3166 CrossRef CAS.
  31. V. Beer, K. Koynov, W. Steffen, K. Landfester and A. Musyanovych, Macromol. Chem. Phys., 2015, 216, 1774 CrossRef CAS.
  32. R. Androsch and M. L. Di Lorenzo, Macromolecules, 2013, 46, 6048 CrossRef CAS.
  33. G. Liu, X. Zhang and D. Wang, Adv. Mater., 2014, 26, 6905 CrossRef CAS PubMed.
  34. P. Chen, Y. Wang, T. Wei, Z. Meng, X. Jia and K. Xi, J. Mater. Chem. A, 2013, 1, 9028 CAS.
  35. M. Naffakh, C. Marco and G. Ellis, CrystEngComm, 2014, 16, 5062 RSC.
  36. H. Zhao, Y. Bian, M. Xu, C. Han, Y. Li, Q. Dong and L. Dong, CrystEngComm, 2014, 16, 3896 RSC.
  37. H. Liu, D. Bai, H. Bai, Q. Zhang and Q. Fu, J. Mater. Chem. A, 2015, 3, 13835 CAS.
  38. J. Li, P. Xiao, H. Li, Y. Zhang, F. Xue, B. Luo, S. Huang, Y. Shang, H. Wen, J. d. C. Christiansen, D. Yu and S. Jiang, Polym. Chem., 2015, 6, 3988 RSC.
  39. H. Bai, C. Huang, H. Xiu, Q. Zhang and Q. Fu, Polymer, 2014, 55, 6924 CrossRef CAS.
  40. Q. Xing, R. Li, X. Dong, F. Luo, X. Kuang, D. Wang and L. Zhang, Macromol. Chem. Phys., 2015, 216, 1134 CrossRef CAS.
  41. R. Mincheva, Ph. Leclère, Y. Habibi, J. M. Raqueza and P. Dubois, J. Mater. Chem. A, 2014, 2, 7402 CAS.
  42. X. F. Wei, R. Y. Bao, L. Gu, Y. Wang, K. Ke, W. Yang, B. H. Xie, M. B. Yang, T. Zhou and A. M. Zhang, RSC Adv., 2014, 4, 2733 RSC.
  43. H.-Y. Yin, X.-F. Wei, R.-Y. Bao, Q.-X. Dong, Z.-Y. Liu, W. Yang, B.-H. Xie and M.-B. Yanga, CrystEngComm, 2015, 17, 4334 RSC.
  44. X.-F. Wei, R.-Y. Bao, Z.-Q. Cao, W. Yang, B.-H. Xie and M.-B. Yang, Macromolecules, 2014, 47, 1439 CrossRef CAS.
  45. W. Huang, X.-Z. Luo, B.-J. Wang, W.-F. Wei, P. Chen, Q. Gu, S. de Vos, R. Y. Wang and C. A. P. Joziasse, Macromol. Chem. Phys., 2015, 216, 1120 CrossRef CAS.
  46. V. Arias, K. Odelius and A.-C. Albertsson, Macromol. Rapid Commun., 2014, 35, 1949 CrossRef CAS PubMed.
  47. V. Arias, K. Odelius, A. Höglund and A.-C. Albertsson, ACS Sustainable Chem. Eng., 2015, 3, 2220 CrossRef CAS PubMed.
  48. P. Pan, L. Han, J. Bao, Q. Xie, G. Shan and Y. Bao, J. Phys. Chem. B, 2015, 119, 6462 CrossRef CAS PubMed.
  49. M. Fujita, T. Sawayanagi, H. Abe, T. Tanaka, T. Iwata, K. Ito, T. Fujisawa and M. Maeda, Macromolecules, 2008, 41, 2852 CrossRef CAS.
  50. R.-Y. Bao, W. Yang, W.-R. Jiang, Z.-Y. Liu, B.-H. Xie and M.-B. Yang, J. Phys. Chem. B, 2013, 117, 3667 CrossRef CAS PubMed.

Footnote

Electronic supplementary information (ESI) available: SEM images of porous membranes and prepared particles, and isothermal crystallization analyses of prepared particles. See DOI: 10.1039/c5ra25688g

This journal is © The Royal Society of Chemistry 2016
Click here to see how this site uses Cookies. View our privacy policy here.