Comparative efficiency of TiO2 nanoparticles in suspension vs. immobilization into P(VDF–TrFE) porous membranes†
P. M. Martinsa,
R. Mirandaa,
J. Marquesa,
Carlos. J. Tavaresa,
G. Botelhob and
S. Lanceros-Mendez*ac
aCentro/Departamento de Física, Universidade do Minho, 4710-057 Braga, Portugal. E-mail: lanceros@fisica.uminho.pt
bCentro/Departamento de Química, Universidade do Minho, 4710-057 Braga, Portugal
cBCMaterials, Parque Científico y Tecnológico de Bizkaia, 48160-Derio, Spain
First published on 26th January 2016
Abstract
Photocatalytic processes based on titanium dioxide (TiO2) nanoparticles have attracted increasing attention in the last decades. However, approaches based on nanoparticles show some drawbacks, in particular due to the need for expensive and time consuming post-treatment of nanoparticles filtration/separation. This hindrance demands the development of immobilized configurations with tailored properties, as an alternative to allow simple recovery of the photocatalytic particles. Thus, this work reports on the development of photocatalytic membranes based on TiO2 nanoparticles immobilized into a poly(vinylidenefluoride–trifluoroethylene) (P(VDF–TrFE)) membrane and the comparative study of their performance with dispersed TiO2 nanoparticles. Photocatalytic nanocomposite membranes with a highly porous structure (∼75%) and controlled wettability by NaY addition were successfully produced. These properties were paramount to achieve a methylene blue degradation efficiency of 96% in 40 min under ultraviolet (UV) irradiation, corresponding to an efficiency loss of just 3% regarding the TiO2 nanoparticle assays.
1. Introduction
Photocatalysis has become an attractive process to remove contaminants from aquatic environments.1 Generally, photocatalysis occurs when a catalyst is irradiated with UV light and produces electron–hole pairs which react with H2O, OH− and O2 to generate highly oxidizing species, usually the hydroxyl radical (˙OH), superoxide radical anions (O2˙−) and hydrogen peroxide (H2O2). These species will subsequently begin a cascade of redox reactions leading to decomposition of organics into CO2, H2O, among other harmless compounds.2,3 Several photocatalysts such as Si, BiOBr, BiFeO3, CuS, WSe2, WO3, Fe2O3, ZnO and TiO2 have been tested with this objective.4,5 Among these materials, titanium dioxide (TiO2) is the most widely used one for degradation of organic pollutants, mainly due to its physical and chemical stability, non-toxicity, superhydrophilicity, abundance, low cost, and remarkable reactivity under UV light irradiation (λ > 390 nm).6–8 The application of TiO2 as a photocatalyst, usually occurs in two forms: in suspension and immobilized on solid materials.The increasing use of TiO2 powder in suspension and its efficiency is mainly related to the nanoparticles large surface area, porosity and proximity between nanoparticle surface and pollutant species, promoting a large mass transfer process.9
In spite of the advantages of the photocatalytic process with TiO2 nanoparticles in suspension, some important problems arise, namely the recuperation of these nanoparticles from the suspension before treated water is reused. This separation is a time consuming step and demands an expensive downstream filtering post-treatment, preventing a widespread use of this system.10,11 In this way, several approaches have been tested to overcome these hindrances, namely the immobilization of TiO2 nanoparticles into solid substrates.2 The problems to be overcome with this possible solution are the loss of surface area, partial loss of TiO2 and mass transfer limitations linked to this configuration.12 Several substrates have been tested as TiO2 support for degradation of water pollutants. Materials such as sand, paper, quartz, wool, pyrex, cement beads and steel mesh have been thus coated or functionalized with TiO2.13 Alternatively, more complex structures such as glass fibre/beads, ceramic membranes, pumice stones, zeolites, and alumina clays were also tested.13,14 Recently, some attention has been paid to polymers such as nylon-6, polyester, polyamide-6, cellulose, high density polyethylene, chitosan and polyvinylidene fluoride.14–16 Conversely, several techniques such as dip coating,17 chemical vapor deposition,18 electrospinning19 and electrophoretic deposition20 have been employed for the immobilization of TiO2 nanoparticles. Many of these photocatalytic substrates lack to satisfy some criteria required for photocatalytic applications such as strong adhesion of nanoparticles to the substrate, catalyst reactivity after attachment process, high surface area and strong adsorption affinity to the pollutant.14 In this connection, in spite of the many materials and techniques evaluated, with some encouraging results, the immobilization of TiO2 nanoparticles remain a challenge as the aforementioned hurdles are not completely overcome and the main application requirements are not satisfied. Additionally such drawbacks become even more important regarding large scale applications (e.g. photocatalytic reactors).21 With this respect, we propose poly(vinylidenefluoride–trifluoroethylene) (P(VDF–TrFE)) as a substrate to immobilize TiO2 nanoparticles. This fluorinated copolymer allows the production of membranes with controlled porosity and pore size.22,23 Moreover, physicochemical properties of fluorinated polymers are suitable for the intended application as they show excellent UV radiation, chemical, mechanical and thermal resistance, related to the stable C–F bonds of the polymer chain.24–26 Furthermore, TiO2/P(VDF–TrFE) nanocomposite membranes have been successfully produced with demonstrated photocatalytic activity in the degradation of methylene blue (MB). One of the problems associated to P(VDF–TrFE) is its low hydrophilicity.27 In order to tailor nanocomposite membranes wettability, zeolites (NaY) can be incorporated into the P(VDF–TrFE) matrix. Zeolites are classified as highly hydrophilic and porous structures, which makes them good adsorbents.28,29 These properties are essential to allow a proper interaction between pollutant and the polymeric substrate where TiO2 nanoparticles are immobilized.
Thus, the main goal of this work is to compare and quantify the efficiency of photocatalytic TiO2 nanoparticles in suspension and immobilized into a P(VDF–TrFE) porous membrane. Additionally, it is also shown how the inclusion of NaY to tailor the wettability of the membrane influences its photocatalytic performance.
2. Experiments
2.1. Membranes production
Poly(vinylidenefluoride-co-trifluoroethylene), P(VDF–TrFE) (Solvay 70![[thin space (1/6-em)]](https://www.rsc.org/images/entities/char_2009.gif) :
:![[thin space (1/6-em)]](https://www.rsc.org/images/entities/char_2009.gif) 30) composite membranes with 3, 5 an 8% wt of both TiO2 (P25, supplied by EVONIK industries) nanoparticles and zeolites (NaY, Zeolyst International) were prepared by solvent casting (Table 1).
30) composite membranes with 3, 5 an 8% wt of both TiO2 (P25, supplied by EVONIK industries) nanoparticles and zeolites (NaY, Zeolyst International) were prepared by solvent casting (Table 1).
| P(VDF–TrFE) membranes | m (NaY) (g) | m (TiO2) (g) |
|---|---|---|
| P(VDF–TrFE) | — | — |
| 3% TiO2 | — | 0.030 |
| 5% TiO2 | — | 0.052 |
| 8% TiO2 | — | 0.087 |
3% NaY![[thin space (1/6-em)]](https://www.rsc.org/images/entities/char_2009.gif) : :![[thin space (1/6-em)]](https://www.rsc.org/images/entities/char_2009.gif) 8% TiO2 8% TiO2 |
0.030 | 0.087 |
5% NaY![[thin space (1/6-em)]](https://www.rsc.org/images/entities/char_2009.gif) : :![[thin space (1/6-em)]](https://www.rsc.org/images/entities/char_2009.gif) 8% TiO2 8% TiO2 |
0.052 | 0.087 |
8% NaY![[thin space (1/6-em)]](https://www.rsc.org/images/entities/char_2009.gif) : :![[thin space (1/6-em)]](https://www.rsc.org/images/entities/char_2009.gif) 8% TiO2 8% TiO2 |
0.087 | 0.087 |
The filler contents were selected in a range of concentration that avoids nanoparticle agglomeration and detachment from the polymer matrix, and leads to a homogenous microstructure preserving the suitable mechanical properties of the polymer membrane required for this application.22
To produce nanocomposite membranes, zeolites and/or nanoparticles in the desired amount were added first to 9.5 mL of N,N-dimethylformamide (DMF, from Merck). The solution was sonicated for 4 hours in order to achieve a good dispersion. Afterwards, 1 g of the co-polymer was added to the solution, to obtain a polymer concentration of 10% wt, and kept under magnetic stirring until complete polymer dissolution. Later, the solution was placed in a glass Petri dish and the DMF solvent evaporated at room temperature, which was demonstrated previously that results in a porous structure.23
2.2. Nanoparticle and membrane characterization
The crystal structure, purity and degree of crystallinity of the commercial nanoparticles was evaluated by X-ray diffraction, XRD, measurements in a Ryugaku/Max System RU 300.The optical properties of the nanoparticle powder were measured by UV-vis absorption spectroscopy with a Jasco V-670 spectrophotometer coupled with an integrating sphere.
The average hydrodynamic diameter and zeta potentials of the nanoparticles were measured by Dynamic Light Scattering (DLS) in a Zetasizer NANO ZS-ZEN3600, Malvern (Malvern Instruments Limited, UK), equipped with a He–Ne laser (wavelength 633 nm) and a detection angle of 173° (backscatter detection). Hydrodynamic diameter was assessed by 6 measurements performed at 25 °C dispersing TiO2 nanoparticles in ultra-pure water (0.1 mg L−1) to avoid multi-scattering events. The zeta (ζ) potential of TiO2 nanoparticles was evaluated at different pHs (2, 4, 7, 9 and 12). Solutions of HCl (1 M) and NaOH (1 M) were added to adjust the pH. The average value and standard deviation for each sample was obtained from 10 measurements at 25 °C. The results were obtained using the Smoluchowski theory approximation. Zetasizer 6.20 software was used to estimate particle mean diameter from the intensity distributions (zeta-average), the polydispersity index (PDI) and ζ-potential values.
The porosity of the nanocomposite membranes was estimated with a pycnometer, using eqn (1). In a first step, the weight of the pycnometer, filled with ethanol, was measured and labeled W1; the sample, whose weight was Ws, was then immersed in ethanol. After the sample was saturated by ethanol, additional ethanol was added to complete the volume of the pycnometer, weighted and labeled as W2. Then, the sample filled with ethanol was taken out of the pycnometer and the residual weight of the ethanol was labeled as W3.
 | (1) |
This procedure was repeated three times for each sample and the obtained values corresponds to the average.
The morphology of the TiO2/P(VDF–TrFE) samples was evaluated by scanning electron microscopy (SEM) with a Quanta 650 from FEI Scanning Electron Microscope at a measured voltage of 10 kV. Previous to examination, the samples were coated with a thin gold layer by using a Fisons Instruments SC502 sputter coater.
The polymer phase content was obtained from the infrared spectra obtained by Fourier transformed infrared spectroscopy (FTIR) in attenuated total reflectance mode (ATR) in a FTIR Alpha-Bruker apparatus over a range of 650–4000 cm−1 using 64 scans and a resolution of 4 cm−1.
The wettability of the samples was assessed by measuring the contact angle of distilled water at 22 °C, using an OCA15 Dataphysics contact angle analyzer. Five measurements were carried out for each sample at different places. Surface free energy (γp) values were estimated using an adaptation of Young–Dupre eqn (2):
 | (2) |
2.3. Photocatalytic activity
Photocatalytic oxidation of a MB solution by TiO2 nanoparticles in suspension and immobilized into P(VDF–TrFE) membranes, under UV irradiation, was used to evaluate the photocatalytic efficiency of both systems.For the sake of comparison of the obtained efficiency, the same MB aqueous solution of 10−5 M at pH = 6.8 was used for assays with suspended and immobilized TiO2 nanoparticles. Additionally, before the degradation tests, suspended TiO2 nanoparticles and membranes with immobilized nanoparticles and zeolites were first immersed in the MB aqueous solution for 30 min in the dark, to allow the complete dye adsorption–desorption. The suspension tests were performed in a 100 mL beaker with 3.3 mm thickness and 5 cm of diameter. Tests with 5, 10, 20, 40 and 60 mg of TiO2 nanoparticles were performed. The degradation experiments were carried out placing nanoparticles in the MB solution under magnetic stirring and UV-A radiation. The beaker was positioned at 10 cm from 6 lamps (Phillips 8 W), with an excitation peak at 365 nm. The UV intensity ranged from 3.6 to 3.8 mW cm−2, as measured with a UV34 lux meter. To analyze the MB degradation, aliquots were withdrawn at different times during the assay. All the samples were centrifuged using an EBA 21 from Hettich for 30 min at 36![[thin space (1/6-em)]](https://www.rsc.org/images/entities/char_2009.gif) 220 rcf's, and then analyzed with a UV-Vis Shimadzu 2501 PC. Degradation of MB was assessed by monitoring the decrease of the 663 nm absorption peak.32
220 rcf's, and then analyzed with a UV-Vis Shimadzu 2501 PC. Degradation of MB was assessed by monitoring the decrease of the 663 nm absorption peak.32
Concerning immobilized TiO2 nanoparticles, 12 cm2 samples of the photocatalytic TiO2/P(VDF–TrFE) and NaY/TiO2/P(VDF–TrFE) nanocomposites were immersed in a quartz cuvette (1 cm path optical) with 13 mL of MB solution (10−5). The quartz cell was then irradiated with a high power LED source (Thorlabs, 700 mA) with an excitation peak at 365 nm (UV-A). The incident radiation over the sample was measured with a Delta Ohm irradiance meter and the average values were around 4 mW cm−2.33 The absorbance of the MB was monitored at intervals of 2 min using a spectrophotometer (ScanSpec UV-Vis, ScanSci) in the range of 300–900 nm. The rate of photodegradation of MB was analyzed by monitoring the intensity variation of the main absorption peak at 663 nm.
The MB degradation in aqueous solution fits to a pseudo-first-order reaction, Langmuir–Hinshelwood model, which can be expressed by eqn (3):34
 | (3) |
3. Results and discussion
3.1. Nanoparticle characterization
The P25–TiO2 commercial nanoparticles were analyzed by SEM. The images (not shown) allowed to estimate a particle size of ∼30 nm from a statistics of 50 nanoparticles per micrograph. The crystal structure and purity of the nanoparticles were studied by X-ray diffraction (not shown). The samples show diffraction peaks at 25.3, 37.8, 48.0, 53.9, 55.1, and 62.7°, which are ascribed to the anatase crystalline structure. Further, the diffractogram also show 2θ values of rutile phase, for instance of 27.4, 36.1 and 41.2°.35 SEM and XRD results are in agreement with the data sheet provided by the manufacturer.Regarding TiO2 nanoparticles hydrodynamic size, results obtained by DLS show a Z-average diameter of 430 ± 28 nm (Fig. 1) and average PDI of 0.45 ± 0.040. In a related work, hydrodynamic sizes around 600 nm were obtained through DLS measurements.9 The difference between DLS and SEM nanoparticles sizes can be explained by the agglomeration of the nanoparticles in aqueous media and due to the presence of clusters with different sizes. Agglomerated nanoparticles show a smaller diffusion rate than isolated particles and thus the diameter of the nanoparticles obtained by DLS is larger than the one assessed by other techniques.36
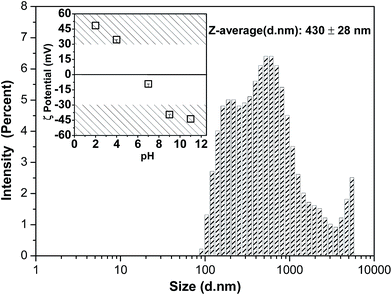 | ||
| Fig. 1 Dynamic light scattering (DLS) size distribution of P25–TiO2 nanoparticles at room temperature; inset room temperature zeta (ζ)-potential of TiO2 nanoparticles at pH of 2; 4; 7; 9 and 11. | ||
With respect to ζ-potential measurements (Fig. 1 inset), the results show that TiO2 nanoparticles are more stable at pH above 8 or below 4. In these pH ranges, ζ-potential values are higher than |30| mV, which means that nanoparticles show higher peripheral charge values, contributing for nanoparticle repulsion and thus larger stability, preventing aggregation and precipitation. Furthermore, these results are in agreement with previous works,37,38 which indicates that at pH = 6.8 the TiO2 net charge is 0, at pH < 6.8 TiO2 is positively charged and at pH > 6.8 TiO2 is negatively charged. Zeta potential measurements are relevant for the intended application as the adsorption of molecules into nanoparticles surface is pH dependent.39 If TiO2 nanoparticles and the pollutant/dye exhibit opposite charges, favorable electrostatic interaction will promote adsorption and enhanced photocatalytic activity.
3.2. Nanocomposites characterization
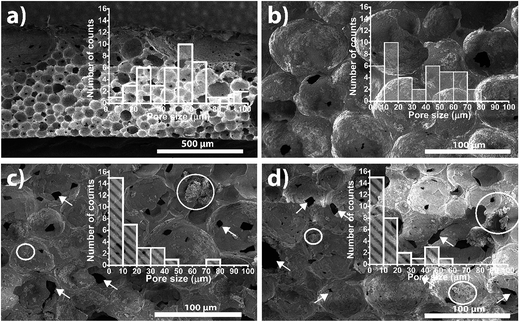
TiO2 nanoparticles were successfully immobilized in the P(VDF–TrFE) porous membranes produced by solvent evaporation at room temperature. SEM cross-section images (Fig. 2) show the polymer microstructure of the produced membranes, all presenting spherical pores independently of the TiO2 content. Further, TiO2 nanoparticles are well dispersed within the porous structure of the membrane, just with few aggregates in the inner pore walls.The TiO2/P(VDF–TrFE) nanocomposites functionalized with varying zeolite content (Fig. 2c and d) also reveals a microporous structure similar to the pristine and TiO2 nanocomposite samples. Noticeably, pore interconnectivity seems to increase through small pores within the walls of the larger pores, as depicted with the arrows in the micrographs. With respect to filler dispersion, the sample with 3% NaY (ESI†) shows a good dispersion of the zeolites along the pores, in contrast with samples loaded with 5 and 8% zeolite content that exhibit large amount of aggregates over the pore walls. This is in good agreement with previous studies indicating that zeolites remain in the pore walls instead of being integrated in the polymer structure, which is attributed to their own porous structure, leading to solvent absorption and influencing the phase separation process.22
Furthermore, the pores within the membranes with zeolites show a more heterogeneous microstructure with less defined forms (less spherical). These findings indicate that the incorporation of zeolites into the solution influence the phase diagram and crystallization dynamic of the polymer, which is essentially dictated by polymer/solvent initial ratio and solvent evaporation temperature.23
The main parameters quantifying the porous microstructure of the membranes are shown in Fig. 3. Thus, pore size and degree of porosity depend on TiO2 and NaY contents in a different way. Regarding pore size for pristine polymer and samples containing TiO2 nanoparticles, no significant differences were observed, with pores ranging from 51 to 62 μm. However, when zeolites are added to the samples, the pore size strongly decreases to 24, 18 and 13 μm for samples with 3, 5 and 8% NaY content, respectively. Furthermore, the degree of porosity remains also nearly constant with the inclusion of the TiO2 nanoparticles, in the range of 73–79%. On the other hand, when zeolites are added to the membrane, the degree of porosity strongly increases to 89 and 97%, for 3% and 8% NaY filler contents, respectively. It is important to notice that, in samples with zeolites, porosity measurements does not represent only membrane porosity, but also includes the contribution of the porosity of the zeolites. The decrease of the average pore size and the increase of the overall porosity are indicative of the strong influence of the zeolites on the phase diagram and the crystallization process, acting as nucleation elements for polymer crystallization and hindering barriers for the phase separation process, thus leading to a higher number of smaller pores (arrows in Fig. 2c and d). The histograms of Fig. 2 shows a shift regarding the prevalence of pores size. The histogram of Fig. 2b show a predominance of larger pores whereas Fig. 2c and d show a predominance of smaller pores.
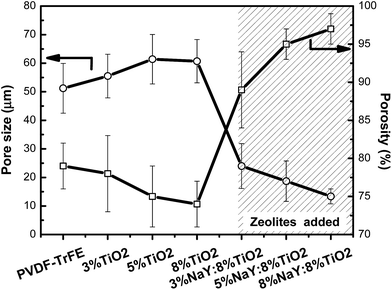 | ||
| Fig. 3 Estimated pore size (○) and average porosity (□) for pristine and nanocomposite membranes of P(VDF–TrFE) with different amounts of TiO2 and NaY. | ||
For the intended application, connectivity of pores enhances light penetration and increases mass transfer of pollutants for photocatalysis.40 On the other hand, it should be noted that the small size of the TiO2 nanofillers leads to no significant effect in the phase separation process and therefore on the final membrane microstructure.
Finally, it is worth noticing that the produced samples show a suitable porous structure appropriate for pollutant diffusion onto the TiO2 nanoparticles within pore walls.41
Infrared spectroscopy (FTIR) was used to determine polymer phase content and the possible chemical interaction between fillers and polymer matrix. In Fig. 4, FTIR spectra show that TiO2/P(VDF–TrFE) composites show unchanged polymer structure with respect to the pristine polymer, independently of the filler content. In particular, bands at 840, 1288 and 1400 cm−1 show that the polymer crystallizes in the all-trans piezoelectric β-phase.42,43 The polymer phase remains unchanged when TiO2 and zeolite are present in the membranes (Fig. 4). Further, a new band around 900–1100 cm−1, assigned to the stretching vibration of Si–O bond, appears and increases with increasing zeolite content, indicative of the presence of zeolite in the membrane.44,45 In this way, filler content and type do not change the crystallization phase of the polymer, which crystallizes in the all-trans β-phase, and no chemical bonds are detected between polymer and fillers.
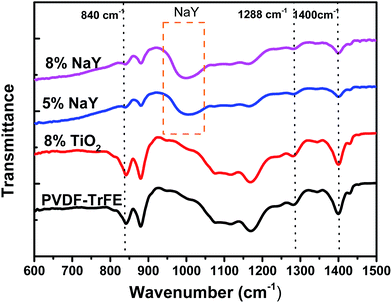 | ||
| Fig. 4 FTIR spectra of pristine P(VDF–TrFE) membrane, and nanocomposite membranes with 8% TiO2 and 8% TiO2 with 5 and 8% NaY. | ||
The wettability of the membranes was assessed by contact angle measurements. Fig. 5 shows the variation of the contact angle and surface energy with TiO2 and NaY filler content in the polymer membrane. Pristine polymer and samples with 3, 5 and 8% of TiO2 nanoparticles present contact angles of 76, 88, 96 and 97°, respectively, showing a clear increase of the contact angle with increasing amount of TiO2 nanoparticles. Regarding the estimated surface energy, values decrease from 27.9 mJ m−2 for the pristine PVDF–TrFE membrane to 13.87 mJ m−2 for the membrane containing 8% TiO2. These values are in the range of hydrophobic materials, with the characteristic low surface energy and low wettability.27 Contrarily, all samples containing NaY present high surface energy, 73 mJ m−2, which is typical of hydrophilic materials. Previous works already reported the hydrophobic nature of polymer nanocomposites containing TiO2 nanoparticles, as these particles only display hydrophilic behavior when irradiated with UV irradiation.46,47 On the other hand, the inclusion of zeolites into the membrane yields hydrophilic properties to the membrane and the water droplet completely spread in the membrane surface and is rapidly absorbed. The hydrophilic properties of these samples is attributed exclusively to the microporosity and capillary effect of the zeolites.48 Additionally, the increased irregularity on membrane surface caused by zeolites may also contribute for hydrophilicity of the membrane49 although this effect certainly plays a secondary role as the variation among membranes is not as significant as the water absorption capability introduced by the zeolites. Materials with increased wettability promote the contact between the pollutant and the surface of the TiO2 nanoparticles which is a key issue for improved photocatalytic performance.
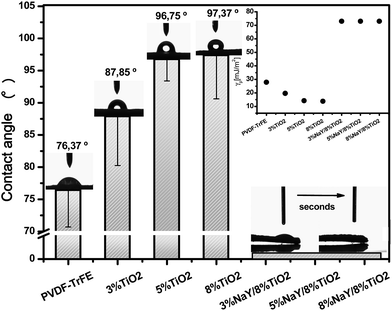 | ||
| Fig. 5 Contact angle measurements and inset the estimated surface free energy (γp) of P(VDF–TrFE) with different amounts of TiO2 and NaY. | ||
3.3. Photocatalytic activity evaluation
In order to compare photocatalytic efficiency of TiO2 nanoparticles in suspension and immobilized into P(VDF–TrFE) the evaluation of the maximum absorbance of MB, at 663 nm, was assessed.The photocatalytic assays in suspension were performed with different amounts of TiO2 nanoparticles in a constant volume of MB aqueous solution (Fig. 6). Trials with 5, 10 and 20 mg of nanoparticles in suspension show MB degradation efficiencies of 91.6, 96.8 and 99.9%, respectively (Table 2). Similarly, the 1st order rate constant values show estimated values of 0.056, 0.079 and 0.184 min−1 for assays with 5, 10 and 20 mg of nanoparticles, respectively.
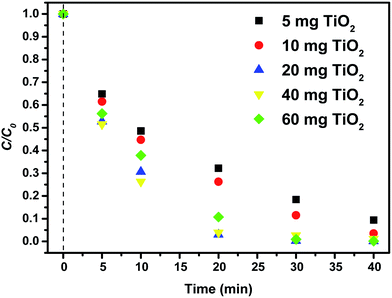 | ||
| Fig. 6 Methylene blue photocatalytic degradation performance as a function of time for different amounts of TiO2 nanoparticles in suspension. | ||
| m (mg) | Reaction rate (min−1) | Degradation (%) |
|---|---|---|
| 5 | 0.056 | 92 |
| 10 | 0.079 | 97 |
| 20 | 0.184 | 100 |
| 40 | 0.114 | 99 |
| 60 | 0.168 | 100 |
When higher amounts of TiO2 nanoparticles are used, the aforementioned trend no longer occurs. Using 40 and 60 mg of nanoparticles yields similar MB degradation efficiencies (99.8 to 99%), however the reaction rates decrease to 0.114 and 0.168 min−1, respectively. A large amount of nanoparticles speeds up nanoparticles aggregation process resulting in a loss of surface area, which is in good agreement with hydrodynamic size measurements performed by DLS, showing the formation of large agglomerates. Thus, the obtained results indicate that for the given conditions, 20 to 30 mg of nanoparticles is the optimum amount to achieve the highest photocatalytic degradation efficiency.
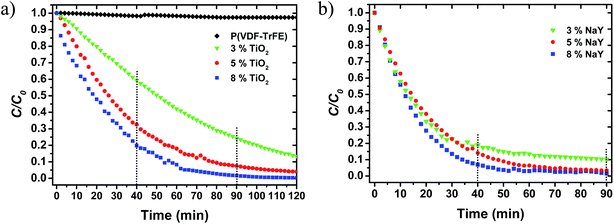
For the study of the photocatalytic activity for immobilized TiO2 nanoparticles two sets of measurements were performed. First, the photocatalytic activity of different amounts of immobilized nanoparticles (3, 5 and 8%) was tested. The results, shown in Fig. 7a and quantified in Table 3, indicate that the pristine P(VDF–TrFE) membrane does not show any photocatalytic activity, being the small absorbance decrease addressed to MB photodegradation and/or absorbance to the membrane. Additionally, for the same experimental conditions the reaction rate and photocatalytic degradation efficiency of MB increases with increasing amount of TiO2 nanoparticles. The degradation efficiency reaches 77 and 98%, for the membranes with 3 and 8% TiO2 nanoparticles, respectively.
| Samples | k (min−1) | Degradation (%) | |||
|---|---|---|---|---|---|
| 40 min | 90 min | 40 min | 90 min | ||
| 3% TiO2 | 0.029 | 0.018 | 49 | 77 | |
| 5% TiO2 | 0.013 | 0.026 | 76 | 93 | |
| 8% TiO2 | 0.037 | 0.037 | 86 | 99 | |
| 8% TiO2 | 3% NaY | 0.049 | 0.023 | 86 | 91 |
| 5% NaY | 0.045 | 0.04 | 91 | 99 | |
| 8% NaY | 0.069 | 0.033 | 96 | 96 | |
Once the nanocomposite membrane with the highest photocatalytic performance has been assessed, the potential effect of improvement of membrane wettability was addressed with the addition of different amounts of zeolites (3, 5 and 8%). The obtained results (Fig. 7b) indicate that the incorporation of zeolites into the nanocomposite slightly accelerate the initial adsorption of MB during the first 30 minutes under dark conditions for all the samples, when compared with the sample of P(VDF–TrFE) with 8% TiO2. With respect to 90 minutes of degradation, only the membranes with 5% NaY show better reaction rate and slightly higher degradation efficiency (99%) than the membrane with 8% TiO2. The remainder samples with zeolites show lower degradation values of MB and lower reaction rates than the sample with 8% TiO2. On the other hand, at 40 min of UV irradiation the influence of zeolite loading shows larger impact on the reaction rate and MB degradation efficiencies than at 90 min. Thus, for 40 minutes of UV irradiation, all the samples with zeolites present higher reaction rates, 0.049 up to 0.069 min−1, and higher degradation efficiencies, 86 up to 95.7%, regarding the sample of 8% TiO2 (0.037 min−1 and 85.7%). It is noteworthy to mention that for 90 minutes of degradation the rate constant and MB removal efficiency for the sample with 8% NaY are lower than the values for 5% NaY, indicating that for higher NaY filler contents, there is particle agglomeration, as supported by the SEM images. Particle agglomeration represents a decrease of the surface area, leading to lower photocatalytic activity efficiencies. Analysis of the results at both intervals of UV irradiation indicate that the main role of the zeolites is to accelerate the photocatalytic process through improved interaction of the aqueous MB solution with the nanoparticles exposed on the polymer matrix. This acceleration is in good agreement with the wettability results, which show hydrophilic behavior of samples with zeolites by opposition to the hydrophobic one in samples without zeolite. In general, hydrophilic materials allow for increased permeability to water.50,51 In this respect, hydrophilicity together with a highly interconnected porous structure, are responsible for a good diffusion of MB in the catalyst surface, allowing for a faster adsorption process to take place.
The use of MB to assess the photocatalytic activity of the materials is a standard procedure as it allows to evaluate and easily compare our results with the literature. Table 4 shows some results obtained using different polymer membranes with TiO2 used in MB photocatalytic degradation. In order to compare the results from different works, the different conditions used should be taken into account.
Concerning the comparison between suspended and immobilized TiO2 nanoparticles, it is important to refer that membranes with 3, 5 and 8% TiO2 were estimated to correspond to the assays with 20, 40 and 60 mg of TiO2 nanoparticles in suspension, respectively. As expected, the produced membranes do not show higher degradation efficiencies or reaction rates when compared with the suspension experiments. Thus, after 40 min of UV irradiation, membranes with TiO2 show degradation efficiencies from 49.1 (3% TiO2) to 85.7% (5% TiO2), when compared with efficiencies around 99% for the corresponding suspension trials. These results indicate an efficiency loss in the range of ∼50% for the membrane with 3% TiO2 to 13% in the sample with 8% TiO2, comparatively to the 20 and 60 mg suspension trials. As mentioned before, the immobilization of nanoparticles may tackle some of the mainstream problems of photocatalysis application but this configuration also hosts some undesirable features, which synergistically explain the obtained results. Therefore, one of the main problems relies in nanoparticles surface area loss and mass transfer limitations, caused by nanoparticles adherence to the substrate.52 Additionally, decrease in water permeability and inappropriate light harvesting may also hinder the photocatalytic performance. These drawbacks were already mitigated by the development of membranes with highly porous structure, good nanoparticles dispersion, attachment and non-degradation of catalyst properties during immobilization process.14 In this connection, membrane wettability was improved incorporating zeolites into the polymeric matrix to allow MB enhanced adsorption. The comparison of photocatalytic performance at 40 min between suspension and immobilized configuration, with zeolite incorporated, indicate that 8% NaY/8% TiO2/P(VDF–TrFE) best degradation efficiency (95.7%) presents a degradation loss efficiency of only 3.3%, relatively to the 60 mg TiO2 result. This result shows that with proper tailoring, immobilized photocatalytic configuration may achieve degradation performances very close to the suspension ones. In this sense, the recuperation of nanoparticles in suspension is overcome and the fast corrosion of TiO2 nanoparticles is prevented, as the exposed area is lower than in the suspension configuration.53
4. Conclusions
Nanocomposite membranes with different amounts of immobilized TiO2 nanoparticles with/without NaY zeolite were successfully produced and characterized. All the produced samples presented good nanoparticles dispersion regardless of TiO2 content as well as a highly porous structure with degrees of porosity between 73 and 79%. The photocatalytic activity is due to the TiO2 nanoparticles, while the NaY zeolites leads to the hydrophilic behavior of the membranes. Photocatalytic assays were performed with TiO2 nanoparticles in suspension and immobilized in P(VDF–TrFE) membranes, monitoring MB degradation. Photocatalytic assays in suspension revealed an optimum amount of nanoparticles (20 to 30 mg) leading to the best MB degradation performance (100% degradation in approximately 30 min of UV irradiation). Afterwards, the photocatalytic activity of nanocomposite membranes was assessed. Results show that, nanocomposites with TiO2 increase degradation rates and efficiency with increasing nanoparticles content. However, the membrane with best performance (85.7% of MB degradation after 40 minutes of UV irradiation) corresponds to an efficiency loss of 13% comparatively to the respective assay with nanoparticles in suspension. To mitigate the limitations caused by immobilization (lower surface area, mass transfer limitations and reduced light harvesting), zeolites were added to the nanocomposites. Zeolites play a key role in the first minutes, favoring higher MB solution permeability and percolation through the porous structure. With this configuration, an efficiency loss of only 3% was achieved regarding the best performance assay with suspended nanoparticles. These results indicate the suitability of these membranes for photocatalytic applications.Acknowledgements
This work was supported by the Portuguese Foundation for Science and Technology (FCT) in the framework of the Strategic Project PEST-C/FIS/UI607/2014 and PEST-C/QUI/UIO686/2014. P. M. Martins thanks the FCT for grants SFRH/BD/98616/2013. The authors thank financial support from the Basque Government Industry Department under the ELKARTEK Program. SLM thanks the Diputación de Bizkaia for financial support under the Bizkaia Talent program.References
- S.-Y. Lu, D. Wu, Q.-L. Wang, J. Yan, A. G. Buekens and K.-F. Cen, Chemosphere, 2011, 82, 1215–1224 CrossRef CAS PubMed.
- M. N. Uddin, S. U. A. Shibly, R. Ovali, I. Saiful, M. M. R. Mazumder, M. S. Islam, M. J. Uddin, O. Gulseren and E. Bengu, J. Photochem. Photobiol., A, 2013, 254, 25–34 CrossRef CAS.
- K. Kabra, R. Chaudhary and R. L. Sawhney, Ind. Eng. Chem. Res., 2004, 43, 7683–7696 CrossRef CAS.
- S. Leong, A. Razmjou, K. Wang, K. Hapgood, X. Zhang and H. Wang, J. Membr. Sci., 2014, 472, 167–184 CrossRef CAS.
- S.-Y. Lu, D. Wu, Q.-L. Wang, J. Yan, A. G. Buekens and K.-F. Cen, Photocatalytic decomposition on nano-TiO2: Destruction of chloroaromatic compounds, Wiley, 2011 Search PubMed.
- A. L. Linsebigler, G. Lu and J. T. Yates, Chem. Rev., 1995, 95, 735–758 CrossRef CAS.
- X. Wu, S. Yin, Q. Dong, B. Liu, Y. Wang, T. Sekino, S. W. Lee and T. Sato, Sci. Rep., 2013, 3, 1–8 CrossRef PubMed.
- M. H. Ahmed, J. A. Byrne, T. E. Keyes, W. Ahmed, A. Elhissi, M. J. Jackson and E. Ahmed, in The Design and Manufacture of Medical Devices, ed. J. P. Davim, Woodhead Publishing, 2012, pp. 1–57 Search PubMed.
- M. E. Simonsen, in Chemistry of Advanced Environmental Purification Processes of Water, ed. E. G. Søgaard, Elsevier, Amsterdam, 2014, pp. 135–170 Search PubMed.
- D. Gumy, A. G. Rincon, R. Hajdu and C. Pulgarin, Solar Energy, 2006, 80, 1376–1381 CrossRef CAS.
- C. Guillard, H. Lachheb, A. Houas, M. Ksibi, E. Elaloui and J.-M. Herrmann, J. Photochem. Photobiol., A, 2003, 158, 27–36 CrossRef CAS.
- H. Choi, S. R. Al-Abed and D. D. Dionysiou, in Nanotechnology Applications for Clean Water, ed. N. S. D. D. S. Sustich, William Andrew Publishing, Boston, 2009, pp. 39–46 Search PubMed.
- R. L. Pozzo, M. A. Baltanás and A. E. Cassano, Catal. Today, 1997, 39, 219–231 CrossRef CAS.
- A. Y. Shan, T. I. M. Ghazi and S. A. Rashid, Appl. Catal., A, 2010, 389, 1–8 CrossRef CAS.
- R. A. Damodar, S.-J. You and H.-H. Chou, J. Hazard. Mater., 2009, 172, 1321–1328 CrossRef CAS PubMed.
- N. Daels, M. Radoicic, M. Radetic, S. W. H. Van Hulle and K. De Clerck, Sep. Purif. Technol., 2014, 133, 282–290 CrossRef CAS.
- S. Ortelli, M. Blosi, S. Albonetti, A. Vaccari, M. Dondi and A. L. Costa, J. Photochem. Photobiol., A, 2014, 276, 58–64 CrossRef.
- Z. Ding, X. Hu, P. L. Yue, G. Q. Lu and P. F. Greenfield, Catal. Today, 2001, 68, 173–182 CrossRef.
- Z. Pang, J. Fu, L. Luo, F. Huang and Q. Wei, Colloids Surf., A, 2014, 461, 113–118 CrossRef CAS.
- Y. Zhang, J. Wan and Y. Ke, J. Hazard. Mater., 2010, 177, 750–754 CrossRef CAS PubMed.
- H. Choi, A. Zakersalehi, S. R. Al-Abed, C. Han and D. D. Dionysiou, in Nanotechnology Applications for Clean Water, ed. A. S. S. D. Savage, William Andrew Publishing, Oxford, 2nd edn, 2014, pp. 123–132 Search PubMed.
- J. Nunes-Pereira, A. C. Lopes, C. M. Costa, L. C. Rodrigues, M. M. Silva and S. Lanceros-Méndez, J. Electroanal. Chem., 2013, 689, 223–232 CrossRef CAS.
- A. Ferreira, J. Silva, V. Sencadas, J. L. Gómez-Ribelles and S. Lanceros-Méndez, MRS Online Proc. Libr., 2011, 1312, 125–130 Search PubMed.
- L. F. Brown, IEEE Trans. Sonics Ultrason., 2000, 47, 1377–1396 CrossRef CAS PubMed.
- G. Botelho, M. M. Silva, A. M. Gonçalves, V. Sencadas, J. Serrado-Nunes and S. Lanceros-Mendez, Polym. Test., 2008, 27, 818–822 CrossRef CAS.
- P. Martins, A. C. Lopes and S. Lanceros-Mendez, Prog. Polym. Sci., 2014, 39, 683–706 CrossRef CAS.
- R. M. Dahan, N. S. Muhamad, Y. S. Ling, M. H. M. Wahid, N. A. Adillah, N. Kamarulzaman and D. Kamarun, Adv. Mater. Res., 2012, 626, 317–323 CrossRef.
- D. Lee, H. Maeda, A. Obata, K. Inukai, K. Kato and T. Kasuga, Adv. Mater. Sci. Eng., 2013, 2013, 6 Search PubMed.
- A. W. Chester and E. G. Derouane, Zeolite Chemistry and Catalysis: an integrated Approach and Tutorial, Springer, Netherland, Berlin, 2009 Search PubMed.
- J. N. Israelachvili, Intermolecular and surface forces with applications to colloidal and biological systems, Academic Press, London, Orlando, San Diego, etc., 1985 Search PubMed.
- M. D. Duca, C. L. Plosceanu and T. Pop, Polym. Degrad. Stab., 1998, 61, 65–72 CrossRef CAS.
- E. Braswell, J. Phys. Chem., 1968, 72, 2477–2483 CrossRef CAS.
- J. Marques, L. F. Oliveira, R. T. Pinto, P. J. G. Coutinho, P. Parpot, J. R. Góis, J. F. J. Coelho, F. D. Magalhães and C. J. Tavares, Int. J. Photoenergy, 2013, 2013, 9 CrossRef.
- J. Yu, G. Wang, B. Cheng and M. Zhou, Appl. Catal., B, 2007, 69, 171–180 CrossRef CAS.
- Z. Jin, W. Duan, B. Liu, X. Chen, F. Yang and J. Guo, Appl. Surf. Sci., 2015, 356, 707–718 CrossRef CAS.
- A. Bradbury, S. Menear and R. W. Chantrell, J. Magn. Magn. Mater., 1986, 54–57, 745–746 CrossRef CAS.
- A. N. Okte and O. Yilmaz, Appl. Catal., B, 2008, 85, 92–102 CrossRef CAS.
- C. Sentein, B. Guizard, S. Giraud, F. Tenegal and C. Ye, J. Phys.: Conf. Ser., 2009, 170, 1–7 Search PubMed.
- Z. M. El-Bahy, A. A. Ismail and R. M. Mohamed, J. Hazard. Mater., 2009, 166, 138–143 CrossRef CAS PubMed.
- Y. Chen and D. D. Dionysiou, Appl. Catal., A, 2007, 317, 129–137 CrossRef CAS.
- L. Dong, X. Zhang, X. Dong, X. Zhang, C. Ma, H. Ma, M. Xue and F. Shi, J. Colloid Interface Sci., 2013, 393, 126–129 CrossRef CAS PubMed.
- A. A. Prabu, J. S. Lee, K. J. Kim and H. S. Lee, Vib. Spectrosc., 2006, 41, 1–13 CrossRef CAS.
- N. M. Reynolds, K. J. Kim, C. Chang and S. L. Hsu, Macromolecules, 1989, 22, 1092–1100 CrossRef CAS.
- B. I. Shikunov, L. I. Lafer, V. I. Yakerson, I. V. Mishin and A. M. Rubinshtein, Bull. Acad. Sci. USSR, Div. Chem. Sci., 1972, 21, 201–203 CrossRef.
- S. M. Auerbach, K. A. Carrado and P. K. Dutta, Handbook of Zeolite Science and Technology, ed. M. Dekker, New York, 2003 Search PubMed.
- K. Nakata, H. Kimura, M. Sakai, T. Ochiai, H. Sakai, T. Murakami, M. Abe and A. Fujishima, ACS Appl. Mater. Interfaces, 2010, 2, 2485–2488 CAS.
- R. Wang, K. Hashimoto, A. Fujishima, M. Chikuni, E. Kojima, A. Kitamura, M. Shimohigoshi and T. Watanabe, Adv. Mater., 1998, 10, 135–138 CrossRef CAS.
- R. Nosrati, A. Olad and K. Nofouzi, Appl. Surf. Sci., 2015, 346, 543–553 CrossRef CAS.
- C. Carneiro, R. Vieira, A. Mendes and F. Magalhães, J. Coat. Technol. Res., 2012, 9, 687–693 CrossRef CAS.
- H. Dong, L. Zhao, L. Zhang, H. Chen, C. Gao and W. S. Winston Ho, J. Membr. Sci., 2015, 476, 373–383 CrossRef CAS.
- C. Liao, P. Yu, J. Zhao, L. Wang and Y. Luo, Desalination, 2011, 272, 59–65 CrossRef CAS.
- M. Lu and P. Pichat, Photocatalysis and water purification: from fundamentals to recent applications, John Wiley & Sons, 2013 Search PubMed.
- S. Y. Ryu, W. Balcerski, T. K. Lee and M. R. Hoffmann, J. Phys. Chem. C, 2007, 111, 18195–18203 CAS.
- T. Zhang, L. Ge, X. Wang and Z. Gu, Polymer, 2008, 49, 2898–2902 CrossRef CAS.
- E. Cossich, R. Bergamasco, M. T. Pessoa de Amorim, P. M. Martins, J. Marques, C. J. Tavares, S. Lanceros-Méndez and V. Sencadas, Mater. Chem. Phys., 2015, 164, 91–97 CrossRef CAS.
- T. He, Z. Zhou, W. Xu, F. Ren, H. Ma and J. Wang, Polymer, 2009, 50, 3031–3036 CrossRef CAS.
Footnote |
| † Electronic supplementary information (ESI) available. See DOI: 10.1039/c5ra25385c |
| This journal is © The Royal Society of Chemistry 2016 |

