Synergistic inhibition of carbon steel corrosion in 0.5 M HCl solution by indigo carmine and some cationic organic compounds: experimental and theoretical studies

Z. Zhang*ab, N. C. Tiana, X. D. Huanga, W. Shanga and L. Wuc
aGuangxi Key Laboratory of Electrochemical and Magneto-chemical Functional Materials, College of Chemistry and Bioengineering, Guilin University of Technology, Guilin 541004, PR China. E-mail: zhangzhe@glut.edu.cn; Tel: +86 15296001526
bDepartment of Chemical Engineering, Mid Sweden University, Sundsvall SE-85170, Sweden
cSchool of Chemistry and Chemical Engineering, Shandong University, Jinan 250100, PR China

Received 29th November 2015 , Accepted 11th February 2016

First published on 12th February 2016


Abstract

The synergistic corrosion inhibition effect of indigo carmine and three kinds of cationic organic compounds on 1045 carbon steel (CS) in 0.5 M HCl solution is reported. Electrochemical measurements showed that these three cationic organic compounds combined with indigo carmine reduce the speed of corrosion on 1045 CS and act as effective inhibitors. The combination of indigo carmine with BAB resulted in the best synergistic corrosion inhibition effect (S = 17.14), and the best inhibition efficiency (95.0%). SEM images and XPS data of the corroded steel surfaces suggested that the indigo disulphonate anion and organic cation could be simultaneously adsorbed on the CS surface to inhibit the corrosion of iron. The synergistic inhibition mechanism was investigated by dynamic simulations using quantum chemistry.

1. Introduction

As a major construction material, carbon steel is used extensively in various industrial environments. The corrosion of carbon steel is usually inevitable, and can lead to economic loss and personal injury.1,2 Organic corrosion inhibitors are the best choice for protecting the metals from corrosion, due to their high efficiency, low cost and environmentally-friendly characteristics.3,4 Indigo dye is a traditional and natural compound that is coloured, and that can impart colour to other materials on a reasonably permanent basis.5 This nature indicates that the indigo dye molecule has sufficiently high adsorption capabilities to act as a steel coating. Also, indigo dye and some other dyes have been reported to reduce and inhibit metal corrosion.5–10

As a derivative of the indigo molecule, the indigo carmine molecule is considered as a candidate for corrosion inhibition due to its better solubility. As shown in Table 1, the indigo carmine molecule contains N, O and S atoms and a conjugated aromatic nucleus, which suggest this molecule to be an efficient inhibitor. M. Abdeli et al.11 reported that indigo carmine could inhibit mild steel corrosion in 1 mol L−1 (M) HCl solution. The inhibition efficiency increased with the addition of a small amount of indigo carmine and then decreased when the concentration of indigo carmine was higher than 9.65 × 10⁻⁵ M. However, we found that the inhibition effect of indigo carmine is different on mild steel and 1045 carbon steel. The corrosion of 1045 carbon steel could be accelerated when the concentration of indigo carmine exceeded 1 × 10⁻⁴ M in our previous research.12 The carbon content and the purity of the iron are important factors for the corrosion-resistance of carbon steel, which is weakened as the carbon content increases, because the existence of carbon elements can enhance the electrochemical corrosion of carbon steel in a non-oxidizing acid medium.13–16

Table 1 The structural formulas and symbols of inhibitor molecules
Inhibitors Structure Symbol
Indigo carmine image file: c5ra25359d-u1.tif
Triethanolamine image file: c5ra25359d-u2.tif TEA
Benzyl trimethyl ammonium bromide image file: c5ra25359d-u3.tif BAB
Cetyltrimethylammonium bromide image file: c5ra25359d-u4.tif CTAB


Consequently, the aim of the present work is to further verify the synergistic corrosion inhibition mechanism of indigo carmine and three kinds of cationic organic compounds for CS in 0.5 M HCl solution. Triethanolamine, benzyl trimethyl ammonium bromide and cetyltrimethylammonium bromide were selected as cationic organic compounds to eliminate the influence of hydrophobic properties, and their structural formulas are shown in Table 1. Electrochemical measurements were used to study the inhibition efficiency of each inhibitor. XPS and SEM techniques were used to examine the surface morphology of CS sheets with and without inhibitors in the 0.5 M HCl solution for 48 h. The synergistic corrosion inhibition mechanism and the correlation between molecular structure and inhibition efficiency were investigated using molecular dynamics simulations and quantum chemical calculations.

2. Experiments

2.1. Preparation of electrodes

1045 carbon steel (CS) specimens of composition (wt%) C (0.45%), Si (0.17%), Mn (0.5%), S (0.035%), P (0.035%), Cr (0.25%), Cu (0.25%), Ni (0.30%) and Fe (the remaining 98%) were used. The CS rod was embedded in epoxy resin in a glass tube such that only the cross-section had contact with the solution. Prior to each experiment, the exposed surface of WE was mechanically abraded with 800#, 1200# and 1400# emery papers until its surface was smooth, and it was subsequently degreased and cleaned with ethanol using an ultrasonic cleaner. Finally, the cleaned electrode was immersed in ethanol.12,17

2.2. Creation of synergistic inhibitor solutions

Indigo carmine (≧96%, Aladdin Industrial Corporation) was dissolved in 0.5 M HCl solution, which was prepared from analytical-grade HCl (12 M) and ultra pure water at 25 °C. Then, TEA (≧98%, Aladdin Industrial Corporation), BAB (≧98%, Aladdin Industrial Corporation) or CTAB (≧98%, Aladdin Industrial Corporation) was dissolved in the indigo carmine solution with mechanical stirring. The molar ratio of indigo carmine to each cationic organic compound was 1[thin space (1/6-em)]:[thin space (1/6-em)]2 in all of the experiments. Finally, the obtained inhibitor solution was allowed to stand for 2 h for the interaction of indigo carmine and CTAB at a room temperature of 25 °C.

2.3. Electrochemical measurements

In this study, the electrochemical measurements were performed using electrochemical impedance spectroscopy (EIS) and potentiodynamic polarization measurements, and the detail of these experiments is described in a previous article by Zhe Zhang.12

2.4. Surface observation and characterization

The specimens for the characterization experiments were bare CS sheets (3 mm × 3 mm × 1 mm). The preliminary process was the same as in section 2.1. After immersion for 48 h in 0.5 M HCl test solution, in the absence and presence of inhibitors, the CS sheets were rinsed with ultra pure water, and then vacuum dried in anhydrous ethanol at 50 °C. The surface characteristics of the CS specimens were examined using scanning electron microscopy (SEM) (JSM-6380LV). XPS analysis of the corroded surfaces was performed using an X-ray photoelectron spectrometer (ESCALAB 250Xi system, Thermo Electron Corporation, USA) and the specimen was irradiated with Al Kα radiation (photoelectron energy 1253.6 eV). Survey scans and relevant core levels were recorded: Fe 2p, C 1s, N 1s, O 1s and S 2p.

2.5. Quantum chemical calculations and dynamic simulations

In order to investigate the quantum chemical properties of indigo carmine and the three other kinds of cationic organic compounds, Gaussian 03W software18 was used to perform the quantum chemical calculations. Geometry optimization and energy calculations were carried out using the Density Functional Theory (DFT) method of the Becke-type three-parameter hybrid combined with the gradient-corrected correlation function of Lee, Yang, and Parr (B3LYP) in conjunction with the 6-311G(d,p) basis set.19–21

The adsorption configuration of the indigo carmine molecule and three other kinds of cationic organic molecules on the steel surface were dynamically simulated by using the Discover module of the Materials Studio 6.0 software from Accelrys Inc.22 The details for the setup of this molecular dynamics simulation are listed in Table 2. The details for the simulation system building process have previously been detailed in work by Zhe Zhang.12

Table 2 Details for the setup of the molecular dynamics simulation
Basic setup Method Convergence level Maximum iteration
Smart minimizer Ultra-fine 20[thin space (1/6-em)]000
Minimizer setup Force field Non-bond Summation method Cutoff distance
Compass vdW Atom based 9.5 Å
Dynamic simulation setup Ensemble Thermostat Simulation temperature Energy deviation
NVT Andersen 298.0 K 5000.0 kcal mol−1
Dynamics time Time step Frame output
2000.0 ps 1 fs Every 1000 steps


The inhibitors aqueous solution layer and the confined water molecule layer, which were constructed using the amorphous cell module, contained 5H3O+ ions, 5Cl ions, 500H2O molecules, 1 inhibitor molecule or 2 compounded inhibitor molecules and some corresponding inorganic ions in this simulated system to simulate the 0.5 M HCl solution. Due to the high tendency of TEA molecules be protonated in an acidic solution,17,23–25 TEAH was considered as the cationic organic compound in the dynamic simulation, and the protonation process is shown in Fig. 1. In order to study the interactions between the inhibitors and Fe (1 1 0) surface, 6 layers of iron atoms near the bottom were frozen. Before the molecular dynamics simulation, the constructed box could be optimized such that the total energy of the system was at a local minimum with respect to potential energy. Finally, the dynamic simulated process was carried out until both the temperature and the energy of the whole system reached equilibrium.


image file: c5ra25359d-f1.tif
Fig. 1 The protonation process of a TEA molecule in acidic solution.

3. Results and discussion

3.1. Analysis of anti-corrosion and synergistic effect mechanisms

For the corrosion of carbon steel in HCl solution (while pH < 3) the anodic (metal dissolution) and cathodic (hydrogen evolution) half reactions are:26–29
 
Fe → Fe2+ + 2e (1)
 
2H+ + 2e → H2 (2)

And the overall corrosion reaction equation appears as follows:

 
Fe + 2H+ → Fe2+ + H2 (3)

The anodic dissolution of iron occurs according to the following steps:30

 
Fe + Cl → (FeCl)ads (4)
 
(FeCl)ads → (FeCl)ads + e (5)
 
(FeCl)ads → (FeCl+) + e (6)
 
(FeCl+) → Fe2+ + Cl (7)

In addition, the hydrogen production occurs via two successive elementary events: to begin with, the initial discharge of hydrogen ions to adsorbed monoatomic hydrogen:31

 
H+ + e → H˙ (8)

Followed by the chemical (eqn (9)) or electrochemical (eqn (10)) recombination of monoatomic hydrogen to molecular hydrogen.

 
2H˙ → H2 (9)
 
H+ + H˙ + e → H2 (10)

To investigate the inhibition behavior of indigo carmine and other inhibitors (such as various cationic organic inhibitors and various composite inhibitors) of CS in 0.5 M HCl solution at 25 °C, EIS and potentiodynamic polarization measurements were carried out. The Nyquist plots and polarization curves of the WE measured in various test solutions are shown in Fig. 2–4. We could find that all of the Nyquist curves displayed a single capacitive arc, indicating that they each contained one time constant. And these capacitive arcs were the compressed type, which could be attributed to the heterogeneity or roughness of the WE surface.32 Additionally, the shapes of the Nyquist curves for all of the test inhibitors were similar to that of the blank solution. This indicated the corrosion mechanism was almost unchanged by the addition of the inhibitors.33


image file: c5ra25359d-f2.tif
Fig. 2 Nyquist impedance spectra (a) and potentiodynamic polarization curves (b) of the WE measured in 0.5 M HCl solutions containing indigo carmine inhibitors. The solid lines are their fitted curves in the impedance spectra.

image file: c5ra25359d-f3.tif
Fig. 3 Nyquist impedance spectra and potentiodynamic polarization curves of the WE measured in 0.5 M HCl solutions containing various cationic organic inhibitors. TEA: (a) and (b), BAB: (c) and (d), CTAB: (e) and (f). The solid lines are their fitted curves in the impedance spectra.

image file: c5ra25359d-f4.tif
Fig. 4 Nyquist impedance spectra and potentiodynamic polarization curves of the WE measured in 0.5 M HCl solutions containing various composite inhibitors. Indigo carmine/TEA: (a) and (b), indigo carmine/BAB: (c) and (d), indigo carmine/CTAB: (e) and (f). The solid lines are their fitted curves in the impedance spectra.

Thus, the EIS data could be simulated by ZView2 software with a simple equivalent circuit Rs (CPE, Rct) and the fitting model is shown in Fig. 5. The fitting data are shown in Table 3. In this equivalent circuit, Rs represents the solution resistance between the WE and SCE, and Rct represents the charge-transfer resistance. To more accurately fit the EIS of this study, CPE is a constant phase element to replace a double layer capacitance (Cdl), and the admittance and impedance of the CPE can be defined from the following formula:34,35

 
image file: c5ra25359d-t1.tif(11)
where Y0 is the modulus, n is the deviation parameter and ω is the angular frequency. Accordingly, the values of Cdl can be calculated using eqn (12):36–38
 
Cdl = Y01/nRct(1−n)/n (12)


image file: c5ra25359d-f5.tif
Fig. 5 Equivalent electrical circuit diagram used to model the WE/solution interface in 0.5 M HCl solution.
Table 3 Impedance parameters of the WE measured in 0.5 M HCl solution containing various inhibitors
Inhibitors Concentration (mol L−1) Molar ratio Rs (Ω) CPE Cdl (µF cm−2) Rct (Ω cm2) ηR (%)
Y0 (µΩ−1 Sn cm−2) n
Blank sample 0 6.98 27.77 0.852 9.47 74.0
Indigo 0.00001 6.29 71.17 0.818 24.18 111.0 33.3
0.00005 6.78 77.51 0.830 26.39 68.2 −8.5
0.0001 6.83 97.66 0.831 34.35 60.5 −22.4
0.0005 6.23 160.69 0.829 58.42 46.2 −60.3
0.001 6.93 256.32 0.804 84.57 41.6 −78.0
0.005 6.63 268.25 0.806 84.58 31.0 −138.9
0.01 6.22 424.13 0.791 126.70 24.5 −202.7
TEA 0.0002 6.76 263.43 0.809 83.77 29.5 −151.2
0.001 7.05 210.00 0.808 64.00 31.6 −134.4
0.002 7.22 179.32 0.834 69.21 46.0 −61.0
0.01 6.65 78.43 0.835 29.81 94.2 21.4
0.02 6.66 83.16 0.837 34.10 122.0 39.3
BAB 0.0002 6.63 256.32 0.804 78.70 31.0 −138.9
0.001 6.78 199.46 0.824 72.66 44.5 −66.1
0.002 6.71 144.68 0.833 55.00 55.1 −34.2
0.01 6.50 44.37 0.865 20.42 159.5 53.6
0.02 6.72 47.64 0.838 19.34 195.3 62.1
CTAB 0.00002 6.78 18.08 0.753 4.92 1055.0 93.0
0.0001 6.60 12.59 0.791 4.73 1938.0 96.2
0.0002 5.68 11.59 0.875 7.01 2527.0 97.1
0.001 6.43 12.09 0.820 5.36 2046.0 96.4
Indigo/TEA 0.0001 1[thin space (1/6-em)]:[thin space (1/6-em)]2 7.58 115.49 0.826 43.92 89.1 17.0
0.0005 1[thin space (1/6-em)]:[thin space (1/6-em)]2 6.92 44.10 0.848 18.42 172.6 57.1
0.001 1[thin space (1/6-em)]:[thin space (1/6-em)]2 6.33 28.29 0.832 10.44 250.9 70.5
0.005 1[thin space (1/6-em)]:[thin space (1/6-em)]2 7.00 25.87 0.854 11.37 313.8 76.4
0.01 1[thin space (1/6-em)]:[thin space (1/6-em)]2 6.65 44.76 0.860 20.53 189.1 60.9
Indigo/BAB 0.0001 1[thin space (1/6-em)]:[thin space (1/6-em)]2 6.61 41.79 0.817 13.96 179.3 58.7
0.0005 1[thin space (1/6-em)]:[thin space (1/6-em)]2 6.68 29.07 0.835 13.06 594.9 87.6
0.001 1[thin space (1/6-em)]:[thin space (1/6-em)]2 6.48 35.26 0.780 13.24 884.0 91.6
0.005 1[thin space (1/6-em)]:[thin space (1/6-em)]2 6.19 31.55 0.823 15.91 1301.0 94.3
0.01 1[thin space (1/6-em)]:[thin space (1/6-em)]2 6.50 27.98 0.825 14.37 1546.0 95.2
Indigo/CTAB 0.00001 1[thin space (1/6-em)]:[thin space (1/6-em)]2 6.51 7.88 0.810 2.73 1399.0 94.7
0.00005 1[thin space (1/6-em)]:[thin space (1/6-em)]2 6.74 9.48 0.779 3.85 4387.0 98.3
0.0001 1[thin space (1/6-em)]:[thin space (1/6-em)]2 6.69 7.71 0.791 2.92 3290.0 97.8
0.0005 1[thin space (1/6-em)]:[thin space (1/6-em)]2 6.52 8.43 0.805 3.19 2177.0 96.6


The corrosion inhibition efficiencies (ηR) of impedance have been estimated by Rct according to the following formula:

 
image file: c5ra25359d-t2.tif(13)
where R0ct and Rct are the charge transfer resistance of the WE measured in the 0.5 M HCl solution and the 0.5 M HCl solution containing inhibitors, respectively.

In addition, the polarization curves for the WE were recorded and the results are shown in Fig. 2–4. The polarization parameters, fitted using the built-in CHI760e software, are listed in Table 4 and include: the corrosion potential (Ecorr), the cathodic and anodic Tafel slopes βc and βa (V dec−1), and the corrosion current density (icorr). These values were obtained via processed polarization curves by Tafel extrapolation. The protection efficiencies (ηi) of corrosion current density were calculated using eqn (14) and the results are listed in Table 4:

 
image file: c5ra25359d-t3.tif(14)
where i0corr and icorr represent the corrosion current densities of the WE in 0.5 M HCl and 0.5 M HCl containing inhibitors, respectively.

Table 4 Polarization parameters for the WE measured in 0.5 M HCl solutions containing various inhibitors
Inhibitors Concentration (mol L−1) Molar ratio Ecorr (V vs. SCE) βc (V dec−1) βa (V dec−1) icorr (µA cm−2) ηi (%) S
Blank sample 0 −0.515 0.157 0.165 664.6
Indigo 0.00001 −0.513 0.153 0.157 373.2 43.8
0.00005 −0.511 0.154 0.157 765.5 −15.2
0.0001 −0.508 0.160 0.165 877.1 −32.0
0.0005 −0.504 0.163 0.169 994.0 −49.6
0.001 −0.503 0.162 0.164 1025.0 −54.2
0.005 −0.501 0.170 0.163 1462.0 −120.0
0.01 −0.502 0.183 0.192 2694.0 −305.4
TEA 0.0002 −0.506 0.172 0.175 1451.0 −118.3
0.001 −0.504 0.173 0.172 1386.0 −108.5
0.002 −0.506 0.163 0.163 1037.0 −56.0
0.01 −0.509 0.147 0.145 472.9 28.8
0.02 −0.509 0.143 0.142 437.5 34.2
BAB 0.0002 −0.501 0.170 0.164 1462.0 −120.0
0.001 −0.502 0.165 0.161 1008.0 −51.7
0.002 −0.504 0.155 0.148 798.1 −20.1
0.01 −0.503 0.147 0.140 367.1 44.8
0.02 −0.505 0.145 0.132 280.2 57.8
CTAB 0.00002 −0.525 0.158 0.150 51.7 92.2
0.0001 −0.524 0.155 0.145 24.0 96.4
0.0002 −0.524 0.148 0.120 16.4 97.5
0.001 −0.528 0.156 0.128 18.4 97.2
Indigo/TEA 0.0001 1[thin space (1/6-em)]:[thin space (1/6-em)]2 −0.512 0.146 0.147 478.9 27.9 4.00
0.0005 1[thin space (1/6-em)]:[thin space (1/6-em)]2 −0.513 0.143 0.146 349.8 47.4 5.93
0.001 1[thin space (1/6-em)]:[thin space (1/6-em)]2 −0.524 0.188 0.160 185.8 72.0 8.61
0.005 1[thin space (1/6-em)]:[thin space (1/6-em)]2 −0.522 0.190 0.161 176.2 73.5 5.90
0.01 1[thin space (1/6-em)]:[thin space (1/6-em)]2 −0.523 0.182 0.164 240.4 63.8 7.38
Indigo/BAB 0.0001 1[thin space (1/6-em)]:[thin space (1/6-em)]2 −0.511 0.141 0.130 286.9 56.8 15.79
0.0005 1[thin space (1/6-em)]:[thin space (1/6-em)]2 −0.512 0.133 0.114 80.4 87.9 17.14
0.001 1[thin space (1/6-em)]:[thin space (1/6-em)]2 −0.523 0.125 0.098 56.7 91.5 16.31
0.005 1[thin space (1/6-em)]:[thin space (1/6-em)]2 −0.522 0.117 0.090 42.5 93.6 12.03
0.01 1[thin space (1/6-em)]:[thin space (1/6-em)]2 −0.523 0.118 0.091 33.2 95.0 12.44
Indigo/CTAB 0.00001 1[thin space (1/6-em)]:[thin space (1/6-em)]2 −0.521 0.157 0.134 30.9 95.3 0.94
0.00005 1[thin space (1/6-em)]:[thin space (1/6-em)]2 −0.523 0.142 0.109 9.9 98.5 3.63
0.0001 1[thin space (1/6-em)]:[thin space (1/6-em)]2 −0.524 0.139 0.112 13.2 98.0 1.92
0.0005 1[thin space (1/6-em)]:[thin space (1/6-em)]2 −0.520 0.150 0.109 21.8 96.7 1.86


3.1.1 Mechanism of corrosion inhibition by indigo carmine. As shown in Fig. 2a and Table 3, the Rct value increased with the concentration of indigo carmine when used in small amounts, which indicated a concentration-dependent increase in the protection efficiency at low concentration. However, when the concentration of indigo carmine was increased above 5 × 10⁻⁵ M, the Rct value decreased with an increase in concentration. As indigo carmine molecules exist in HCl solution as the indigo disulphonate ion and sodium ion, this phenomenon could be explained as follows: the indigo disulphonate ion was adsorbed on the CS surface with hardly any change in the charge distribution of CS at such a low concentration, and the adsorbed indigo disulphonate ions covered some of the active sites of CS to reduce the corrosion of iron by the HCl solution. As the concentration of indigo carmine increased, more and more indigo disulphonate ions were adsorbed on the active sites of the CS surface and the charge distribution of the CS changed to a negatively charged surface, which would gather the H+ ions on the WE surface. An increase in the concentration of H+ ions promotes the corrosion reaction of iron in HCl solution (see eqn (3)), inducing the discharge of H+ and accelerating corrosion.31,39,40 So, we could draw the conclusion that the indigo disulphonate ion could adsorb strongly on CS surface through its nitrogen atoms, sulfur atoms and oxygen atoms, but it was unable to protect the iron from corrosion due to the negatively charged surface.12

As shown in Table 3, the Cdl value increased from 9.49 to 126.70 µF cm−2 with an increase in the concentration of indigo carmine. According to the Helmholtz model, this result is reasonable, as Cdl is inversely proportional to the surface charge and directly proportional to the local dielectric constant of the WE surface:37,41,42

 
image file: c5ra25359d-t4.tif(15)
where A is the electrode surface, d is the film thickness, ε0 is the permittivity of air, and ε is the local dielectric constant. The increase in the Cdl value is attributed to the replacement of the adsorbed water molecules at the WE surface by the indigo disulphonate ions that have a higher dielectric constant.43 These points suggest that the local dielectric constant of the WE was changed by indigo disulphonate ion adsorption at the metal–solution interface, thereby increasing the Cdl value. It is inferred that the adsorption quantity of indigo disulphonate ions increased with the increase in the concentration of indigo carmine at the same immersion time. Also, the large increase in the value of Cdl may be due to the loose and porous corrosion products (as the porous electrode surface with high Cdl because of large specific surface area) that have covered the WE surface. This means that the level of corrosion in the 0.5 M HCl solution with indigo carmine becomes more serious as the concentration increases at the same immersion time. The n values, shown in Table 3, change from 0.852 to 0.791 with obvious regularity. The reason may be that the surface of the WE is non-homogeneous, and the surface quality becomes worse due to indigo carmine accelerating its corrosion in 0.5 M HCl solution.

From Fig. 2b, we can find that the anodic and cathodic current densities all changed with an increase in concentration. With the exception of the corrosion current density in the presence of the 1 × 10⁻⁵ M indigo carmine sample, which was lower than that of the blank sample, the icorr values increased with an increase in the concentration of the indigo carmine samples, and were higher than the value for the blank sample (Table 4). This means that indigo carmine could inhibit the corrosion of CS in 0.5 M HCl solution at a concentration of about 1 × 10⁻⁵ M. When the concentration of indigo carmine was above 5 × 10⁻⁵ M, however, it could accelerate the corrosion of CS in 0.5 M HCl solution. Comparing the cathodic and anodic Tafel slopes (βc and βa, respectively) of indigo carmine (Table 4), we found that the increase in the value of βc was bigger than the increase in the value of βa, which means that hydrogen reduction in the cathodic region was further accelerated. This indicated that the adsorbed indigo disulphonate ion inducing the discharge of H+ on the CS surface is the major factor in indigo carmine’s acceleration of CS corrosion in 0.5 M HCl solution.

3.1.2 Mechanism of corrosion inhibition by cationic organic inhibitors. As shown in Table 3, the Rct values were lower than that of the blank sample when the concentrations of the TEA and BAB samples were under 0.01 M. When the concentrations of the TEA and BAB samples exceeded 0.01 M, the Rct values were higher than the Rct value of the blank sample. Additionally, the Rct values of the TEA and BAB samples all increased as the concentration increased. This phenomenon indicated that TEA and BAB could not inhibit the corrosion of CS in 0.5 M HCl solution. On the contrary, TEA and BAB could accelerate the corrosion at lower concentrations. Due to the protonation of TEA and the hydrolysis of BAB, TEA and BAB could exist in HCl solution as TEAH, a benzyl trimethyl ammonium ion and a bromide ion. The reason may be that the adsorption of TEAH or a benzyl trimethyl ammonium ion on the CS surface could change the charge distribution of the CS from zero charge to positively charged, which would cause Cl ions to gather on the CS surface and corrode the iron surface with pitting corrosion. When the concentrations of TEA and BAB were above 0.01 M, more and more TEAH or benzyl trimethyl ammonium ions could be adsorbed on the CS surface and, gradually, a dense film formed. Although Cl ions were gathered on the CS surface, this dense film could isolate the Cl ions and inhibit the pitting corrosion. From Fig. 3e or Table 3, we could find that all of the Rct values with CTAB were higher than that for the blank sample. And the Rct with CTAB increased as its concentration increased when the concentration of CTAB was less than 0.0002 M. When the concentration of CTAB was above 0.0002 M, the Rct value decreased as the concentration increased. This indicated that CTAB could effectively inhibit the corrosion of CS in 0.5 M HCl solution. This may be because the molecular structure of CTAB contains a long-chain alkyl group, which could cause the adsorbed cetyltrimethylammonium ions to arrange on the CS surface one by one and form hydrophobic layers to protect the CS from corrosion. Due to the agglomeration phenomenon of a long-chain alkyl molecule, the ηR of CTAB decreased when the concentration of CTAB was above 0.0002 M.

Based on the Cdl values of these three kinds of cationic organic inhibitors, they could be placed in the order TEA > BAB ≫ CTAB. There was little difference in the Cdl values for TEA and BAB, but both were higher than the Cdl value for CTAB. It is worth noting that the Cdl values for CTAB were all lower than that of the blank sample. The local dielectric constant (ε) of the CS surface with adsorbed TEAH or benzyl trimethyl ammonium ions was much higher than the ε of the CS surface with adsorbed cetyltrimethylammonium ions, because the hydrophobicity of the cetyltrimethylammonium ion is better than that of TEAH and the benzyl trimethyl ammonium ion. From the values of n in Table 3, we could find that the n of each cationic organic inhibitor increased in the range of 0.8 to 0.9 with an increase in concentration. The reason may be that the surface of the working electrodes is non-homogeneous, and the self-assembled films improve the heterogeneity. In summary, these three kinds of cationic organic inhibitors can all become adsorbed on the CS surface and form films with different properties. Their corrosion inhibition effects follow the order of CTAB ≫ BAB > TEA.

As shown in Table 4, the icorr values for TEA and BAB were higher than that of the blank sample when their concentrations were under 0.01 M. When the concentrations of TEA and BAB were above 0.01 M, their icorr values were lower than that of the blank sample. Furthermore, their icorr values decreased as their concentrations increased. This means that TEA and BAB could inhibit the corrosion of CS in 0.5 M HCl solution when their concentrations are high enough. The icorr values for CTAB were all lower than that of the blank sample, which indicated that CTAB could effectively inhibit the corrosion of CS. These results are consistent with the result from the EIS measurements. From the polarization curves in Fig. 3, we could find that the anodic and cathodic current densities obviously decreased when these three kinds of cationic organic molecules played the role of inhibitor. The oxidative dissolution of the working electrodes in the anodic region and hydrogen reduction in the cathodic region were weaker in the Tafel plots, which indicated that the anodic dissolution of CS and hydrogen evolution were both suppressed. In general, the inhibitors can be classified as anodic or cathodic types when the change in the Ecorr value is greater than 85 mV.44–47 Obviously, TEA and BAB could be classified as mixed type inhibitors due to the slight shifts in the Ecorr values. Although the Ecorr values with CTAB were all shifted in the negative direction, the maximal displacement was also less than 85 mV. So, CTAB can also be classified as a mixed type inhibitor.

3.1.3 Mechanism of corrosion inhibition by the compound inhibitors. The Nyquist impedance plots of CS in the absence and presence of various compound inhibitors are plotted in Fig. 4. The intercept of each capacitive loop on the horizontal axis was greater than that of the blank sample. This indicates that these three kinds of compound inhibitors could all inhibit corrosion of the CS in 0.5 M HCl solution, and most of their Rct values increased with an increase in concentration. We can find that the Rct values for these compound inhibitors were much higher than those of the individual inhibitors at the same concentration. This means that the combination of indigo carmine with a kind of cationic organic inhibitor could improve the inhibition of CS corrosion in 0.5 M HCl solution. In addition, we found that the Rct values for indigo carmine/TEA and indigo carmine/CTAB decreased with an increase in concentration when the concentration was high enough. For the combination of the indigo disulphonate anion with TEAH or the cetyltrimethylammonium cation in 0.5 M HCl solution, this phenomenon could be explained as follows. When the concentration of indigo carmine/TEA (or indigo carmine/CTAB) was lower, the indigo disulphonate anion and TEAH (or the indigo disulphonate anion and cetyltrimethylammonium cation) were adsorbed evenly on the CS surface and, gradually, a dense film formed. In contrast, when the concentration of indigo carmine/TEA (or indigo carmine/CTAB) was higher, the indigo disulphonate anion and TEAH (or the indigo disulphonate anion and cetyltrimethylammonium cation) were competitively adsorbed on the CS surface and formed an unstable molecular film. Because the molecular structures of BAB and indigo carmine contain some aromatic ring groups, the indigo carmine/BAB compound inhibitor was slightly affected by this competitive adsorption.

As shown in Table 3, the Cdl values for these three kinds of compound inhibitors were much smaller than those of the single indigo carmine or corresponding single cationic organic inhibitors. In particular, the Cdl values for indigo carmine/CTAB were smaller than that of the blank sample. This result indicated that the local dielectric constant of the CS surface modified with various compound inhibitors was decreased due to the simultaneous adsorption of the indigo disulphonate anion and other organic cation on the CS surface, equilibrating the charge distribution of the CS. The n of each compound inhibitor changed in the range of 0.78 to 0.86 with no obvious regularity, as shown in Table 3. This may be because the surface heterogeneity of CS was changed with no obvious regularity due to the simultaneous adsorption of two oppositely charged molecules on the CS surface. But this change of n was acceptable. Thus, we inferred that the indigo carmine and the cationic organic inhibitors could adsorb simultaneously on the CS surface, and formed a more stable and excellent film to protect CS from corrosion in 0.5 M HCl solution.

From the polarization curves shown in Fig. 4, we could find that the anodic and cathodic current densities obviously decreased. And the icorr values for these three kinds of compound inhibitors decreased with an increase in their concentrations, as shown in Table 4. The oxidative dissolution of the working electrodes in the anodic region and the hydrogen reduction in the cathodic region were both weaker in the Tafel plots, which indicated that the anodic dissolution of CS and hydrogen evolution were both suppressed. Additionally, the Tafel slopes βc and βa for indigo carmine/TEA increased with an increase in their concentrations, and the Tafel slopes βc and βa for indigo carmine/BAB and indigo carmine/CTAB both decreased with increasing concentration, as shown in Table 4. The reason may be that the adsorption capability of indigo carmine is stronger than that of TEA, thus, more and more TEA molecules could be replaced by indigo carmine molecules as the concentration increased. So, the Tafel slopes change for indigo carmine/TEA was consistent with the Tafel slopes change for indigo carmine. Additionally, the change in βa was more than for βc for both indigo carmine/BAB and indigo carmine/CTAB compound inhibitors, which indicated that the anodic dissolution inhibition was stronger than the hydrogen evolution inhibition. However, in these experiments, the largest displacement of EcorrEcorr) was less than 20 mV (vs. SCE, Table 4). This displacement indicates that these three kinds of compound inhibitors all act as mixed-type inhibitors by inhibiting both hydrogen evolution and the CS dissolution reaction. In summary, these three kinds of compound inhibitors could effectively inhibit the corrosion of CS in 0.5 M HCl solution, and their protection efficiencies followed the order of indigo carmine/CTAB > indigo carmine/BAB > indigo carmine/TEA. The maximum protection efficiency was 98.5% for the indigo carmine/CTAB compound inhibitor.

3.1.4 Synergistic inhibition effect and the synergistic mechanism. As shown in Fig. 2 and 3, the single indigo carmine and other single cationic organic inhibitors were not effective corrosion inhibitors in 0.5 M HCl solutions (except CTAB, which possessed very good hydrophobicity). In particular, the single indigo carmine inhibitor and low concentrations of some of the cationic organic inhibitors (such as TEA and BAB) could result in an accelerated corrosion effect. The observed effects were also well correlated with the potentiodynamic polarization measurements (Fig. 2 and 3). The compound inhibitors of indigo carmine/TEA, indigo carmine/BAB and indigo carmine/CTAB all significantly decreased the corrosion activity. In particular, the Rct value for indigo carmine/BAB was greatly improved relative to those of the single indigo carmine inhibitor and single BAB inhibitor. To effectively evaluate the synergistic inhibition, the synergistic parameter (S) was calculated using the equation suggested by Aramaki and Hackerman:19,48
 
image file: c5ra25359d-t5.tif(16)
where η(1+2) = (η1 + η2) − (η1 × η2). η1, η2 and η1/2, are calculated from the protection efficiencies (ηi) of the potentiodynamic polarization measurements for indigo carmine, the cationic organics and the compound inhibitors of indigo carmine/cationic organics. A value of S > 1 indicates the synergistic behavior of the selected inhibitor combination. The synergy factor of indigo carmine/BAB inhibitor, calculated from the measured corrosion current densities, is significantly above 1 (S = 17.14) in this study. This demonstrates a high synergy between indigo carmine and the BAB inhibitor. A comparison of S for these three kinds of compound inhibitors allows them to be ordered by their synergistic inhibition effect as follows: indigo carmine/BAB > indigo carmine/TEA > indigo carmine/CTAB (on Table 4). The low synergy between indigo carmine/CTAB compound inhibitor may be because the hydrophobicity of CTAB was so effective as to conceal the synergy between indigo carmine and CTAB inhibitors.

In summary, the synergistic inhibition mechanism of the present work can be described as follows:

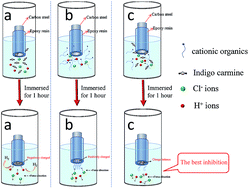
Firstly, the single indigo carmine could strongly adsorb on the CS surface through nitrogen atoms, sulfur atoms, oxygen atoms and aromatic ring groups. However, it was unable to protect the iron from corrosion in 0.5 M HCl solution, because the adsorption of indigo disulphonate ions on the CS surface could change the charge distribution of CS, resulting in its surface becoming negatively charged. This negatively charged surface would induce the discharge of H+ and accelerate corrosion (as shown in Fig. 6a). Secondly, the single cationic organics could inhibit the corrosion of CS in 0.5 M HCl by forming a complete and dense adsorption film when their concentrations were high enough (for instance, CTAB could adsorb on the steel surface and form a dense hydrophobic film). If the cationic organics adsorption film was broken, Cl ions would induce pitting corrosion of the steel surface, as Cl ions were gathered around the positively charged steel surface (as shown in Fig. 6b). As such, the single cationic organics could be described as “dangerous inhibitors”. Finally, the indigo disulphonate ions and organic cationic ions could be adsorbed evenly on the CS surface and, gradually, a dense film formed when the indigo carmine combined with the cationic organics. This co-adsorption would not break the charge distribution of the CS (as shown in Fig. 6c). Thus, the inhibition effect of the compound inhibitors is better than that of the single indigo carmine or other cationic organics inhibitors.


image file: c5ra25359d-f6.tif
Fig. 6 Schematic mechanism of the synergistic effect by the combination of indigo carmine and cationic organics.

3.2. Surface morphology observation and analysis

The experimental results provided evidence that the corrosion inhibition of indigo compound inhibitors are pretty efficient. Immersion experiments were used to verify these results. The CS sheets that were immersed in 0.5 M HCl solution, and in the presence of indigo carmine, CTAB and indigo carmine/CTAB inhibitors, and the corrosion processes, are shown in the corrosion process photograph (in Fig. 7). The CS sheets immersed in 0.5 M HCl solution and in the presence of indigo carmine inhibitors turned black after immersion for 2 h, which indicated that the CS sheets were corroded. After immersion for 48 h, these CS sheets turned brown and the solution became turbid, which indicated that the CS sheets were corroded badly and the dissolved iron had formed Fe(OH)3 (shown in Fig. 7b and c). But the CS sheets immersed in 0.5 M HCl in the presence of CTAB and indigo carmine/CTAB hardly changed, and their surfaces were still bright (shown in Fig. 7h and i).
image file: c5ra25359d-f7.tif
Fig. 7 The corrosion process photographs and SEM micrographs of the corrosion surfaces formed by the CS sheets immersed in various test solutions for 48 h: CS sheet (a) without immersion, and immersed in (b) 0.5 M HCl, (c) 0.5 M HCl with 0.0001 M indigo carmine, (d) 0.5 M HCl with 0.01 M TEA, (e) 0.5 M HCl with 0.02 M indigo carmine/TEA, (f) 0.5 M HCl with 0.02 M BAB, (g) 0.5 M HCl with 0.01 M indigo carmine/BAB, (h) 0.5 M HCl with 0.0002 M CTAB, and (i) 0.5 M HCl with 5 × 10⁻⁵ M indigo carmine/CTAB. (D), (E), (F), (G), (H) and (I) show the detailed views of (d), (e), (f), (g), (h) and (i), respectively.

The morphologies of the CS surfaces immersed in the corrosion solutions in the absence and presence of various inhibitors are displayed in SEM micrographs (on Fig. 7). It can be observed that the CS surface was corroded badly in the 0.5 M HCl solution (Fig. 7b). Porous structures could be found on the corroded surface, and the multiple holes may have been caused by the Cl ions erosion process.28,49 In contrast, a flatter and cracked structure was found on the CS surface that was corroded in 0.5 M HCl solution containing indigo carmine (Fig. 7c). This cracked structure indicated that the CS surface may have been corroded by the hydrogen evolution reaction.50 Additionally, the corroded surface showed a network-like pattern with a non-uniform distribution and irregular micro-cracks, which means that the indigo disulphonate anions were adsorbed on the CS surface and partly inhibited the corrosion. However, the negatively charged surface induced the discharge of H+ and caused the hydrogen evolution reaction on uncovered areas. It can be observed that the CS surface experienced pitting corrosion to different extents in the 0.5 M HCl solutions containing TEA, BAB and CTAB, and the corrosion process induced a porous structure in all cases (Fig. 7d, f and h). The damage to the CS followed the order TEA > BAB > CTAB. However, the damage to the CS sheet immersed in corrosion solutions containing BAB or CTAB was less than that to the CS surface immersed in the 0.5 M HCl solution. This means that the single cationic organic inhibitors (TEA, BAB and CTAB) could adsorb on the CS surface and protect it from corrosion. However, if the adsorption films of cationic organic inhibitors were not complete enough or broken, the CS could experience pitting corrosion in the corrosion solution containing cationic organic inhibitors. In contrast, the damage to CS sheets immersed in corrosion solutions containing compound inhibitors was always less than that to CS sheets immersed in solutions containing single cationic organic inhibitors (Fig. 7e, g and i). Comparing Fig. 7f and g, we could find that the pitting corrosion on the CS surface was obviously inhibited by the indigo carmine/BAB compound inhibitor. The inhibition effect of these three kinds of compound inhibitors followed the order: indigo carmine/CTAB > indigo carmine/BAB > indigo carmine/TEA, based on the surface morphology. This result is consistent with the electrochemical measurements.

3.3. The surface composition of the corrosion surface

As XPS is a useful method for determining the composition of a surface,51,52 the corroded surfaces have been analyzed in this study. The specimen used to collect the XPS spectra was the CS sheet that was immersed in the corrosion solution containing indigo carmine/CTAB (5 × 10⁻⁵ M) for 48 h. A wide-scan XPS spectrum of the test specimen is shown in Fig. 8a, which confirms the presence of indigo carmine (through the detection of C, N, O and S) on the corrosion surface. To determine the different components of each high-resolution XPS spectrum, we have fitted the peaks of the C, N, O, S and Fe elements, and checked the elements energy of XPS from the database.53,54 The peaks at 712.5 eV and 529.8 eV (Fig. 8b and d) may be caused by the presence of some Fe3+ and Fe2+ on the CS surface; a certain degree of oxidation of Fe most likely occurred during the preparation process, or some of the iron atoms were corroded during the immersion process (Fig. 8b). The peaks at 712.5 eV and 168.3 eV of Fe2(SO4)3 (Fig. 8b and f) indicated that the indigo carmine molecules could adsorb on the steel surface by chemisorption (forming a coordinate bond). The peaks at 284.7 eV for C[double bond, length as m-dash]O (Fig. 8c and d), 284.7 eV for aromatic rings (Fig. 8c) and 168.3–168.8 eV for sulfo groups (Fig. 8f) proved that the indigo carmine molecules had adsorbed on the CS surface. In addition, the peaks at 400.4 eV for NH4+ (Fig. 8e) and 285.7 eV for C–N (Fig. 8c) confirmed the presence of the CTAB molecules on the CS surface.
image file: c5ra25359d-f8.tif
Fig. 8 XPS spectra for the CS surface immersed in 0.5 M HCl containing indigo carmine/CTAB inhibitors. (a) Shows the wide-scan spectrum; (b), (c), (d), (e) and (f) are the high-resolution spectra of Fe 2p, C 1s, O 1s, N 1s and S 2p, respectively.

3.4. Theoretical study

3.4.1 Quantum chemical calculations. Quantum chemical calculations were used to investigate the molecular structural properties of indigo carmine molecules and three other kinds of cationic organic compound, and estimate the probable adsorption active sites.23,55 Due to the ionization and protonation, the indigo disulphonate anion of indigo carmine, TEAH of TEA, benzyl trimethyl ammonium cation of BAB and cetyltrimethylammonium cation of CTAB have been calculated by Gaussian 03 software in this study. The frontier molecular orbital surfaces distributions of the optimized molecules were visualized using Gaussian View 5.0 software, and are shown in Fig. 9. Some quantum chemical parameters, such as the highest occupied molecular orbital energy (EHOMO), the lowest unoccupied molecular orbital energy (ELUMO), the energy gap (ΔE = ELUMOEHOMO), the absolute electronegativity (χ), global hardness (γ) and the fraction of the transferred electrons (ΔN) are reported in Table 5.
image file: c5ra25359d-f9.tif
Fig. 9 The frontier molecular orbital (EHOMO, ELUMO) surfaces for the inhibitor molecules indigo carmine (a), CTAB (b), TEA (c), TEAH (d) and BAB (e).
Table 5 Quantum chemical parameters calculated using the B3LYP method with a 6-311G(d, p) basis set for the indigo disulphonate anion and other cationic organic inhibitors
Assembly molecules EHOMO (eV) ELUMO (eV) ΔE (eV) µ (Debye) χ = (I + A)/2 γ = (IA)/2 ΔN
Indigo carmine −0.719 1.493 2.212 0.350 −0.387 1.106 3.340
TEA −5.765 1.844 7.609 3.222 1.960 3.804 0.662
TEAH −11.349 −3.468 7.881 1.1766 7.409 3.941 −0.052
BAB −10.364 −4.215 6.148 5.957 7.290 3.074 −0.047
CTAB −8.956 −3.082 5.874 38.397 6.019 2.937 0.167


EHOMO is usually associated with the ability of a molecule to donate electrons, and a higher EHOMO molecule is more likely to donate electrons to a suitable acceptor with low energy. However, the ELUMO is associated with the ability of a molecule to accept electrons, and a lower EHOMO molecule is more likely to accept electrons. The energy gap (ΔE = ELUMOEHOMO), is a significant quantum chemical parameter that represents the adsorption reactivity tendency between an organic molecule and metal surface. Additionally, the adsorption energy will increase as the energy gap (ΔE = ELUMOEHOMO) decreases.56,57 Fig. 9a and c show the surfaces of the highest occupied molecular orbital covering the sulfonic groups of indigo carmine and the nitrogen atom of TEA, because the sulfonic groups and nitrogen atom are good electron-donating groups. This indicates that the indigo carmine and TEA molecules could adsorb on the iron surface through coordination. Due to the ionization of BAB and CTAB molecules in acid solution, the highest occupied molecular orbital surfaces cover the long carbon chain of CTAB and the benzyl group of BAB, not the ammonium group (Fig. 9b and e). This means that the capability of CTAB and BAB to donate electrons was much poorer. Comparing TEA with TEAH, we could find that the coverage area of the highest occupied molecular orbital was changed from the nitrogen atom to oxygen atoms (Fig. 9c and d). It therefore appears that protonation could change the molecular hybridization orbital. Table 5 shows that the EHOMO of these inhibitor molecules followed in the order of: indigo carmine ≫ TEA > CTAB > BAB > TEAH. This confirms that the capability of these inhibitor molecules to donate electrons followed the order of indigo carmine ≫ TEA > CTAB > BAB > TEAH. Fig. 9a shows the surfaces of the lowest unoccupied molecular orbital covered the whole indigo carmine molecule, which means that indigo carmine’s ability to accept electrons is much better. However, the EHOMO in Table 5 followed the order of BAB > TEAH > CTAB ≫ indigo carmine > TEA, due to the ionization and the protonation of TEA, BAB and CTAB. Ordering by the value of ΔE, as shown in Table 5, results in indigo carmine < CTAB < BAB < TEA < TEAH, which means that the adsorption capability of these molecules follows the order indigo carmine > CTAB > BAB > TEA > TEAH.

According to Koopmans’s theorem, EHOMO and ELUMO are related to the ionization potential (I) and the electron affinity (A) of the inhibitor molecules and the metal atoms,58,59 which are estimated by: I = −EHOMO and A = −ELUMO, respectively.60 Then, the values of χ and γ for the inhibitor molecules were calculated from eqn (17) and (18):61

 
image file: c5ra25359d-t6.tif(17)
 
image file: c5ra25359d-t7.tif(18)

Thus, the change in the number of electrons transferred (ΔN) is calculated by eqn (19):23,62

 
image file: c5ra25359d-t8.tif(19)
where the χFe and χinh are the absolute electronegativity of the iron atom and inhibitor molecules, and the γFe and γinh are the global hardness of the iron atom and inhibitor molecules. In this study, the theoretical values of χFe and γFe are taken as 7 eV and 0 eV.60,63 The calculated results are reported in Table 5. The ΔN values represent the inhibitive performance of the inhibitors resulting from electron donations. If ΔN < 3.6, the higher ΔN implies a higher electron donation capability and inhibition efficiency of the inhibitor molecules.64 It can be observed from Table 5 that the ΔN of indigo carmine and the three other kinds of cationic organic inhibitor molecules to the metal surface follows the order of indigo carmine ≫ TEA > CTAB > BAB > TEAH. It is in good agreement with the order of the protection efficiency (CTAB > BAB > TEA) except for indigo disulphonate anion of indigo carmine, which could change the charge on iron surface and accelerate corrosion because of the adsorption of indigo disulphonate anion.

3.4.2 Dynamic simulation. Molecular dynamics simulations have been used to further investigate the adsorption behavior of indigo carmine and other inhibitor molecules on the Fe (1 1 0) surface. The binding energy (Ebinding) was used to estimate the adsorption intensity of the inhibitor molecules on the Fe (1 1 0) surface when the simulation system reached thermal and energetic equilibrium. The binding energy in the solution simulation system can be calculated by eqn (20) and (21):
 
Eadsorption = Etotal − (Esurface+solution + Einhibitor+solution) + Esolution (20)
 
Ebinding = −Eadsorption (21)
where Etotal is the potential energy of the whole simulation system; Esurface+solution is the potential energy of the simulation system without the inhibitor and Einhibitor+solution is the potential energy of the simulation system without the CS surface; and Esolution is the potential energy of all of the water molecules, Cl ions and H3O+ ions. The calculated Ebinding, Eadsorption and the maximal experimental inhibition efficiencies of each inhibitor are listed in Table 6. And the equilibrium configuration of nine kinds of simulated system are shown in Fig. 10 and 11.
Table 6 Binding energies, diffusion coefficients and inhibition efficiencies (ηmax) of indigo carmine and its compound inhibitors
Inhibitors Eadsorption (eV) Ebinding (eV) Diffusion coefficient/(10−9 m2 s−1) ηmax (%)
H3O+ Cl
Indigo carmine −7.481 7.481 0.13737 0.082842 −202.7
TEA −3.439 3.439 0.098373 0.123883 39.3
Indigo carmine/TEA −11.333 11.333 0.081077 0.062967 76.4
BAB −3.220 3.220 0.064103 0.134607 62.1
Indigo carmine/BAB −10.660 10.660 0.06294 0.08728 95.2
CTAB −1.605 1.605 0.083885 0.090855 97.1
Indigo carmine/CTAB −9.256 9.256 0.04267 0.045315 98.3
TEAH −3.181 3.181 0.059927 0.134815
Indigo carmine/TEAH −10.791 10.791 0.100543 0.061465


image file: c5ra25359d-f10.tif
Fig. 10 The equilibrium configuration of indigo carmine adsorbed on an Fe (110) surface, and the radial distribution function between various main elements of indigo carmine molecule and Fe surface.

image file: c5ra25359d-f11.tif
Fig. 11 Equilibrium configuration of cationic organic molecules and their compound inhibitor molecules adsorbed on an Fe (1 1 0) surface: (a) TEA, (b) indigo carmine/TEA, (c) BAB, (d) indigo carmine/BAB, (e) CTAB, (f) indigo carmine/CTAB, (g) TEAH and (h) indigo carmine/TEAH.

It can be observed from Fig. 10 that the indigo carmine molecules adsorbed on the Fe (1 1 0) surface have a planar structure. And the Ebinding value for the indigo carmine molecule is 7.481 eV (Table 6), which is much bigger than the Ebinding value for the three other kinds of cationic organic molecules. This means that the adsorption capability of the indigo carmine molecule is much stronger than that of the three other kinds of cationic organic molecules. The basic molecule–molecule interaction types can be discerned by the typical bond lengths. For instance, the typical bond lengths for a van der Waals interaction are 5–10 Å, metal complexation bond lengths are 2–3 Å and H bond lengths are 2–3.5 Å, approximately.65,66 In general, the radial distribution function is an effective method for estimating the bond length. The x-axis value for the first peak always gives the bond length, and the peak area is identified as the coordination number. The chemisorption bond length is within the limits of 1–3.5 Å, while physisorption bond lengths are longer than 3.5 Å. In the equilibrium configuration of indigo carmine, the radial distribution function of the C, N, O and S atoms shows that the bond lengths of C–Fe, N–Fe, O–Fe and S–Fe are all less than 3.5 Å, notably, the O–Fe bond length is less than 3.0 Å (Fig. 10). This indicates that all of the atoms mentioned above could be coordinately adsorbed on the iron surface by donating π-electrons to the unoccupied d-orbital of iron to form coordinate bonds, as well as by accepting electrons from the d-orbital of iron to form anti-bonding orbital coordinate bonds.17,23,67 In consideration of the frontier molecular orbital of indigo carmine in Fig. 9a, we could infer that the sulfonic acid groups are the main active sites for adsorption between the indigo carmine molecule and the iron surface, and the existence of indoxyl groups could enhance this adsorption. Thus, we could conclude that the adsorption type of indigo carmine was chemisorption, and the adsorption intensity is strong.

From Fig. 11, we can find that most of the cationic organic molecules and their compound inhibitor molecules adsorbed on the Fe (1 1 0) surface have a planar structure (Fig. 11a, c and g). The CTAB molecules adsorbed on the Fe (1 1 0) surface have a vertical structure, because the long-chain part of CTAB’s structure is a hydrophobic group. In addition, the Ebinding for the single inhibitor molecules followed the order of indigo carmine ≫ TEA > BAB > TEAH > CTAB (Table 6). With the exception of CTAB’s position, this order of Ebinding is consistent with the order of the ΔN for indigo carmine and the three other kinds of cationic organic inhibitor molecules (indigo carmine ≫ TEA > CTAB > BAB > TEAH). This may be because the CTAB molecule can be adsorbed on the iron surface by its amino group and not the long carbon chain, but the surfaces of the highest occupied molecular orbital covered the long carbon group. Comparing the adsorption equilibrium configurations of TEA and TEAH molecules, the protonated amino group of TEAH molecule (–[NH2–R′]+) was far away from the iron surface (Fig. 11a and g), which possibly because of the electron-deficient nature of the protonated N atom. Thus the Ebinding for the TEAH molecule is smaller than that for the TEA molecule. Additionally, part of the TEA molecule could combine with indigo carmine due to the electrostatic attraction between the sulfonate group and H atom present in hydroxyl group of the TEA molecule. Thus, some of the TEAH molecules in the TEAH/indigo carmine compound inhibitor mixture will be replaced by TEA molecules. This means that the effect of TEAH molecule adsorption in balancing the charge on the CS surface will not be effective, due to the competitive adsorption of TEA molecules. That is why the corrosion inhibition effect of the indigo carmine/TEA compound inhibitor is not good. In order to analyze the synergy between the indigo carmine molecule and cationic organic molecules, we have compared the Ebinding values of the compound inhibitors and single inhibitors in Table 6. We can find that the Ebinding values of the compound inhibitors are bigger than the sums of the Ebinding values of the individual inhibitors (for example, the Ebinding for indigo carmine/TEA is bigger than sum of the Ebinding values for the single indigo carmine molecule and single TEA). This means that the adsorption capability of the compound inhibitors can be enhanced by a synergistic effect.

In order to investigate the mechanism behind the synergy of indigo carmine and the cationic organic compound inhibitors with molecular dynamics simulations, the diffusion coefficient (D) can be used to describe the migration rate of a corrosive species (H3O+ ions and Cl ions) in the simulation system. A small diffusion coefficient indicates greater hindrance of the simulation system and the weak reactivity of H3O+ ions and Cl ions, which reflects a high corrosion inhibition efficiency. The diffusion coefficient is defined as follows:66,68,69

 
image file: c5ra25359d-t9.tif(22)
 
image file: c5ra25359d-t10.tif(23)
where N is the number of target molecules, |Ri(t) − Ri(0)|2 is the mean-square displacement (MSD), and Ri(t) and Ri(0) are the positions of corrosive species at time t and 0, respectively. The MSD plots are shown in Fig. 12. The calculated diffusion coefficients of the H3O+ ions and Cl ions in the dynamic simulation systems are shown in Table 6.


image file: c5ra25359d-f12.tif
Fig. 12 Time evolution of the mean square displacements of corrosive species (H3O+ ions and Cl ions) in all of the dynamic simulation systems, (a) indigo carmine/TEA and TEA systems, (b) indigo carmine/BAB and BAB systems, (c) indigo carmine/CTAB and CTAB systems and (d) indigo carmine/TEAH and TEAH systems.

From Fig. 12 and Table 6, we can find that the D values for the H3O+ ions and Cl ions in the compound inhibitors simulation system were smaller than the D values for the H3O+ ions in the single indigo carmine inhibitor simulation system and the Cl ions in the single cationic organic inhibitors system. This means that the migration rates of the corrosive species (H3O+ ions and Cl ions) in the simulation system are both inhibited by the indigo disulphonate anion and other organic cation being simultaneously adsorbed on the iron surface and balancing the charge of the iron surface.

Also, we have investigated the surface concentration profiles of the corrosive species (H3O+ ions and Cl ions) in the dynamic simulation systems along the normal direction (0 0 1), and the results are shown in Fig. 13. It can be observed from Fig. 13 that the distribution of H3O+ ions and Cl ions in the compound inhibitors simulation system is farther from the iron surface than the distribution of H3O+ ions and Cl ions in the single indigo carmine simulation system and single cationic organic inhibitors simulation system, respectively. This means that the compound inhibitors consisting of indigo carmine and cationic organics could balance the charge of the iron surface, and keep the corrosive species (H3O+ ions and Cl ions) away from the iron surface. Thus, we can conclude that indigo carmine could cooperate with the cationic organic compounds to synergistically inhibit the corrosion of iron in 0.5 M HCl solution.


image file: c5ra25359d-f13.tif
Fig. 13 Surface concentration profiles of the corrosive species (H3O+ ions and Cl ions) in all of the dynamic simulation systems, all of which are along the normal direction (0 0 1): (a) indigo carmine/TEA and TEA systems, (b) indigo carmine/BAB and BAB systems, (c) indigo carmine/CTAB and CTAB systems and (d) indigo carmine/TEAH and TEAH systems.

4. Conclusions

This study demonstrated the superior synergistic corrosion inhibition effect between indigo carmine and three kinds of cationic organic compounds. The results confirmed that indigo disulphonate ions, derived from indigo carmine molecules, could adsorb strongly on a CS surface, but are unable to protect the iron from corrosion due to the negatively charged surface. However, the cooperation of indigo carmine and cationic organic compounds could effectively inhibit the corrosion of CS in 0.5 M HCl solution, for the indigo disulphonate anion and organic cation were simultaneously adsorbed on the CS surface and could balance the charge distribution of the CS surface. The indigo carmine/BAB compound inhibitor showed the best synergistic inhibition effect (S = 17.14), and its highest inhibition efficiency was 95.0%. Due to the hydrophobicity of CTAB, the indigo carmine/CTAB compound inhibitor showed the best inhibition effect (η = 98.5%), at a concentration of 5 × 10⁻⁵ M.

XPS spectra and SEM images revealing the morphologies of the CS samples corroborated the electrochemical measurements and showed evidence of the chemisorption of indigo carmine and the three kinds of cationic organic compounds on the CS surface. The micro-cracks and porosity featured in the micrographs may be used to discern hydrogen evolution corrosion and pitting corrosion caused by Cl ions, respectively.

Additionally, quantum chemical calculations and molecular dynamics simulations adequately confirmed that indigo carmine could cooperate with the cationic organic compounds to synergistically inhibit the corrosion of iron in 0.5 M HCl solution. Using the diffusion coefficient and the surface concentration profile are useful methods of investigating the synergistic corrosion inhibition effect in acid solution.

Acknowledgements

This work was funded by Guangxi Natural Science Foundation (2013GXNSFBA 019248) and the Research Fund for the Guangxi Higher Education (2013YB114).

References

  1. B. Zhang, C. He, C. Wang, P. Sun, F. Li and Y. Lin, Corros. Sci., 2015, 94, 6–20 CrossRef CAS.
  2. N. Soltani, M. Behpour, E. E. Oguzie, M. Mahluji and M. A. Ghasemzadeh, RSC Adv., 2015, 5, 11145–11162 RSC.
  3. I. B. Obot, E. E. Ebenso and M. M. Kabanda, J. Environ. Chem. Eng., 2013, 1, 431–439 CrossRef CAS.
  4. P. Roy, T. Maji, S. Dey and D. Sukul, RSC Adv., 2015, 5, 61170–61178 RSC.
  5. S. A. Umoren and M. M. Solomon, J. Ind. Eng. Chem., 2015, 21, 81–100 CrossRef CAS.
  6. E. E. Ebenso and E. E. Oguzie, Mater. Lett., 2005, 59, 2163–2165 CrossRef CAS.
  7. E. E. Oguzie, B. N. Okolue, C. E. Ogukwe and C. Unaegbu, Mater. Lett., 2006, 60, 3376–3378 CrossRef CAS.
  8. Y. Abboud, A. Abourriche, T. Saffaj, M. Berrada, M. Charrouf, A. Bennamara and H. Hannache, Desalination, 2009, 237, 175–189 CrossRef CAS.
  9. A. Singh, Y. Lin, W. Liu, S. Yu, J. Pan, C. Ren and D. Kuanhai, J. Ind. Eng. Chem., 2014, 20, 4276–4285 CrossRef CAS.
  10. E. E. Oguzie, C. Unaegbu, C. N. Ogukwe, B. N. Okolue and A. I. Onuchukwu, Mater. Chem. Phys., 2004, 84, 363–368 CrossRef CAS.
  11. M. Abdeli, N. P. Ahmadi and R. A. Khosroshahi, J. Solid State Electrochem., 2009, 14, 1317–1324 CrossRef.
  12. Z. Zhang, N. C. Tian, X. Y. Li, L. Zhang, L. Wu and Y. Huang, Appl. Surf. Sci., 2015, 357, 845–855 CrossRef CAS.
  13. R. E. Melchers, Corros. Sci., 2003, 45, 2609–2625 CrossRef CAS.
  14. Y. Y. Chen, H. J. Tzeng, L. I. Wei, L. H. Wang, J. C. Oung and H. C. Shih, Corros. Sci., 2005, 47, 1001–1021 CrossRef CAS.
  15. S. P. Li, J. Guo, S. W. Yang and X. L. He, J. Univ. Sci. Technol. Beijing, 2008, 30, 16–20 Search PubMed.
  16. H. Y. Mao, Q. W. Cai, H. B. Wu, C. F. Sun and J. M. Liang, Corros. Prot., 2013, 34, 499–502 CAS.
  17. Z. Zhang, N. Tian, L. Zhang and L. Wu, Corros. Sci., 2015, 98, 438–449 CrossRef CAS.
  18. M. J. Frisch, G. W. Trucks, H. B. Schlegel, G. E. Scuseria, M. A. Robb, J. R. Cheeseman, J. A. Montgomery Jr, T. Vreven, K. N. Kudin, J. C. Burant, J. M. Millam, S. S. Iyengar, J. Tomasi, V. Barone, B. Mennucci, M. Cossi, G. Scalmani, N. Rega, G. A. Petersson, H. Nakatsuji, M. Hada, M. Ehara, K. Toyota, R. Fukuda, J. Hasegawa, M. Ishida, T. Nakajima, Y. Honda, O. Kitao, H. Nakai, M. Klene, X. Li, J. E. Knox, H. P. Hratchian, J. B. Cross, C. Adamo, J. Jaramillo, R. Gomperts, R. E. Stratmann, O. Yazyev, A. J. Austin, R. Cammi, C. Pomelli, J. W. Ochterski, P. Y. Ayala, K. Morokuma, G. A. Voth, P. Salvador, J. J. Dannenberg, V. G. Zakrzewski, S. Dapprich, A. D. Daniels, M. C. Strain, O. Farkas, D. K. Malick, A. D. Rabuck, K. Raghavachari, J. B. Foresman, J. V. Ortiz, Q. Cui, A. G. Baboul, S. Clifford, J. Cioslowski, B. B. Stefanov, G. Liu, A. Liashenko, P. Piskorz, I. Komaromi, R. L. Martin, D. J. Fox, T. Keith, M. A. Al-Laham, C. Y. Peng, A. Nanayakkara, M. Challacombe, P. M. W. Gill, B. Johnson, W. Chen, M. W. Wong, C. Gonzalez and J. A. Pople, Gaussian, Inc., Wallingford CT, 2004.
  19. A. D. Becke, Phys. Rev. A: At., Mol., Opt. Phys., 1988, 38, 3098–3100 CrossRef CAS.
  20. C. Lee, W. Yang and R. G. Parr, Phys. Rev., 1988, 37, 785–789 CAS.
  21. A. D. Becke, Density-functional thermochemistry. III. The role of exact exchange, J. Chem. Phys., 1993, 98, 5648–5652 CrossRef CAS.
  22. Materials Studio, Revision 6.0, Accelrys Inc., San Diego, USA, 2011 Search PubMed.
  23. H. Zhao, X. Zhang, L. Ji, H. Hu and Q. Li, Corros. Sci., 2014, 83, 261–271 CrossRef CAS.
  24. M. A. Amin, K. F. Khaled, Q. Mohsen and H. A. Arida, Corros. Sci., 2010, 52, 1684–1695 CrossRef CAS.
  25. Y. Tang, L. Yao, C. Kong, W. Yang and Y. Chen, Corros. Sci., 2011, 53, 2046–2049 CrossRef CAS.
  26. M. A. Deyab, Int. J. Hydrogen Energy, 2013, 38, 13511–13519 CrossRef CAS.
  27. S. Thomas, N. V. Medhekar, G. S. Frankel and N. Birbilis, Curr. Opin. Solid State Mater. Sci., 2015, 19, 85–94 CrossRef CAS.
  28. M. A. Deyab, J. Power Sources, 2013, 242, 86–90 CrossRef CAS.
  29. R. Solmaz, E. Altunbaş and G. Kardaş, Mater. Chem. Phys., 2011, 125, 796–801 CrossRef CAS.
  30. A. Yousefi, S. Javadian, N. Dalir, J. Kakemam and J. Akbari, RSC Adv., 2015, 5, 11697–11713 RSC.
  31. M. A. Deyab, J. Power Sources, 2014, 268, 765–770 CrossRef CAS.
  32. F. Bentiss, M. Lebrini and M. Lagrenée, Corros. Sci., 2005, 47, 2915–2931 CrossRef CAS.
  33. X. Li, S. Deng and X. Xie, Corros. Sci., 2014, 81, 162–175 CrossRef CAS.
  34. H. Ashassi-Sorkhabi and E. Asghari, Electrochim. Acta, 2008, 54, 162–167 CrossRef CAS.
  35. B. D. Mert, A. O. Yüce, G. Kardaş and B. Yazıcı, Corros. Sci., 2014, 85, 287–295 CrossRef CAS.
  36. B. Hirschorn, M. E. Orazem, B. Tribollet, V. Vivier, I. Frateur and M. Musiani, J. Electrochem. Soc., 2010, 157, C458 CrossRef CAS.
  37. B. Hirschorn, M. E. Orazem, B. Tribollet, V. Vivier, I. Frateur and M. Musiani, Electrochim. Acta, 2010, 55, 6218–6227 CrossRef CAS.
  38. C. H. Hsu and F. Mansfeld, Corrosion, 2001, 57, 747–748 CrossRef CAS.
  39. E. A. Flores, O. Olivares, N. V. Likhanova, M. A. Domínguez-Aguilar, N. Nava, D. Guzman-Lucero and M. Corrales, Corros. Sci., 2011, 53, 3899–3913 CrossRef CAS.
  40. A. A. Hermas and M. S. Morad, Corros. Sci., 2008, 50, 2710–2717 CrossRef CAS.
  41. E. McCafferty and N. Hackerman, J. Electrochem. Soc., 1972, 119, 146–154 CrossRef CAS.
  42. E. McCafferty, Introduction to Corrosion Science, Springer, New York, Dordrecht, Heidelberg, London, New York, 2010 Search PubMed.
  43. A. Kosari, M. H. Moayed, A. Davoodi, R. Parvizi, M. Momeni, H. Eshghi and H. Moradi, Corros. Sci., 2014, 78, 138–150 CrossRef CAS.
  44. M. K. Pavithra, T. V. Venkatesha, M. K. Punith Kumar and H. C. Tondan, Corros. Sci., 2012, 60, 104–111 CrossRef CAS.
  45. M. Finšgar, Corros. Sci., 2013, 72, 82–89 CrossRef.
  46. A. El Bribri, M. Tabyaoui, B. Tabyaoui, H. El Attari and F. Bentiss, Mater. Chem. Phys., 2013, 141, 240–247 CrossRef CAS.
  47. M. A. Abu-Dalo, N. A. F. Al-Rawashdeh and A. Ababneh, Desalination, 2013, 313, 105–114 CrossRef CAS.
  48. S. Kallip, A. C. Bastos, K. A. Yasakau, M. L. Zheludkevich and M. G. S. Ferreira, Electrochem. Commun., 2012, 20, 101–104 CrossRef CAS.
  49. S. Munktell, M. Tydén, J. Högström, L. Nyholm and F. Björefors, Electrochem. Commun., 2013, 34, 274–277 CrossRef CAS.
  50. F. El-Taib Heakal, O. S. Shehata, N. S. Tantawy and A. M. Fekry, Int. J. Hydrogen Energy, 2012, 37, 84–94 CrossRef CAS.
  51. Z. Zhang, S. Chen, Y. Li, S. Li and L. Wang, Corros. Sci., 2009, 51, 291–300 CrossRef CAS.
  52. A. Alagta, I. Felhösi, I. Bertoti and E. Kálmán, Corros. Sci., 2008, 50, 1644–1649 CrossRef CAS.
  53. http://www.lasurface.com/database/elementxps.php, 12 October 2015.
  54. http://srdata.nist.gov/xps/Default.aspx, 12 October 2015.
  55. R. Yıldız, Corros. Sci., 2015, 90, 544–553 CrossRef.
  56. L. Herrag, B. Hammouti, S. Elkadiri, A. Aouniti, C. Jama, H. Vezin and F. Bentiss, Corros. Sci., 2010, 52, 3042–3051 CrossRef CAS.
  57. I. B. Obot and N. O. Obi-Egbedi, Corros. Sci., 2010, 52, 198–204 CrossRef CAS.
  58. H. Tian, W. Li, K. Cao and B. Hou, Corros. Sci., 2013, 73, 281–291 CrossRef CAS.
  59. M. A. Hegazy, A. M. Badawi, S. S. Abd El Rehim and W. M. Kamel, Corros. Sci., 2013, 69, 110–122 CrossRef CAS.
  60. F. Zhang, Y. Tang, Z. Cao, W. Jing, Z. Wu and Y. Chen, Corros. Sci., 2012, 61, 1–9 CrossRef CAS.
  61. K. Zhang, B. Xu, W. Yang, X. Yin, Y. Liu and Y. Chen, Corros. Sci., 2015, 90, 284–295 CrossRef CAS.
  62. G. Xia, X. Jiang, L. Zhou, Y. Liao, M. Duan, H. Wang, Q. Pu and J. Zhou, Corros. Sci., 2015, 94, 224–236 CrossRef CAS.
  63. A. Kokalj, Chem. Phys., 2012, 393, 1–12 CrossRef CAS.
  64. H. Ju, Z.-P. Kai and Y. Li, Corros. Sci., 2008, 50, 865–871 CrossRef CAS.
  65. A. Kühnle, Curr. Opin. Colloid Interface Sci., 2009, 14, 157–168 CrossRef.
  66. Z. Xu, S.-L. Yuan, H. Yan and C.-B. Liu, Colloids Surf., A, 2011, 380, 135–142 CrossRef CAS.
  67. Z. Cao, Y. Tang, H. Cang, J. Xu, G. Lu and W. Jing, Corros. Sci., 2014, 83, 292–298 CrossRef CAS.
  68. Y. Yan, X. Wang, Y. Zhang, P. Wang, X. Cao and J. Zhang, Corros. Sci., 2013, 73, 123–129 CrossRef CAS.
  69. A. Guo, G. Duan, K. He, B. Sun, C. Fan and S. Hu, Comput. Theor. Chem., 2013, 1015, 21–26 CrossRef CAS.

This journal is © The Royal Society of Chemistry 2016
Click here to see how this site uses Cookies. View our privacy policy here.