 Open Access Article
Creative Commons Attribution 3.0 Unported Licence
Analytical solution for transient electroosmotic flow in a rotating microchannel
Behnam Gheshlaghi,
Hadi Nazaripoor,
Aloke Kumar and
Mohtada Sadrzadeh*
Department of Mechanical Engineering, 10-367 Donadeo Innovation Center for Engineering, University of Alberta, Edmonton, AB T6G 1H9, Canada. Fax: +1 780 492-2200; Tel: +1 780 492-8745
First published on 29th January 2016
Abstract
An analytical solution is developed for the unsteady flow of fluid through a parallel rotating plate microchannel, under the influence of electrokinetic force using the Debye–Hückel (DH) approximation. Transient Navier–Stokes equations are solved exactly in terms of the cosine Fourier series using the separation of variables method. The effects of frame rotation frequency and electroosmotic force on the fluid velocity and the flow rate distributions are investigated. The rotating system is found to have a damped oscillatory behavior. It is found that the period and the decay rate of the oscillations are independent of the DH parameter (κ). A time dependent structure of the boundary layer is observed at higher rotational frequencies. Furthermore, the rotation is shown to generate a secondary flow and a parameter is defined (β(t)) to examine the ratio of the flow in the y and x directions. It showed that both the angular velocity and the Debye–Hückel parameters are influential on the induced transient secondary flow in the y direction. At high values of the Debye–Hückel parameter and the rotation parameter the flow rates in the x and y directions are found to be identical. The analytical solution results are found to be in good agreement with the numerical method results and previously published work in this field.
Introduction
Flow through microchannels has become one of the most important research areas in recent years due to the unique phenomena occurring at the microscale level such as the development of a thin electric diffuse layer, called electrical double layer (EDL).1–6 The thickness of the EDL is comparable with the size of the microchannel so the length scales of the electrostatic interactions enable the development of many high-impact technologies in the area of electrokinetic transport in microchannels. In such technologies, electroosmotic flow (EOF) is the prevalent phenomenon for the transport of small volumes of aqueous solutions when an electric field is applied across a microchannel with charged walls.7 The electrical forces on the EDL near the interface of a solid surface and an electrolyte solution generate a fluid flow.8,9The characteristics of EOF in microchannels are typically examined by solving continuity and momentum equations in the presence of an electrical body force given by the Poisson–Boltzmann (PB) equation. These equations have been analytically solved for various geometries, flow properties and electrolyte solution characteristics using the Debye–Hückel (DH) approximation.10–18 This approximation can be used for small magnitudes of wall zeta-potential (<0.025 V) which makes the PB equation linear, thus leading to an analytical and explicit expression of the potential profile.
Levine et al.11 analytically solved the steady state problem of electrokinetic flow in a fine cylindrical capillary considering the DH approximation. This study provided a more precise calculation of the power requirements for pumping electrolytes through fine capillaries. Burgreen and Nakache10 analytically studied electrokinetic laminar steady flow in a very thin rectangular channel without the DH approximation. Their analysis provided a solution for cases of high ionic energy and a small electrokinetic radius. Hsu et al.12 theoretically studied the flow of an electrolyte solution through an elliptical microchannel to simulate the flow of a fluid in a vein. They considered a time independent spatial variation for the liquid velocity with different types of boundary conditions on the channel wall. In their analysis, they didn’t consider any assumption regarding the thickness of the double layer or the level of the electrical potential in order to present a more realistic description for biological systems. They also reported that the effects of boundary conditions are more apparent when the size of a microchannel decreases. EOF in a human meridian was studied by Sheu et al.13 through a numerical model considering a steady state creeping flow for tissue fluid motion. The tissue fluids contain ions and nutrients and they interact with the blood in the capillary vessel through a complex nonlinear electro-osmosis transport process. EOF in microchannels in the presence of thermal effects has also attracted much attention. Chen15 presented analytical expressions for the velocity and the temperature distributions of a fully-developed non-Newtonian fluid flow in a microchannel subjected to heat flux at the boundary conditions. Das and Chakraborty16 obtained closed form expressions for the velocity and temperature distributions of steady and fully developed flow of a power-law fluid. They examined the effect of non-Newtonian parameters on flow behaviour.
In all the above mentioned studies, electrokinetic flow (more specifically EOF) was applied as the only means for controlling the flow of liquids in microfluidic channels.19 A plug-like velocity profile along with easy controllability are the main characteristics of EOF in microchannels. However, electrokinetic pumping suffers from drawbacks so researchers have been directed toward techniques for generating a secondary flow. First, physicochemical properties, such as ionic strength and pH, may affect the pumping performance. For example, excessive Joule heating (the process by which the passage of an electric current through a conductor releases heat) prohibits pumping of liquids with high ionic strengths.20 Therefore, it may be difficult or impossible to use EOF to pump biological fluids, such as blood and urine.21 Second, electrokinetic pumping requires high-voltage supplies which may have adverse safety effects. Third, electrokinetic pumping only works for fluids without any trapped bubbles in the microchannels. Finally, due to Joule heating, EOF cannot be used for high flow rates (>1 μL s−1) in wide channels (>1 μm).21 A simple and safe alternative for controlling the flow of liquids in microfluidic channels is based on centrifugal force which is not sensitive to the chemical properties of the liquid. This system can also be applied for liquids with trapped bubbles and a wide range of channel sizes. In a centrifugal system, the fluid spatial and temporal controls have to be incorporated over the position of the fluids in the micro-channels.
Duffy et al.21 conducted an experimental investigation on the effect of centrifugal force on the micro-flow transport through microscopic channels fabricated in a plastic disk. The fluid was pumped outward using centrifugal force due to the rotation of the disk at 60–3000 rpm. They applied this method to pump biological fluids, such as blood and urine, since the driving force for the fluid flow was no longer sensitive to the physicochemical properties of the fluids such as pH and ionic strength. Chang and Wang22 investigated steady state rotating EOF over an infinite plate and inside a rectangular channel using the DH approximation for the charge distributions. They have shown that, the speed of rotation and the electrokinetic width are the most important parameters affecting the steady flow in a microchannel. In addition, they have demonstrated that when the speed of rotation increases, axial and transverse flows vanish and the entire system forms a rigid body rotation. Xie and Jian23 analysed the rotating EOF of power-law fluids at high zeta potentials in a microchannel. They applied the nonlinear PB equation for the EDL potential distribution. Using the finite difference method, they have numerically computed the rotating EOF velocity profiles for non-Newtonian fluids. However, the velocity profiles in their study are only computed for the steady-state conditions. Li et al.24 continued this study for the third grade fluids. They used the perturbation method to approximately obtain the solutions by assuming a slight non-Newtonian behaviour. Recently, Ng and Qi25 presented a more detailed study on electro-osmotic flow in rotating rectangular microchannels. They considered the same steady state problem as in ref. 22 to represent the effect of the channel width and different combination of wall charges on the Ekman-EDL, flow structure and flow rate.
In this study an analytical solution is developed for transient electroosmotic flow in a rotating microchannel. To the best of the authors’ knowledge, this time dependent behaviour has not been reported in an exact closed-form series solution. First, a general solution of the problem is obtained via the superposition and separation of variables techniques. By using a cosine Fourier series expansion, the governing complex partial differential equation (PDE) was solved to yield a closed-form solution. Next, the analytical solutions for the velocity and flow rate were applied to some examples. Structures of the boundary layer at higher rotational frequencies were studied and the rotational induced secondary flows are discussed. Moreover, transient secondary flow in the y direction is shown to be dependent on angular velocity and the Debye–Hückel parameters. Finally, the analytical solution results were compared with numerical solutions from Mathematica and previously published results.
Problem formulation and solution procedure
A. Electro-osmotic rotating microchannel flow equations and boundary conditions
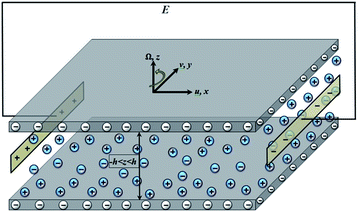
The geometry for the present analysis is shown in Fig. 1. It consists of two parallel plates separated by a distance of 2h. The bottom and top plate are located at z = −h and z = h, respectively.The basic field equations governing the flow of an incompressible fluid between two parallel walls of a microchannel are the continuity equation and the modified Cauchy equation given by
| ∇·u* = 0 | (1.a) |
 | (1.b) |
To find the electric potential distribution within the EDL the Poisson–Nernst–Planck (PNP) model is considered. The species conservation equation can be written as:
 | (2) |
 and
and  are the concentration numbers of the free charges in the fluid, e is the elementary charge, m± is the mobility, ψ* is the electric potential in the fluid, kB is the Boltzmann constant, and T is the absolute temperature. By subtracting the positive and negative number concentrations the following equation is obtained:
 | (3) |
 and
and  . The electrical conductivity of the electrolyte (σ) is found based on the molar conductivity of the solution,8 σ = 1000MσM. Substituting eqn (3) into eqn (2) yields:8,28–30
 | (4) |
 | (5) |
The term, ρe is the Boltzmann distribution of the net electric charge density near to the charged walls described as31
 | (6) |
In the present study, it is assumed that the wall electrical potential is small (ψ = 10 ≤ 25 mV) compared to the thermal potential of the charged species (|eξψ| ≤ kBT). Hence, the DH linearization principle (sinh(A) ≈ A)8,32 can be applied to obtain the following simpler linear relation:
 | (7) |
 is the DH parameter and it is the inverse of the Debye length (λD). It should be noted that, the DH approximation can be used when the Debye thickness is small but finite, i.e., for h/λD ≤ 103.32
Scaling factors are defined to simplify the analysis procedure as follows:
 | (8) |
Applying these scaling factors to eqn (1.b) and (7) along with considering the no-slip (zero velocities) boundary conditions on the channel walls, the following dimensionless governing equations are obtained in the x and y directions:
 | (9.a) |
 | (9.b) |
 | (10) |
To facilitate solutions of eqn (9.a) and (9.b), a complex function of χ(z, t) = u(z, t) + iv(z, t) with i = −1 was used. Hence, the hydrodynamic equations (eqn (9.a) and (9.b) can be written as a single complex partial differential equation as follows:
 | (11) |
B. Solution procedure
To find the ‘analytical’ solution of the complex PDE described in eqn (11), the superposition property is used:| χ(z, t) = χ1(z) + χ2(z, t) | (12) |
 | (13) |
 | (14) |
Applying the corresponding boundary conditions to the differential equation eqn (13), yields the steady state component of the velocity profile as22 follows:
 | (15) |
Eqn (14) is solved using the separation of variables method by assuming χ2(z, t) = Z(z)T(t), with Z(z) and T(t) being the spatial and temporal functions, respectively.
The new form for χ2(z, t) is substituted into eqn (14) to obtain the following separated ordinary differential equations (ODEs) for z and t:
 | (16) |
A solution of eqn (16) for Z(z) satisfying its boundary conditions Z(1) = Z(−1) = 0 can be assumed to take the form Z(z) = cos(λnz) with λn = (2n + 1)π/2. Also, the exact solution for T(t) in eqn (16) is as follows:
 | (17) |
 | (18) |
Next, the initial condition requires χ2(z, 0) = −χ1(z) and the coefficient Cn is determined as
Finally, the solution for χ(z, t) is:
 | (19) |
Integrating eqn (19) with respect to z leads to the following expression for the normalized complex volume flow rate per width:
 | (20) |
Terms, Qx(t) and Qy(t) are the transient flow rates in the x and y direction, respectively. Finally, β(t) = tan−1[Qy(t)/Qx(t)] is defined as a parameter representing the rotationally induced transient secondary flow in the y direction.
The solution represented in eqn (19) goes through three stages of development. Firstly, when ωt ≪ 1, the Coriolis force in the momentum eqn (9) is small compared to the stress gradient. Using the relationship eiωt = cos(ωt) + i![[thin space (1/6-em)]](https://www.rsc.org/images/entities/char_2009.gif) sin(ωt) at this stage, eqn (19) is re-written as follows:
sin(ωt) at this stage, eqn (19) is re-written as follows:
 | (21) |
At this stage, the solution is related to a non-rotating transport accelerated by a constant stress. Next, at longer times, the Coriolis force deflects the flow towards steady-state conditions. The solution undergoes damped inertial oscillations near the steady-state conditions. Finally, after a long time, for ωt ≫ 1 momentum completely diffuses to the microchannel flow. At this stage, the velocity field in the microchannel is at the final phase of inertial oscillations, which are damped by the viscous stress gradient. Therefore, the inertial oscillations are dissipated and one may use the first unsteady term of solution in eqn (19) for a long time solution, as represented in the literature.22
Results and discussion
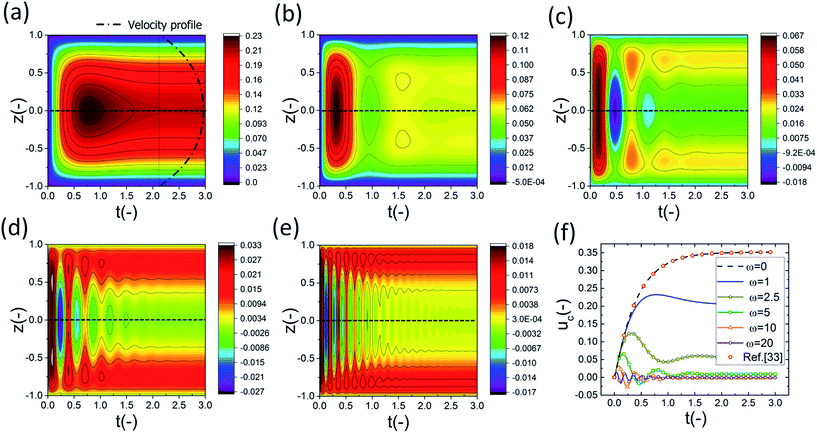
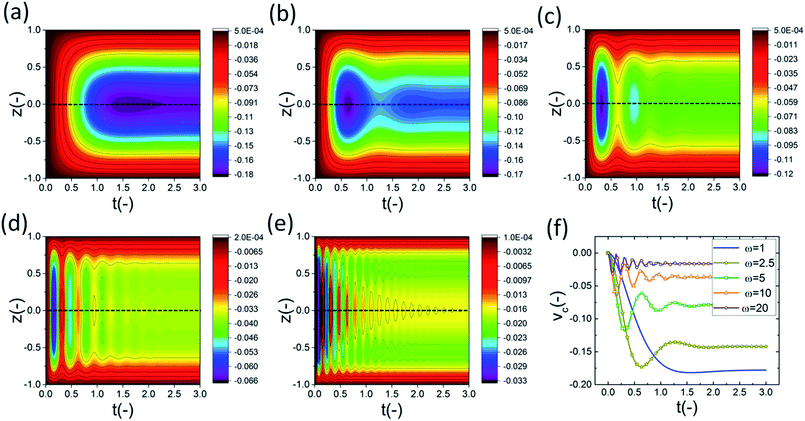
To illustrate the nature and general behaviour of the analytical solution, some numerical examples are considered in this section. The variation of the dimensionless velocity field (u(z, t)) as a function of time for different values of the DH parameter (κ) and dimensionless angular velocity (ω) are discussed using contour plots. Then, the effects of κ and ω on the evolution of rotationally induced secondary flow in the y direction are investigated by examining β(t). The fluid experiences a force imparted due to EOF and the frame rotation influences the flow velocity field with centrifugal force. In order to find the overall transient signature of the flow both of these two factors and their relative strengths must be included. However, we note that the oscillation characteristic of the flow, is appropriately described using the rotation parameter (ω), apart from the DH parameter (κ). In all the numerical results, a truncation constant of n = 5 was found to yield satisfactory results.2-D dimensionless contour plots of velocity evolution (x-component, u(z, t)) and the centre-line velocity profile versus time are shown in Fig. 2. To investigate the influence of rotation, different values for the dimensionless rotation parameter ω = 1.0, 2.5, 5.0, 10 and 20 are used. The transient centre-line velocity is also plotted to have a better comparison of the velocity magnitude and behaviour at the centre of the channel at various ω values. In all these figures, the horizontal axis is the dimensionless time parameter (0 < t < 3).
Results show that, as the frequency of rotation increases, the oscillatory behaviour of the flow field increases too. Generally, as is observed in Fig. 2a–e, the values and ranges of the velocity in the x-direction are reduced as the angular velocity increases. This is attributed to the effects of ω on the initiation of the secondary flow or the y-component of the flow.22 It should be noted that, the velocity is positive in the whole cross-section of the channel when ω = 1, whereas when increasing the ω, negative values are also observed in the velocity contour plots. This could be related to the fact that higher rotational centrifugal force pushes the flow back in the x-direction. The reduction of the centre-line velocity, as shown in Fig. 2f, confirms these observations. As is seen, the velocity at the centre is reduced when the frequency of rotation increases and becomes almost zero at ω = 20. Furthermore, the position of the maximum velocity moves from the centre of the microchannel toward the walls when ω increases. The same trend was also reported by Chang and Wang.22
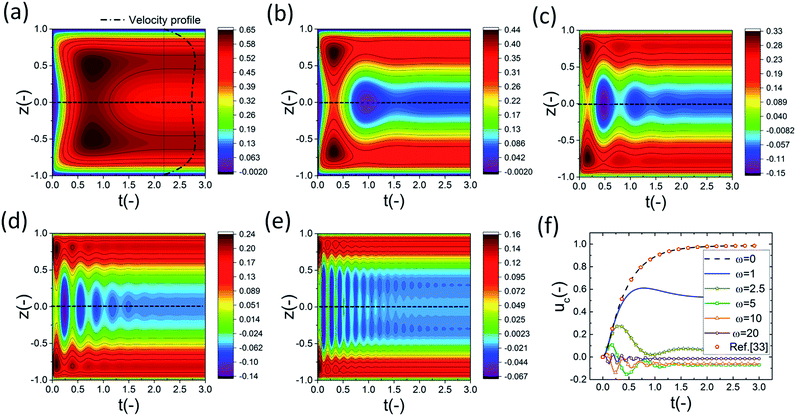
In Fig. 3, the transient 2-D dimensionless velocity u(z, t) and the centre-line velocity profile are plotted for κ = 5 for the same range of angular velocities as in Fig. 2. As is observed, the oscillatory behaviour of the fluid flow didn’t change when increasing the DH parameter. According to eqn (17), the period of the velocity oscillations is equal to π/ω, regardless of the DH parameter. At higher rotational frequencies, the structure of the boundary layer is observed. The boundary layer structure is found to be time dependent in the present work which was not noticed in earlier studies.22,25
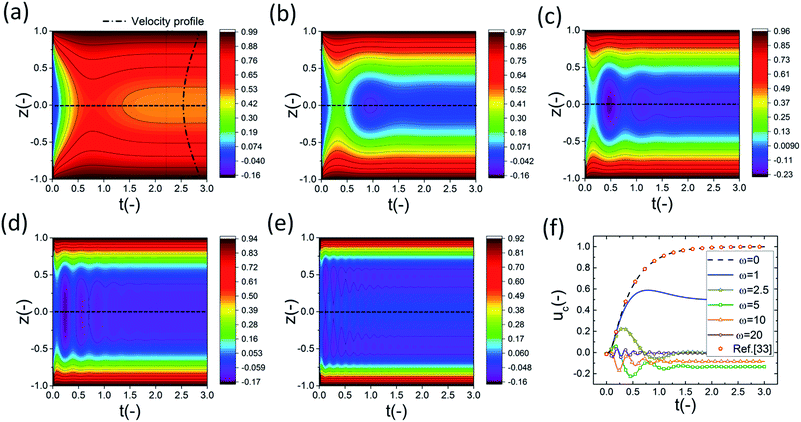
However, it is clear that the velocity magnitude increased when increasing the DH parameter. At higher κ values the effect of the induced electroosmotic forces (i.e., body force per unit volume on the fluid) becomes more influential, thus increasing the fluid velocity in the x-direction. Also, the effect of ω on u(z, t) is dampened at higher κ values. It becomes more evident when we compare the ratios of the maximum velocity represented on the range bars at different angular velocities. For example, umax at ω = 1.0 over umax at ω = 2.5 for κ = 1 and κ = 5 is 1.92 and 1.48, respectively. In order to examine the effect of a large value DH parameter on the x-component of the 2-D dimensionless velocity pattern and the centre-line velocity profile, κ was set at 1000 and the results are presented in Fig. 4. As shown, there is a small change in the range of the velocity with the change in ω. This is due to the significant effects of the electroosmotic forces at high κ values. Here, it must be noted that, to avoid inconsistency in using the DH approximation we assumed κ ≤ 103 as mentioned in the problem formulation section. The ratio of umax at ω = 1.0 over umax at ω = 2.5 in this case is about 1.0.
From Fig. 2–4 and eqn (17) it can be concluded that the period of the velocity oscillations is constant (π/ω) and the rate of decay of oscillations is λn2 which is independent of the DH parameter. The inertial oscillations are dissipated (i.e., third stage of development) through momentum diffusion. The results related to the transient electroosmotic flow in a non-rotating microchannel are plotted for three DH parameters (κ = 1, 5 and 1000) in Fig. 2f and 4f. As is observed, there is an excellent agreement between our results and the literature data.33 Compared to the conventional laminar flows, one of the most important characteristics of electro-osmosis flow is the front plug-like profile. To show this feature, we have plotted the velocity profiles in the steady-state part of Fig. 2a and 4a as well (for ω = 1.0). One can clearly see the plug-like profile especially when the Debye–Hückel parameter (κ) increases.
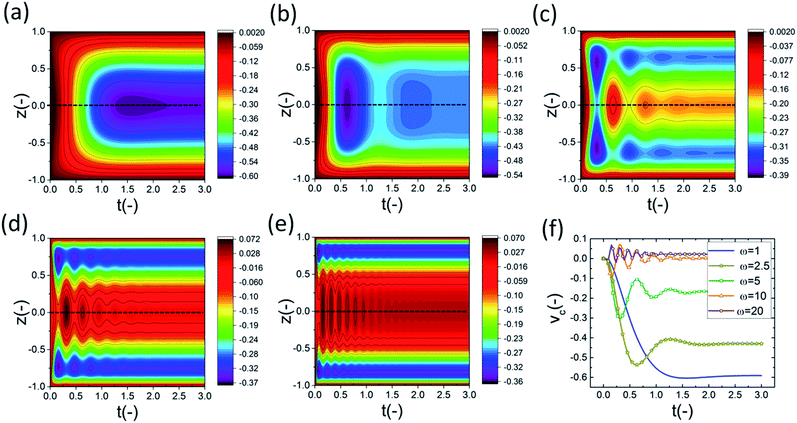
In Fig. 5, the transient 2-D dimensionless velocity evolution in the y-direction (v(z, t)) and the centre-line velocity (Vc) profiles versus time are presented for κ = 1 and various dimensionless angular velocities, ω = (a) 1.0, (b) 2.5, (c) 5.0, (d) 10, and (e) 20. The time interval is 0 < t < 3. The velocity in the y-direction is also observed to follow an oscillatory behaviour. However, the most important distinction between u and v is that for all the positive values of ω and κ, the sign of the velocity in the y-direction is always negative. This means that the direction of the induced secondary flow is always −y.
The variations of the y-component velocity and centre line velocities for κ = 5 and κ = 1000 were also investigated and the results are presented in Fig. 6 and 7, respectively. The most important distinctions are as follow.
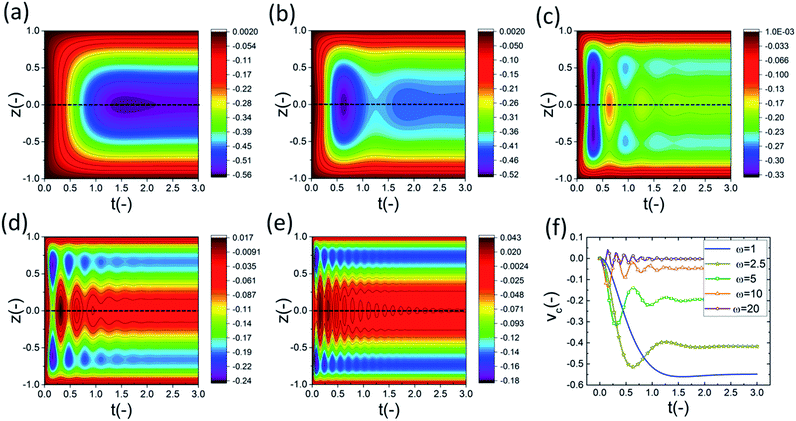 | ||
| Fig. 6 2-D dimensionless velocity evolution v(z, t) for κ = 5. Dimensionless angular velocities, ω = (a) 1, (b) 2.5, (c) 5.0, (d) 10, and (e) 20, and (f) Vc centre-line velocity profile versus time. | ||
Higher rotation frequency leads to more oscillatory behaviour of the flow velocity. Also, velocity gets some positive values when the DH parameter increases. This is directly linked to the effect of the driving force of the electroosmotic forces at high κ values on the y-component of the velocity field. Furthermore, as the rotation frequency increases the probability of boundary layer initiation increases too which is in full agreement with previous reports.22,25
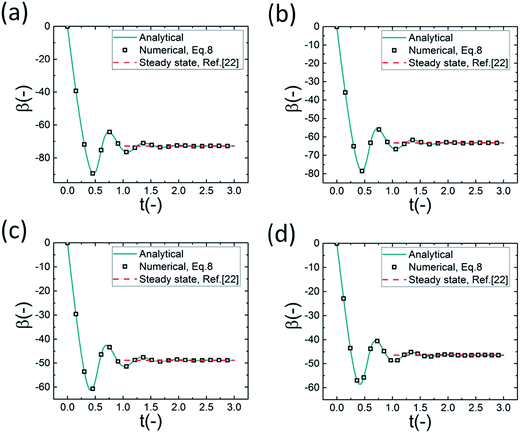
Fig. 8 shows the evolution of β over time (0 < t < 3) for κ = 1000 with different dimensionless angular velocities, ω = (a) 0.1, (b) 1.0, (c) π, and (d) 5.0. It is indicated that ω has a noticeable effect on the oscillatory behaviour of the flow. Smaller values of ω led to an almost non-oscillatory behaviour for β(t) which was seen before for the velocity behaviour. As shown, the value of β(t) increases significantly with the increase of ω. This means that, physically, the secondary induced flow is enhanced as the frequency of rotation increases. Also, the secondary induced flow parameter varies most rapidly with smaller values of ω which is in full agreement with the findings of Chang and Wang.22
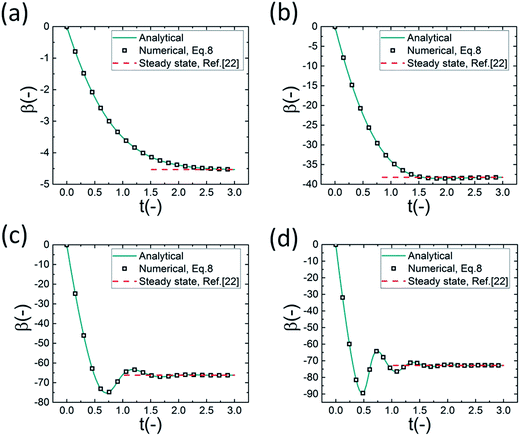 | ||
| Fig. 8 Evolution of β with time for κ = 1000 with different dimensionless angular velocities, ω = (a) 0.1, (b) 1, (c) π, and (d) 5. | ||
Fig. 9 shows the evolution of β over time (0 < t < 3) for ω = 5 with different DH parameters, κ = (a) 1.0, (b) 5.0, (c) 50, and (d) 1000. It is clear that increasing the DH parameter (κ) leads to a decrease in the value of β(t). For the large values of κ, β(t) gradually approaches 45. This means that for large κ, equal flows in both the x and y directions are obtained which matches well with the Chang and Wang calculations to generate Fig. 8 in their study.22 The governing equations are also solved numerically using Mathematica. As can be seen in Fig. 8 and 9, the exact analytical solution results are in very good agreement with those obtained through numerical computation. Moreover, as indicated in Fig. 8 and 9, it should be pointed out that the effect of the angular velocity gradually fades as the momentum diffusion increases which is also observed in Fig. 1. As a result, β(t) approaches its steady state value, as reported by Chang and Wang,22 when the time is long enough.
Conclusions
In the present paper, the dynamics of rotationally induced secondary flow in the EOF between two parallel plates have been analytically studied. A general series solution expression for the non-dimensional velocity field and flow rate has been derived through the separation of variables technique. The effect of the Debye–Hückel parameter (κ) and the dimensionless angular velocity (ω) on the velocity contour plots and parameter β(t) has been examined. The main contribution of this study is providing a closed-form solution for the transient EOF in a rotating microchannel. It is found that the oscillatory behaviour of the fluid flow is only related to ω while the DH parameter only changes the amplitude of the velocity field.A time dependent structure of the boundary layer was observed at higher rotational frequencies. The effects of ω on the initiation of the secondary flow were examined. Furthermore, the β(t) parameter was investigated to show the effect of the angular velocity and the Debye–Hückel parameter on the induced transient secondary flow in the y direction. It is found that when the Debye–Hückel parameter and the rotation parameter are high, β(t) oscillates near 45 degrees implying identical flow rates in the x and y directions. Moreover, excellent agreement was found between the analytical results and the numerical results obtained using Mathematica.
References
- J. Chen, M. Chu, K. Koulajian, X. Y. Wu, A. Giacca and Y. Sun, Biomed. Microdevices, 2009, 11, 1251–1257 CrossRef CAS PubMed.
- D. Bhatta, A. A. Michel, M. Marti Villalba, G. D. Emmerson, I. J. G. Sparrow, E. A. Perkins, M. B. McDonnell, R. W. Ely and G. A. Cartwright, Biosens. Bioelectron., 2011, 30, 78–86 CrossRef CAS PubMed.
- Y. C. Wang, A. L. Stevens and J. Han, Anal. Chem., 2005, 77, 4293–4299 CrossRef CAS PubMed.
- S. J. Kim, Y. C. Wang, J. H. Lee, H. Jang and J. Han, Phys. Rev. Lett., 2007, 99, 1–4 Search PubMed.
- S. J. Kim, L. D. Li and J. Han, Langmuir, 2009, 25, 7759–7765 CrossRef CAS PubMed.
- Q. Pu, J. Yun, H. Temkin and S. Liu, Nano Lett., 2004, 2–6 Search PubMed.
- A. Manz, N. Graber and H. M. Widmer, Sens. Actuators, B, 1990, 1, 244–248 CrossRef CAS.
- J. H. Masliyah and S. Bhattacharjee, Electrokinetic and Colloid Transport Phenomena, John Wiley & Sons, 2006 Search PubMed.
- B. J. Kirby, Micro- and Nanoscale Fluid Mechanics: Transport in Microfluidic Devices, Cambridge University Press, 2010 Search PubMed.
- D. Burgreen and F. R. Nakache, J. Phys. Chem., 1964, 68, 1084–1091 CrossRef.
- S. Levine, J. Marriott, G. Neale and N. Epstein, J. Colloid Interface Sci., 1975, 52, 136–149 CrossRef.
- J.-P. Hsu, C.-Y. Kao, S. Tseng and C.-J. Chen, J. Colloid Interface Sci., 2002, 248, 176–184 CrossRef CAS PubMed.
- T. W. H. Sheu, V. C. Huang and H. P. Rani, Int. J. Numer. Methods Fluids, 2008, 56, 739–751 CrossRef CAS.
- R. Sadr, M. Yoda, Z. Zheng and A. T. Conlisk, J. Fluid Mech., 2004, 506, 357–367 CrossRef CAS.
- C. H. Chen, Int. J. Heat Mass Transfer, 2012, 55, 2173–2183 CrossRef CAS.
- S. Das and S. Chakraborty, Anal. Chim. Acta, 2006, 559, 15–24 CrossRef CAS.
- S. Talapatra and S. Chakraborty, European Journal of Mechanics, B: Fluids, 2008, 27, 297–308 CrossRef.
- S. Talapatra and S. Chakraborty, Int. J. Fluid Mech. Res., 2009, 36, 460–472 CrossRef.
- C. S. Effenhauser, G. J. M. Bruin and A. Paulus, Electrophoresis, 1997, 18, 2203–2213 CrossRef CAS PubMed.
- P. D. Grossman and J. C. Colburn, Capillary Electrophoresis: Theory and Practice, Academic Press: San Diego, 1992 Search PubMed.
- D. C. Duffy, H. L. Gillis, J. Lin, N. F. Sheppard and G. J. Kellogg, Anal. Chem., 1999, 71, 4669–4678 CrossRef CAS.
- C. C. Chang and C. Y. Wang, Phys. Rev. E: Stat., Nonlinear, Soft Matter Phys., 2011, 84, 1–7 CrossRef PubMed.
- Z.-Y. Xie and Y.-J. Jian, Colloids Surf., A, 2014, 461, 231–239 CrossRef CAS.
- S. Li, Y. Jian, Z. Xie, Q. Liu and F. Li, Colloids Surf., A, 2015, 470, 240–247 CrossRef CAS.
- C.-O. Ng and C. Qi, Proc. R. Soc. A, 2015, 471, 20150200 CrossRef PubMed.
- K. Fluri, G. Fitzpatrick, N. Chiem and D. J. Harrison, Anal. Chem., 1996, 68, 4285–4290 CrossRef CAS PubMed.
- J. G. Santiago, Anal. Chem., 2001, 73, 2353–2365 CrossRef CAS PubMed.
- H. Nazaripoor, C. R. Koch and S. Bhattacharjee, Langmuir, 2014, 30, 14734–14744 CrossRef CAS PubMed.
- H. Nazaripoor, C. R. Koch, M. Sadrzadeh and S. Bhattacharjee, Soft Matter, 2015, 11, 2193–2202 RSC.
- H. Nazaripoor, C. R. Koch, M. Sadrzadeh and S. Bhattacharjee, Soft Matter, 2015, 12, 1074–1084 RSC.
- H. Bruss, Theoretical Microfluidics, Oxford University Press, Oxford, 2008 Search PubMed.
- S. Dhinakaran, A. M. Afonso, M. A. Alves and F. T. Pinho, J. Colloid Interface Sci., 2010, 344, 513–520 CrossRef CAS PubMed.
- X.-X. Li, Z. Yin, Y.-J. Jian, L. Chang, J. Su and Q.-S. Liu, J. Non-Newtonian Fluid Mech., 2012, 187–188, 43–47 CrossRef CAS.
| This journal is © The Royal Society of Chemistry 2016 |

