Amorphous apatite thin film formation on a biodegradable Mg alloy for bone regeneration: strategy, characterization, biodegradation, and in vitro cell study

Hamouda M. Mousaabc, Kamal H. Husseinde, Ahmed A. Raslanf, Joshua Leea, Heung M. Woode, Chan Hee Park*ac and Cheol Sang Kim*ac
aDepartment of Bionanosystem Engineering, Chonbuk National University, Jeonju, Jeonbuk 561-756, Republic of Korea. E-mail: chskim@jbnu.ac.kr; biochan@jbnu.ac.kr; Fax: +82 63 270 2460; Tel: +82 63 270 4284
bDivision of Mechanical Design Engineering, Chonbuk National University, Jeonju, Jeonbuk 561-756, Republic of Korea
cDepartment of Engineering Materials and Mechanical Design, Faculty of Engineering, South Valley University, Qena 83523, Egypt
dStem Cell Institute, Kangwon National University, Chuncheon, Gangwon, Republic of Korea
eCollege of Veterinary Medicine, Kangwon National University, Chuncheon, Gangwondo, Republic of Korea
fDepartment of Systems Immunology, College of Biomedical Science, Kangwon National University, Chuncheon, Gangwondo, Republic of Korea

Received 28th November 2015 , Accepted 19th February 2016

First published on 22nd February 2016


Abstract

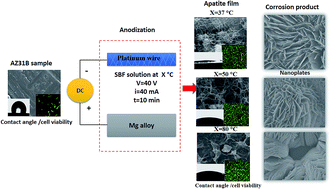
Bioactive films with a nanoplate structure were prepared on the surface of a biodegradable AZ31B magnesium (Mg) alloy via anodization in simulated body fluid (SBF) as an electrolyte to control Mg biodegradability and improve surface bioactivity. The effect of the electrolyte temperature and pH values on the formation of the biomimetic film were studied. The electrolyte was set at three different temperatures of 37, 50, and 80 °C, with pH values ranging from 7.4 to 8 for the lower electrolyte temperature and 11.5–12 for the two higher levels of temperature. The apatite films on the different samples were characterized using X-ray diffraction spectroscopy (XRD), field emission scanning electron microscopy (FE-SEM), EDS element mapping, X-ray photon spectroscopy (XPS), and FTIR spectroscopy. The water contact angles of the different surfaces were evaluated, moreover, the corrosion behaviors of the different samples were studied using electrochemical potentiodynamic DC, electrochemical impedance spectroscopy (EIS), and immersion tests. The human fetal-osteoblast cell line hFOB 1.19 was used in a cell culture test, and the biological response and cell function were evaluated in vitro using DNA and PCR. The decomposition of the apatite film was affected by the anodization electrolyte temperature, resulting in an amorphous structure. It is observed that the apatite structure has nanoplates at electrolyte temperature (37 to 50) °C and these have a tendency to disappear at 80 °C.

1. Introduction

Magnesium (Mg) is the fourth most abundant element in the human body and is essential for the regulation of muscle contraction and human metabolism. It has the potential to be used in bone fixation as a screw, and in joint plates, as well as a vascular stent. Mg is characterized with its light weight, a density that is close to that of natural bone at 1.74 g cm−3, and good mechanical properties.1,2 On the other hand, Mg and its alloys are sensitive to corrosion in a biological environment. It has a high rate of corrosion and a low bioactivity, which are particularly challenging problems that limit its clinical application. To overcome such limitation study of Mg surface by different surface modification techniques is the essential demand for most researchers.3 The corrosion product of Mg in physiological media is not harmful to surrounding tissues, moreover, it is expected to be completely degraded in a physiological environment.4,5 Surface modification of metallic implants is a suitable and popular strategy to improve the bioactivity of Mg to retard its degradation thus a new tissues completely healed and prevent it against inflammation occurrence in the surrounding tissue.6 Different kind of techniques were employed as a surface modification to Mg and its alloys in order to improve physiochemical properties such as electrodepositing,7 ions plating,8 microarc oxidation,9 sol–gel coatings,10 and anodization.11

Among them anodization is a very attractive and traditional way to control and protect metals against high corrosion rate as well as to improve the biocompatibility of Mg by using a proper electrolyte.12,13 During anodization, Mg tends to form oxide layer on its surface according to the following reaction Mg + O2 → MgO. The resulting oxide layer have diverse properties functional properties depending on the chemical composition of the electrolyte.14 Anodization has a unique properties such as increase the film thickness, hardness,15 wear resistance,16 corrosion resistance,17 mechanical properties,14 and good adhesion on the metal surface.18 The resulted improvement depend mainly on different parameters of anodizing such as applied voltage, time, current, and electrolyte composition.15,19 The porosity of the anodized film consider as a proper way to avoid a mechanical mismatching in Mg implant and host bone.20

Bioceramics apatite have excellent biocompatibility and considered as the most promising materials for bone repair since the appropriate cellular response to bioceramics surfaces is essential for bone tissue regeneration and characterized by protein adsorption.21,22 Once bioceramics are in contact with a living body, the proteins present in the surrounding body fluids will be adsorbed onto their surfaces, and thereafter, cellular attachment and proliferation occur.23 As a result, protein adsorption plays a vital role during bone tissue regeneration.24,25 Different studies was employed for Mg coating using HA to improve surface properties such as corrosion resistance26,27 and bone implant.28 Hydroxyapatite (HA) ceramics coated on the metallic implants could improve the bioactivity of implant surface, and this resulted in osteoconduction, which is a tissue response in which bone tends to grow, engages with the coating, and forms a strong mechanical interface.29–31

Simulated body fluid (SBF) with a precipitation of supersaturated calcium phosphate (Ca-P) has found extensive research interest due to the formation of bone like apatite.32–34 The formation of amorphous apatite film promoted by an increase in pH of SBF solution.34 SBF temperature found to has a great effect on the bicarbonate deposition rate in SBF solution subsequently increase the pH value, especially in higher values.35 The formation of apatite deposits onto Mg alloys to enhance their corrosive resistance and their biocompatibility have been performed by soaking in SBF at room temperature for 5 days following by one days sealing with NaOH.36 In this study, biomimetic apatite film was formed using SBF solution via anodization in one step under different electrolyte temperature within 10 min at 40 V and 40 mA. The resulted Ca-P apatite film with amorphous structure on the Mg alloy surface is accelerated by means of applied voltage over a short period of time comparing to the long time soaking in previous works.35,37,38 The effect of the electrolyte temperature on the biomimetic anodized film formation was investigated at 37 °C and 50 °C and at higher values of 80 °C with respect to the physiochemical properties of the AZ31B Mg alloy as well as the biological response through an in vitro study. The anodized film was found to mimic the bone apatite structure/composition and subsequently increase bone osteointegration, and different nano-structure formation was growth at cell culture media with nanoplates similar to that of bone.

2. Materials and methods

2.1 Sample preparation

Commercially available AZ31B Mg alloy (Alfa Aesar Company, South Korea) was purchased with a chemical composition as shown in Table 1. The substrate samples were cut using electric discharge machine (EDM) at dimensions of 12 mm × 12 mm and a thickness of 6.35 mm, thereafter, mechanically polished with SiC paper with successively finer roughness of up to 2000 grit. Finally, the samples were ultrasonically cleaned in acetone followed by cleaning in distilled water and dried in warm air.
Table 1 Chemical composition of the AZ31B magnesium alloy in terms of weight percentage (wt%)
Element Al Zn Mn Si Cu Mg
(wt%) 2.5–3.5 0.7–1.3 0.2–1.0 0.05 0.01 Balance


2.2 Preparation of the anodization process

The anodization cell was composed of AZ31B Mg alloy as an anode and a platinum wire network as a cathode. The anodization process was carried out in SBF solution at different temperatures of 37, 50, and 80 °C at constant voltage of 40 V and current of 40 mA for 10 min under agitation with a magnetic stirrer at 120 rpm to maintain the electrolyte with a homogenous temperature. The pH value of the electrolyte was initially 7.4 and then reached 11.5 after the temperature increased to 50 °C and 80 °C. A DC power supply (IT6723H 300 V/10 A/850 W) was connected with a GP-7202GT, INTEC machine to control the anodization time during the process. The SBF solution was prepared as follows, commercially available Hank's balanced salt (Aldrich, H2387-1L) was dissolved in 1 l of distilled water followed by the addition of MgSO4 (0.097 g), NaHCO3 (0.350 g), and CaCl2 (0.185 g) to simulate the ions concentration in human blood plasma Table 2. Hereafter, the terms T37, T50, and T80 are used to refer to anodized samples at (37 °C, 50 °C, and 80 °C), respectively.
Table 2 Ions concentrations of SBF in comparison with ions concentrations in human blood plasma
  Ions concentration (mM)
Na+ K+ Mg2+ Ca2+ Cl HCO3 HPO42− SO42− pH
Human blood plasma 142.0 5.0 1.5 2.5 103.0 27.0 1.0 0.5 7.2–7.4
SBF 142.0 5.0 1.5 2.5 147.0 4.2 1.0 0.5 7.4


2.3 Surface characterization

The surface morphology of the anodized samples was characterized using a field emission scanning electron microscope (SU-70 SCHOTY type, HITACHI) with an electron beam of 0.5 nm at 15 kV. The phase composition and the crystallinity were obtained by using a Rigaku X-ray diffractometer (XRD, Rigaku, Japan) with Cu Ka (k = 1.540 Å) radiation over a Bragg angle ranging from 5 to 90 degree. The elemental composition of the anodized film in the outer layer was investigated using X-ray photoelectron spectroscopy (XPS), and aluminum (Al) was used as the anode material of the Thermo/K-Alpha ESCA System. Fourier transform infrared spectrometer (FT-IR), (Perkin Elmer® Spectrum™ GX systems) spectrum was used to check different functional groups on the anodized samples in the range of 400 to 4000 cm−1. The hydrophilicity of the surface of the Mg alloy substrate and the anodized film surface was measured using a standard DPRO imaging device to measure the water contact angle.

2.4 Corrosion measurements

A ZIVE SP1 potentiostat/galvanostat/EIS device was used to carry out the electrochemical corrosion test. The electrochemical measurements were conducted with a conventional three-electrode system in an electrochemical cell composted of Mg samples and platinum plate working as working electrode and counter electrode, respectively, and a saturated Ag/AgCl in KCl as a reference electrode. The experiment was performed at 0.5 mV scan rate with initial and final potentials are 3.0 and 1.5 V, respectively. The corrosion test was evaluated in SBF solution at 37 ± 0.5 °C, and electrochemical impedance spectroscopy (EIS) test was conducting in a frequency range from 100 kHz to 0.01 Hz with 10 points per decade at open circuit potential (OCP). The amplitude of the sinusoidal potential was of 10 mV with respect to the OCP. The area of the specimen exposed to the solution was 0.875 cm2, and three duplicate samples were measured for each sample group to control the experimental scattering. To check the corrosion products the different samples were immersed 12-well culture plate with alpha-MEM media with presence of MC3T3-E1 cells with 3 × 10⁴ cells per well for three days, the samples were covered with media thereafter, samples morphology were checked with SEM. Immersion test of the different samples was evaluated to enhance the weight loss of the samples after 5, 10, and 15 days in SBF solution at 37 °C and 120 rpm shaking, samples weight were measured before and after immersion test, the corrosion products were removed using 200 g l−1 CrO3 modified with the addition of 10 g l−1 AgNO3.39

2.5 Cell culture

Human fetal-osteoblast cell line, HFOB 1.19 were cultured in a 1[thin space (1/6-em)]:[thin space (1/6-em)]1 mixture of Ham's F12 and DMEM supplemented with 10% fetal bovine serum (FBS; Hyclone, Logan, UT, USA), 2.5 mM L-glutamine (Gibco, Grand Island, NY, USA) and 1% p/s in a humidified incubator at 34 °C and 5% CO2. The cells were harvested via trypsinization at a 70% confluence and were then used for further experiments. Extracts of different samples were prepared in a serum-free 1[thin space (1/6-em)]:[thin space (1/6-em)]1 mixture of Ham's F12 and Medium Dulbecco Modified Eagle's minimal essential medium (DMEM) supplemented with 1% penicillin/streptomycin (p/s, Gibco, Grand Island, NY, USA) culture medium at 37 °C, 120 rpm for 72 h with a standard ratio of 0.2 g ml−1 of culture medium. After that, the supernatant was withdrawn and centrifuged to prepare the desired extracts, which were then stored at 4 °C before the cytotoxicity test. A 50 × 103 cells density were cultured in 24-well plates for 24 h, then the indirect contact technique was carried out by using the previous extraction medium through an addition of 500 μl. For the positive control, the cells were cultured with pure medium without any additives while for the negative control, the cells were cultured in presence of 20% dimethyl sulfoxide (DMSO), and different media was changed daily. The cell response against the extraction fluid was evaluated after incubating in a well plate for intervals of 1, 3, and 5 days.

The MTT solution 3-[4,5-dimethylthiazol-2-yl]-2,5-diphenyltetrazolium bromide (MTT; Sigma-Aldrich, St Louis, MO, USA) was prepared in phosphate buffered saline (PBS) at a final concentration of 5 mg ml−1. In the last of the incubation, 50 μl of the MTT solution were as added to each well, followed by 4 h of incubation. The medium was aspirated, and 350 μl of DMSO were added to each well to dissolve the formazan. Thereafter, the absorbance was measured at a 570 nm wavelength using a microplate reader. The live/dead cells staining were performed to determine the viable and non-viable osteoblast cells after 5 days as well as the microscopic images of different samples extraction in media. Live and dead cells were respectively stained with calcein-AM/ethidium bromide homodimer (Invitrogen) for 30 min at 37 °C and were then imaged using a fluorescence microscope (Olympus, Tokyo, Japan). The cell attachment were observed using scanning electron microscopy (SEM). A 30 × 103 cells were seeded on each surface of the different samples for 48 h. Thereafter, 2.5% glutaraldehyde was used to fix cells for 1 h at 4 °C, followed by washing with an ascending series of ethanol (25%, 50%, 75%, and 95% ethanol) then kept at room temperature, thereafter, SEM images were used to check cell attachment.

2.6 DNA test

The cells were trypsinized at different time intervals and were digested with proteinase K buffer (Sigma-Aldrich, St. Louis, MO) at 56 °C. The DNA was extracted using a NucleoSpin kit (Machery-Nagel Gmbh & Co. KG, Germany) according to the manufacturer instructions, and the concentration of the extracted DNA was measured using a NanoDrop spectrophotometer ND-1000 (PeqLab, Erlangen, Germany) with a photometric measurement of the optical density at 260 nm.

2.7 Polymerase chain reaction (PCR) analysis

The total RNA was extracted from cells grown on the surface of the different samples and cells cultured in a two-dimensional monolayer (which was used as control). TRIzol solution (Invitrogen) was used according to manufacturer's instructions. A total amount of 1 μg from RNA was used to synthesize the cDNA using random primers and GoScript reverse transcriptase (Promega, Korea). 50 ng of extracted cDNA was used for the PCR analysis with a Professional standard 96 gradient machine (Biometra, Goettingen, Germany). The primer sequences are summarized in Table 3. PCR was performed under the following experimental conditions: 94 °C for 3 min, followed by 30 cycles of 94 °C for 30 s, an annealing temperature for 30 s and at 72 °C for 45 s with a final extension at 72 °C for 10 min. The PCR products were analyzed on 1.5% agarose gel stained with ethidium bromide and were visualized with ultraviolet transillumination (G:BOX F3, Syngene, Cambridge, UK) using a 100-base pair DNA ladder as a reference (GeneRuler, Fermentas, Burlington, ON, Canada). Relative gene expression was quantified with Image J software (National Institutes of Health, Bethesda, MD, USA) and GAPDH (glyceraldehyde 3-phosphate dehydrogenase) was the endogenous control.
Table 3 Primer sequence used for the PCR analysis
Primer Primer sequences Annealing temperature
Forward Reverse
Osteocalcin 5′-ACA CTC CTC GCC CTA TTG-3′ 5′-GAT GTG GTC AGC CAA CTC-3′ 59.3
Osteopontin 5′-CTC AGG CCA GTT GCA GCC-3′ 5′-CAA AAG CAA ATC ACT GCA ATT CTC-3′ 61.4
Collagen I 5′-CAG CCG CTT CAC CTA CAG C-3′ 5′-TTT TGT ATT CAA TCA CTG TCT TGC C-3′ 57.1
Osteonectin 5′-CTC GGT GTG GGA GAG GTA CC-3′ 5′-CTC AGG CCA GTT GCA GCC-3′ 59.4
GAPDH 5′-ACA GTC AGC CGC ATC TTC TT-3′ 5′-GAC AAG CTT CCC GTT CTC AG-3′ 59.7


2.8 Statistical analysis

Each of the data points from the biological tests in Sections 2.4 represents the (means ± standard deviations) calculated with at least 3 individual samples. The statistical analysis was conducted using a one-way analysis of variance (one-way ANOVA test). All of the pairwise comparisons were performed with p < 0.05 to determine statistical significance. The terms T37, T50, and T80 will refer to different electrolyte temperature at 37 °C, 50 °C, and 80 °C, respectively.

3. Results and discussion

3.1 Surface morphology and phase composition

Fig. 1 shows the FE-SEM images of the bare Mg alloy (control) and the anodized samples at various electrolyte temperatures. The bare sample exhibited grooves as a result of the grinding process, which can be clearly seen in Fig. 1a. The deposition of the anodized film was carried out at a low electrolyte temperature of 37 °C, which is similar to that of human plasma. The surface exhibited random white agglomerates with a nanocactus shape and a nanoplate morphology similar to bone structure, as shown in Fig. 1b. A morphology similar to that of nanoplates could be seen at 50 °C (Fig. 1c). An increase in the electrolyte temperature to 80 °C (Fig. 1d) results in the disappearance of the nanostructure with fewer white particles, and the surface shows a wide porous structure and a decrease in the apatite film affected by the high temperature. The increase in the anodization temperature of the SBF solution revealed that it has an effect on the bicarbonate decomposition on the Mg alloy interface. Hence, the decomposition of bicarbonate ions (HCO3) results in a pH increase in the SBF. Different amounts of bicarbonate ions are required to reach the critical pH range for apatite formation and to have an effect on the surface morphology of the biomimetic coating.40 As the temperature increases, the apatite coating with different morphologies can be achieved by varying the pH of the SBF, as shown in the surface morphology in Fig. 1. The phase composition of the anodized film was fully investigated using XRD technique, as shown in Fig. 2. XRD results indicates Mg peaks observed at (2θ = 32, 34.5, 47.9, 57.56, 63.2 and 68.9) with corresponding planes (002, 101, 102, 110 and 102) respectively. In the other hand MgO peaks are appear at (2θ = 36.5, 72.5, and 81.6) with corresponding planes (111, 001, and 222), respectively. Commercial HA peaks are measured to compare with the anodized sample, however, the high HA intensity peak is shown at 2θ = 32–33 at which Mg peaks have high intensity located. As a result, it was difficult to detect any apatite peaks which revealed the formation of amorphous apatite formation generated from SBF solution at different temperature in agreement with previous publication.35 XPS test was performed to observe the composition of the outer surface of the anodized film, as shown in Fig. 3, which indicates that the coated surface is mainly composed of Mg, O, Ca and P elements. The phosphorous (P 2p3/2) peak show low intensity comparing to other elements where inset graph at low peak intensity was shown to indicate the formation of P between 130 and 140 (B.e). The resulting peaks in the XPS measurements reveal the formation of an oxide layer from the MgO and CaP apatite. The detailed XPS elemental analysis peaks are listed in Table S1 (ESI) mainly with peaks height (CPS) and at%. In addition, the ESI Fig. S1–S3 show the EDS and EDS element mapping results of the treated samples at temperatures 37 °C, 50 °C, and 80 °C, respectively. The EDS results were selected in two different regions of mostly white colors and gray regions of the samples. At the low white area, a lower percentage of O elements and a high percentage of Mg are present. Conversely, in the white areas, a higher O percentage and a lower Mg can be seen, which illustrates the formation of oxide particles and apatite. Full scan element mapping and an elemental scan are listed with details of the elemental weight percentage. The apatite film thickness was 7.78 μm, 6.63 μm, and 5.36 μm for T37, T50, and T80 samples, respectively which indicates the decrease of film thickness with increasing electrolyte temperature as it shown in the ESI Fig. S4–S6.
image file: c5ra25306c-f1.tif
Fig. 1 FE-SEM images of the different samples: (a) bare sample, (b) T37, (c) T50, and (d) T80.

image file: c5ra25306c-f2.tif
Fig. 2 XRD patterns of the different samples under different anodization conditions: (a) commercial HA powder (b) T37, (c) T50, (d) T80.

image file: c5ra25306c-f3.tif
Fig. 3 XPS spectra of the treated samples using anodization: (a) T37, (b) T50, and (c) T80. The inset image show scan region at P 2p3/2 due to the low intensity.

The FTIR spectrum of the different coated samples is shown in Fig. 4, the band at vibration of (ν4) assigned to PO43− group is located at around 530 cm−1 and between (1055–1190) cm−1.41


image file: c5ra25306c-f4.tif
Fig. 4 FT-IR spectra of the different anodized samples at different electrolytic temperature.

The doublet band at 870 cm−1 and band around 1423 cm−1 is assigned to CO32− group.42 The strong band vibration around 1635 cm−1 and 3350 cm−1 are assigned to H2O,42 moreover, the IR band at 3650 cm−1 is assigned to O–H in Mg(OH)2 during the alkaline treatment and hydrated nature of the coating.35

3.2 Surface hydrophilicity

The hydrophilicity of the biomaterials is an important factor that plays an important role in tissue engineering as it affects the initial cell adhesion and proliferation.43 Fig. 5a shows the results of water contact angle (CA), the bare sample shows a contact angle of 94°, and the treated samples at different temperatures with CA of 26°, 27°, and 17°, respectively. CA has a great impact on the compatibility of the biomaterials, and it has been found that improving the wettability, i.e., a low contact angle could improve the biocompatibility of the surface.44,45 The cell adhesion to the extracellular matrix (ECM) proteins adsorbed onto the implant interface are highly important to the host response to biomaterials in the tissue-engineering field.45 Here, the samples treated with anodization at a high electrolytic temperature of 80 °C exhibit a high surface wettability. However, the low apatite formation in the higher temperature lower contact angle present as there is another factors such as surface roughness and porosity can effect on the surface hydrophilicity.
image file: c5ra25306c-f5.tif
Fig. 5 (a) Water contact angle of the different samples: bare sample, T37, T50, and T80, (b) potentiodynamic polarization curve of the anodized samples with a comparison to bare sample as control.

3.3 Biodegradation behavior

An electrochemical corrosion test using potentiodynamic polarization curves based on Tafel slopes in anodic and cathodic reactions was used to assessment the corrosion behavior of the different samples, the test results are summarized in Table 4. The bare sample has the lowest resistance to polarization among the samples with 8.26 ± 3.92 kΩ cm2 when compared to other samples, which indicates an improvement in the corrosion resistance as a result of the formation of the anodized film in terms of corrosion current and polarization values as shown in Fig. 5b. Moreover, the Nyquist plot in Fig. 6a shows a high inductive loop at an electrolyte temperature of 37 °C, followed by a decrease in the loop diameter at 50 °C and 80 °C. The Bode diagram in Fig. 6b revealed an improvement in the corrosion resistance that was in agreement with the results of the Nyquist plot. The anodized film as a form of surface protection is analyzed using an equivalent circuit for the resulting Nyquist plot, as shown in Fig. 7. The resulting data was fitted with a standard equivalent circuit in a bare simple circuit with three components, as illustrated in the circuit in Fig. 7A. The corrosive solution resistance Rs, passive layer resistance (R), and capacitance (C). However, the other side exhibits a coated layer with two parallel resistance (R2) and total capacitive (Q2) as shown in Fig. 7B the dense inner layer and pours outer layer. Line EDS results are shown in ESI (Fig. S7), EDS result show elemental distribution through the two anodizing layers. The relevant equivalent circuit parameters are shown in Table 5, the coating charge resistance can be shown to have a high value at T37 with 21.91 kΩ, which may be due to the decrease in the oxide layer thickness that resulted from the temperature increase. The EIS results find an improvement could be represented in the capacitance loop diameters which higher than that of electrodeposition of HA in Mg alloy.7
Table 4 Potent dynamic polarization test parameters results. Data are presented with means ± standard deviation
  Ecorr (V) Icorr (μA cm−2) Rp (kΩ cm2)
AZ31B-control −1.46 ± 0.016 2.796 ± 1.54 8.257 ± 3.92
T-37 −1.422 ± 0.011 3.5125 ± 0.21 11.9925 ± 1.62
T-50 −1.415 ± 0.001 2.105 ± 0.007 13.8565 ± 0.73
T-80 −1.412 ± 0.007 3.5115 ± 0.304 12.071 ± 0.17


image file: c5ra25306c-f6.tif
Fig. 6 EIS result: (a) Nyquist plot of the different AZ31B Mg samples, (b) Bode plot of the different samples.

image file: c5ra25306c-f7.tif
Fig. 7 Illustrative diagrams show different equivalent circuit of: (A) the bare samples, (B) anodized samples.
Table 5 EIS equivalent circuit parameters results according to Fig. 7a and b
  Rs (Ω) R (kΩ) C (μ) R1 (kΩ) Q1 (m) R2 (Ω) Q2
Substrate 351.95 2.51 2.62
T37 526.77 21.91 848.62 21.92 k 222
T50 546.5 14.66 831 14.65 k 222
T80 324 6.85 705.6 404.47 G 715.1 m


Fig. 8a–c show SEM images of the anodized samples after 3 days of incubation in alph MEM media with MC3T3-E1 cells to mimic the host environment with implant materials. The results show a nanoplates growth in well order which enhance surface bioactivity and mimic nanoplates structure similar to that of bone leading to stimulate specific cellular responses at the molecular level.41 Growth of such nanoplates during biomineralization at presence of biomolecules can significantly modify the growth rates of the mineralizing crystal. The different charges in basal plane of HA is rich in OH ions where positive in the prism plane which rich with Ca2+. As a results, interaction of biomolecules with new surface at different charges play a role in the nucleation and growth of HA during the biomineralization.46 In addition, immersion test results are shown in Fig. 8d, the weight loss of different samples with compared to the bare ones are displayed. The histogram indicate that after 5 days of immersions small differences in mass loss of the sample groups, however, after 10 and 15 days of immersion bare sample show higher mass loss compared to the anodized samples. The standard electrochemical Mg is −2.4 V and −1.5 in an aqueous solution due to the formation of the Mg(OH)2 layer.47 The low difference in the corrosion resistance values between the bare sample and the anodized samples is due to the penetration of corrosive chloride Cl ions to the thin film of apatite which are closed to each other with maximum values of 7.78 μm on the Mg alloy surface.4 Moreover, the labile ions on bone-like apatite crystals (PO43−, HPO42−, and CO32−) did not dissolve in the physiologic solution and behave as corrosion-resistant material, thus gaining more weight from the corrosion product.48 This was revealed by the growth of biomineralization nanoplates in α-MEM media at 37 °C as shown in Fig. 8, such morphology is exist in the natural bone nanocrystals in a plate-like shape with a length of 30–200 nm and a thickness of 2–7 nm.


image file: c5ra25306c-f8.tif
Fig. 8 Figure show SEM images of apatite morphology nucleation after immersion in α-MEM media incubated at 37 °C and humidity 95% for three days in the different samples (a) T37, (b) T50, and (c) T80. Histogram in (d) shows mass losses in the different samples compared with the bare sample as control, test was performed at different intervals of times.

3.4 In vitro osteoblast cell responses

The cell viability is investigated to evaluate the biocompatibility of the biomaterials in vitro. Fig. 9a shows the MTT absorbance of the different samples after 1, 3, and 5 days of incubation with different samples. The proliferation in the T80 samples group has the highest hFOB 1.19 cell lines proliferation among the different samples. The osteoblast cells proliferated on the anodized samples showing time-dependent behavior, and the sample group with the same culture time shows significant values with p < 0.05. The different culture groups in a time dependent scenario have a significant values at α level of 0.05 where p < 0.05. The bare sample exhibits a low absorbance throughout the culture time when compared to the anodized ones. The cell morphology after five days of cultures in Fig. 9b–e show more cell proliferation comparing to the bare sample which coincident with the MTT results. Fig. 10 shows the live/dead cells fluorescence analysis to examine the bone cell proliferation, cell viability for the positive control, negative control, bare sample, T37, T50, and T80. The microscopic images reveal a healthy cell morphology in all groups after the fifth day. However, the bare samples exhibit a low cell density relative to the anodized samples which have a significantly higher cell density. Furthermore, the cells can be seen to have elongated in the same direction with multiple layers of cells in different anodized samples. Thus the results shown in Fig. 10F are in agreement with the MTT tests, which show the highest cell viability for the T-80 samples. The interaction of biomaterials interface and cells is important issue as it is responsible for cell adhesion and proliferation. Cells attachment with the bare samples and new surface were confirmed using SEM images as shown in Fig. 11. The bare sample show a few cells due to smooth surface thus, cells tend to migrate, and in the other side the treated samples show significant change. The morphology of the cells was observed to be intermediate between flat and spherical shape due to the porosity of the apatite film. The results indicate a good adhesion for the osteoblast cells with the treated samples.
image file: c5ra25306c-f9.tif
Fig. 9 (a) HFOB 1.19 cell proliferation versus culture days of the negative control, bare sample, T37, T50, T80, and positive control, (b–e) cell proliferation after five days. Statistical analysis was performed, and the data are presented as (means ± standard deviations, n = 4 samples). The significant differences were calculated using a one-way ANOVA test at α = 0.05, asterisks (*) indicates p < 0.05 comparing to bare sample.

image file: c5ra25306c-f10.tif
Fig. 10 Microscopic florescent images for the live/dead cells of the (A) negative control, (B) positive control, (C) bare sample, (D) T37, (E) T50, (F) T80.

image file: c5ra25306c-f11.tif
Fig. 11 SEM images of the cell attachment on the different samples after two days of culture.

A quantification of the DNA test was performed as an indicator of the cell proliferation from wells containing HFOB cells in the presence of conditioned media, which shows an increase in the amount of DNA from day 1 to day 5 for different samples, as shown in Fig. 12. The results indicate that the anodized samples have a high percentage of DNA concentration over various culture days. The expressions of mRNA markers related to bone tissue formation, including OC, OP, and COl-1, were evaluated by densitometric analysis of the PCR products to compare the osteogenic potential of the hFOB grown on the different materials, as shown in Fig. 13. The difference in the expression of osteocalcin (OC) and osteopontin (OP) was not significant in cells grown on AZ31B Mg alloys prepared at different levels of electrolyte temperature, while their expressions were higher than the expression of cells grown on the bare Mg alloys or in a culture dish. This indicates that the bioactive films significantly increased the osteoblast cell function, such as the ECM mineralization, cell adhesion, and bone remodeling. The expression of collagen I (Col-I) was higher in alloys prepared at 50 °C, which may be explained to be the cell response to an increase in cell attachment toward the apatite film. The OC and OP are osteoblast-specific marker genes with OC as a major non-collagenous protein component of bone extracellular matrix (ECM) produced by both osteoblasts and osteoclasts. OP is commonly found in specific regions of the bone in vivo, such as in cement lines in remodeled bone, and it is involved in bone remodeling, cell adhesion, and ECM mineralization. In vitro, osteopontin is commonly associated with the formation of a collagen-free cement layer on which bone is subsequently deposited. Collagen I aids in the deposition of collagen, the most abundant ECM protein in bone.


image file: c5ra25306c-f12.tif
Fig. 12 DNA test of the different samples among the culture days, the data are presented as (means ± standard deviation) and n = 3 samples. The significant difference in the present data was calculated based on an ANOVA one way test with a confidence interval of α = 0.05.

image file: c5ra25306c-f13.tif
Fig. 13 (a) Gel electrophoresis of the PCR products of the different samples on 1.5% agarose, followed by analysis of bands density using Image J software (b).

The results support our hypothesis that these are biocompatible coating materials with improved surface bioactivity. In addition, the osteoblast cell function was examined using both untreated and treated samples. OC and OP are osteoblast-specific marker genes, where OC is a major non-collagenous protein component of bone extracellular matrix (ECM) produced by both osteoblasts and osteoclasts and OP is commonly found in specific regions of bone in vivo, such as cement lines in remodeling bone. OP is involved in bone remodeling, cell adhesion, and ECM mineralization. In vitro, osteopontin is commonly associated with the formation of a collagen-free cement layer on which bone is subsequently deposited. On the other hand, collagen I aids in the deposition of collagen, which is the most abundant ECM protein in bone.49 The present results thus indicate that all cells grown on coated materials showed upregulated expression of OC and OP relative to bare alloys or cells cultured on tissue culture dish, which may indicate the efficient apatite coating of Mg alloys. Based on the above results, the temperature of the anodization electrolyte can be concluded to have increased the porosity of the output oxide film and decreased the CaP particle content, which are the main component of apatite, as can be observed in the samples from the 37 °C and 50 °C electrolytic temperature with a nanostructure formation.50–52

4. Conclusions

In summary, a simple one step method was implemented to generate bone-like apatite with a nanoplates morphology on the AZ31B Mg alloy using SBF solution as an electrolyte in anodization process. The results show the formation of apatite film at different anodization electrolyte temperature within a short time by accelerating the apatite formation by means of anodization parameters. The thin film was fully characterized with slightly improvements in corrosion resistance due to thin thickness with an advantage of formation of a unique morphology similar to bone structure in a similar biological environment. Moreover, the biomimetic apatite film under the electrolyte temperature in the range from 37 to 50 °C exhibits minor differences in alloy degradation, morphology and biological response in the MTT test. The results find that, in addition to the enhancement of cell proliferation, the apatite film promoted osteoblastic differentiation of hFOB 1.19 cell lines in vitro by upregulating osteogenic gene expression. Moreover, the proposed method not only improve the bioactivity and corrosion resistance but also introduce a unique structure before and after short time of implantation thus it could help the implant material to engage with the bone tissue and eliminated the induced stress shield effect.

Acknowledgements

This paper was supported by grant from the Basic Science Research Program through National Research Foundation of Korea (NRF) by Ministry of Education, Science and Technology (Project no. NRF-2015R1C1A1A02036404). And also partially supported by the Human Resource Training Program for Regional Innovation and Creativity through the Ministry of Education and National Research Foundation of Korea (NRF-2015H1C1A1035635).

References

  1. F. Witte, Acta Biomater., 2010, 6, 1680–1692 CrossRef CAS PubMed.
  2. M. Razavi, M. Fathi, O. Savabi, S. Mohammad Razavi, B. Hashemi Beni, D. Vashaee and L. Tayebi, Mater. Lett., 2013, 113, 174–178 CrossRef CAS.
  3. G. Song, Adv. Eng. Mater., 2005, 7, 563–586 CrossRef CAS.
  4. M. P. Staiger, A. M. Pietak, J. Huadmai and G. Dias, Biomaterials, 2006, 27, 1728–1734 CrossRef CAS PubMed.
  5. X. Zhang, X.-W. Li, J.-G. Li and X.-D. Sun, ACS Appl. Mater. Interfaces, 2014, 6, 513–525 Search PubMed.
  6. M. A. Fernandez-Yague, S. A. Abbah, L. McNamara, D. I. Zeugolis, A. Pandit and M. J. Biggs, Adv. Drug Delivery Rev., 2015, 84, 1–29 CrossRef CAS PubMed.
  7. Y. W. Song, D. Y. Shan and E. H. Han, Mater. Lett., 2008, 62, 3276–3279 CrossRef CAS.
  8. E. Zhang, L. Xu and K. Yang, Scr. Mater., 2005, 53, 523–527 CrossRef CAS.
  9. T. S. N. Sankara Narayanan, I. S. Park and M. H. Lee, Prog. Mater. Sci., 2014, 60, 1–71 CrossRef CAS.
  10. S. V. Lamaka, M. F. Montemor, A. F. Galio, M. L. Zheludkevich, C. Trindade, L. F. Dick and M. G. S. Ferreira, Electrochim. Acta, 2008, 53, 4773–4783 CrossRef CAS.
  11. C. Blawert, W. Dietzel, E. Ghali and G. Song, Adv. Eng. Mater., 2006, 8, 511–533 CrossRef CAS.
  12. A. Zomorodian, M. P. Garcia, T. Moura e Silva, J. C. S. Fernandes, M. H. Fernandes and M. F. Montemor, Acta Biomater., 2013, 9, 8660–8670 CrossRef CAS PubMed.
  13. L. Chai, X. Yu, Z. Yang, Y. Wang and M. Okido, Corros. Sci., 2008, 50, 3274–3279 CrossRef CAS.
  14. H. M. Mousa, K. H. Hussein, H. M. Woo, C. H. Park and C. S. Kim, Ceram. Int., 2015, 41, 10861–10870 CrossRef CAS.
  15. H. M. Mousa, D. H. Lee, C. H. Park and C. S. Kim, Appl. Surf. Sci., 2015, 351, 55–65 CrossRef CAS.
  16. A. F. Yetim, Surf. Coat. Technol., 2010, 205, 1757–1763 CrossRef CAS.
  17. S. Hiromoto, T. Shishido, A. Yamamoto, N. Maruyama, H. Somekawa and T. Mukai, Corros. Sci., 2008, 50, 2906–2913 CrossRef CAS.
  18. D. Xue, Y. Yun, M. J. Schulz and V. Shanov, Mater. Sci. Eng. C, 2011, 31, 215–223 CrossRef CAS.
  19. L. Zhu, Y. Li and W. Li, Surf. Coat. Technol., 2008, 202, 5853–5857 CrossRef CAS.
  20. S. Thelen, F. Barthelat and L. C. Brinson, J. Biomed. Mater. Res., Part A, 2004, 69, 601–610 CrossRef PubMed.
  21. W.-Q. Yan, M. Oka and T. Nakamura, J. Biomed. Mater. Res., 1998, 42, 258–265 CrossRef CAS PubMed.
  22. P. Ducheyne and Q. Qiu, Biomaterials, 1999, 20, 2287–2303 CrossRef CAS PubMed.
  23. D. A. Puleo and A. Nanci, Biomaterials, 1999, 20, 2311–2321 CrossRef CAS PubMed.
  24. A. A. Sawyer, K. M. Hennessy and S. L. Bellis, Biomaterials, 2005, 26, 1467–1475 CrossRef CAS PubMed.
  25. S. Radin and P. Ducheyne, J. Biomed. Mater. Res., 1996, 30, 273–279 CrossRef CAS PubMed.
  26. S. Hiromoto and A. Yamamoto, Electrochim. Acta, 2009, 54, 7085–7093 CrossRef CAS.
  27. M. Tomozawa and S. Hiromoto, Appl. Surf. Sci., 2011, 257, 8253–8257 CrossRef CAS.
  28. C. Wen, S. Guan, L. Peng, C. Ren, X. Wang and Z. Hu, Appl. Surf. Sci., 2009, 255, 6433–6438 CrossRef CAS.
  29. K. S. Vecchio, X. Zhang, J. B. Massie, M. Wang and C. W. Kim, Acta Biomater., 2007, 3, 910–918 CrossRef CAS PubMed.
  30. G. Y. Pettis, L. B. Kaban and J. Glowacki, J. Oral Maxillofac. Surg., 1990, 48, 1068–1074 CrossRef CAS PubMed.
  31. O. Suzuki, S. Kamakura, T. Katagiri, M. Nakamura, B. Zhao, Y. Honda and R. Kamijo, Biomaterials, 2006, 27, 2671–2681 CrossRef CAS PubMed.
  32. T. Kokubo, H.-M. Kim and M. Kawashita, Biomaterials, 2003, 24, 2161–2175 CrossRef CAS PubMed.
  33. F. Li, Q. L. Feng, F. Z. Cui, H. D. Li and H. Schubert, Surf. Coat. Technol., 2002, 154, 88–93 CrossRef CAS.
  34. X. Lu and Y. Leng, Biomaterials, 2005, 26, 1097–1108 CrossRef CAS PubMed.
  35. A. Cuneyt Tas, J. Non-Cryst. Solids, 2014, 400, 27–32 CrossRef CAS.
  36. S. Keim, J. G. Brunner, B. Fabry and S. Virtanen, J. Biomed. Mater. Res., Part B, 2011, 96, 84–90 CrossRef PubMed.
  37. L. Jonášová, F. A. Müller, A. Helebrant, J. Strnad and P. Greil, Biomaterials, 2004, 25, 1187–1194 CrossRef.
  38. P. Li, J. Biomed. Mater. Res., Part A, 2003, 66, 79–85 CrossRef PubMed.
  39. H. M. Mousa, K. H. Hussein, H. R. Pant, H. M. Woo, C. H. Park and C. S. Kim, Colloids Surf., A, 2016, 488, 82–92 CrossRef CAS.
  40. H. Qu and M. Wei, J. Biomed. Mater. Res., Part B, 2008, 87, 204–212 CrossRef PubMed.
  41. H. M. Mousa, A. P. Tiwari, J. Kim, S. P. Adhikari, C. H. Park and C. S. Kim, Mater. Lett., 2016, 164, 144–147 CrossRef CAS.
  42. A. Farzadi, F. Bakhshi, M. Solati-Hashjin, M. Asadi-Eydivand and N. A. a. Osman, Ceram. Int., 2014, 40, 6021–6029 CrossRef CAS.
  43. M. Cheng, J. Deng, F. Yang, Y. Gong, N. Zhao and X. Zhang, Biomaterials, 2003, 24, 2871–2880 CrossRef CAS PubMed.
  44. N. P. Desai and J. A. Hubbell, J. Biomed. Mater. Res., 1991, 25, 829–843 CrossRef CAS PubMed.
  45. R. Tzoneva, N. Faucheux and T. Groth, Biochim. Biophys. Acta, Gen. Subj., 2007, 1770, 1538–1547 CrossRef CAS PubMed.
  46. B. Viswanath and N. Ravishankar, Biomaterials, 2008, 29, 4855–4863 CrossRef CAS PubMed.
  47. R. Ambat, N. N. Aung and W. Zhou, Corros. Sci., 2000, 42, 1433–1455 CrossRef CAS.
  48. H.-M. Kim, Y. Kim, S.-J. Park, C. Rey, L. HyunMi, M. J. Glimcher and J. Seung Ko, Biomaterials, 2000, 21, 1129–1134 CrossRef CAS PubMed.
  49. N. Zhao and D. Zhu, PLoS One, 2014, 9, e110420 CrossRef PubMed.
  50. T. Aerts, T. Dimogerontakis, I. De Graeve, J. Fransaer and H. Terryn, Surf. Coat. Technol., 2007, 201, 7310–7317 CrossRef CAS.
  51. S. Theohari and C. Kontogeorgou, Appl. Surf. Sci., 2013, 284, 611–618 CrossRef CAS.
  52. F.-H. Lin, Y.-S. Hsu, S.-H. Lin and J.-S. Sun, Biomaterials, 2002, 23, 4029–4038 CrossRef CAS PubMed.

Footnote

Electronic supplementary information (ESI) available. See DOI: 10.1039/c5ra25306c

This journal is © The Royal Society of Chemistry 2016