DOI:
10.1039/C5RA25292J
(Paper)
RSC Adv., 2016,
6, 15895-15899
Quantum dot cluster (QDC)-loaded phospholipid micelles as a FRET probe for phospholipase A2 detection†
Received
28th November 2015
, Accepted 29th January 2016
First published on 1st February 2016
Abstract
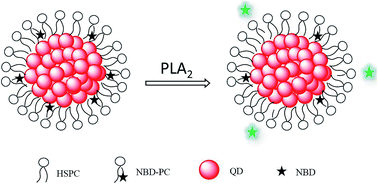
A simple assay for phospholipase A2 (PLA2) enzyme was developed based on a fluorescence resonance energy transfer (FRET) probe using the quantum dot cluster (QDC)-loaded phospholipid micelles. The probe was prepared by encapsulating many small hydrophobic quantum dots (QDs) within the hydrophobic core of micelles that were formed from the coassembly of hydrogenated soy phosphatidylcholine phospholipids (HSPC) and fluorescent lipids (NBD-PC). QDCs formed within the micelle core served as the substrate for NBD fluorescence quenching through FRET. The QDC-loaded micelles showed very low background fluorescence. As the PLA2 enzyme selectively digested lipids, the NBD fluorescence was recovered from its quenched state, leading to the sensitive detection of PLA2. This assay provided a limit of detection (at a signal-to-noise ratio of 3) of 3 U L−1 for PLA2. In the presence of a PLA2 inhibitor, the fluorescent response of the sensor for PLA2 decreased, indicating that the assay could also be used for screening the PLA2 inhibitors.
Introduction
Phospholipase A2 (PLA2) is an important enzyme of the phospholipase superfamily that catalyzes the hydrolysis of sn-2 position acyl chains of phospholipids.1 PLA2 dysregulation is a feature of several human diseases, including autoimmune diseases,2 cardiovascular diseases,3 neurological disorders,4 and some cancer types.5 Given its diverse biological roles, many assays have been developed to determine the PLA2 level by measuring its digestive activity or by measuring protein concentration through an immunoassay. Typical methods for measuring PLA2 activity include discontinuous radiochemical,6 spectrophotometric,7 electrochemical,8 chromatographic,9 magnetic relaxation,10 and fluorescent11 methods. Among these, the fluorescent method has attracted increasing attention because of its sensitivity, simplicity, and suitability for in vivo analysis.12 Fluorogenic substrates are alternative probes for the real-time analysis of enzyme kinetics and their inhibitors. Several PLA2 probes based on a phosphatidylcholine skeleton have already been developed based on FRET technique.13–15 PLA2 primarily acts on aggregated phospholipids organized into lipid bilayers, such as the cell membrane; thus, in addition to their substrate chemistry, PLA2 is also sensitive to the nanoscale intermolecular spatial arrangement of the substrate.16 PLA2 activity on free lipid monomers is relatively lower than that on bilayers, monolayers, and micelles.17 Furthermore, the use of phospholipid monolayer-coated hydrophobic beads as substrates can decrease lag time for enzymatic hydrolysis.18 Therefore, micro- or nanoparticles composed of artificial lipid analogs that undergo fluorometric19 or colorometric20 changes upon hydrolysis have been synthesized to assay PLA2 activity. Quantum dots (QDs) are extensively used as optical labels for biosensing because of their high fluorescence quantum yields, stability against photobleaching, and size-controlled luminescence properties.21 For example, single QD-loaded phospholipid vesicles,22 liposomes23 or micelles24,25 were successfully used in bio-imaging applications in aqueous and biological systems. QD-encapsulated liposome as FRET probe has also been developed for monitoring the enzymatic activity of PLA2.26
Herein, we developed a fluorescent assay using quantum dot clusters (QDC)-loaded phospholipid micelle as probe for PLA2 detection. The phospholipid layer was labeled with the fluorophore and photostable QDC was acted as quencher. Fluorescent assays of PLA2 activity and its inhibitor were investigated.
Results and discussion
Principle for sensing PLA2 using QDC-loaded phospholipid micelles
It is well known that inorganic nanomaterials, such as gold nanoparticles,27 iron oxide nanocrystals28 and graphene,29 can quench fluorescence emission from a range of organic fluorophores with extraordinarily high efficiency. Here, a fluorescent probe for PLA2 activity was designed using QDC as a quencher. As shown in Scheme 1, the probe consisted of hydrophobic QDC and phospholipid layer. To act as PLA2-responsive fluorescent probe, small percentage of NBD-PC was also incorporated into micelle shell. The fluorophore NBD was attached to the sn-2 position of the phospholipid, which could be released by the PLA2 hydrolysis. In its “off-state”, the QDC quenched the fluorescence of the NBD. However, quenching effect disappeared when NBD was released from phospholipid by the PLA2 hydrolysis, representing the “on-state”. The fluorescence response based on these QDC-loaded phospholipid micelles could be used for the detection of PLA2.
 |
| Scheme 1 Schematic of QDC-loaded phospholipid micelles and analytical principle of the probe for activity assay of PLA2. | |
Overview of QDC-loaded phospholipid micelles
Hydrophobic CdSe/ZnS QDs were characterized with mean diameters of approximately 16 nm, as measured by TEM (Fig. 1a). Quantum dots-loaded phospholipid micelles were prepared by emulsification of QD and phospholipid in aqueous solution.28,30 The size and spatial arrangement of particles in the micelles was shown in Fig. 1b. The QD-loaded micelles were formed consisting of a core with densely packed QD nanoparticles. The core with densely packed QD nanoparticles was called QDC. DLS measurements revealed that the hydrodynamic size of the final micelles was of 100 nm (Fig. 1c), indicating that the QDC-loaded phospholipid micelles was formed. The low polydispersity (0.17) is a measure of the relative uniformity between the QDCs formed, which is suggestive of growth occurring via monomer-cluster growth mechanism.31 Notably, the QDC-loaded micelles were highly stable in storage (4 °C) for at least 30 days, with no apparent change in the average hydrodynamic diameter or size distribution. Therefore, the hydrophobic nature of the QDs could prevent the QDC-loaded phospholipid micelles from breaking up in the aqueous environment, while the presence of the lipid at the surface of the QDC-loaded phospholipid micelles maintained stability against coalescence.32 For comparison, single QD-loaded phospholipid micelles were also prepared, as shown in Fig. S1 (ESI†). Compared with QD, no significant change in size was observed for single QD-loaded phospholipid micelles.
 |
| Fig. 1 Characterization of QDC-loaded phospholipid micelles. (a) TEM image of quantum dot. (b) TEM image of a QDC-loaded phospholipid micelle. (c) Dynamic light scattering profile of QDC-loaded phospholipid micelles in HEPES buffer. | |
Sensing of PLA2 activity
CdSe/ZnS QD had an emission maximum at 625 nm with a broad absorption range below 650 nm (Fig. S2 and S3, ESI†). NBD fluorophore had an emission maximum at 545 nm with 460 nm excitation (Fig. S4, ESI†). Therefore, probe with 460 nm excitation resulted in FRET between the QD and NBD molecules. As shown in Fig. 2 (curve a), total quenching of NBD fluorescence and a significant emission with a maximum at 625 nm (typical for QD emission) was observed. Ratio of QD and NBD fluorescence reached 11-fold, suggests that the energy transfer was complete. The addition of PLA2 (100 U L−1) resulted in an increase in NBD fluorescence that was accompanied by a decrease in QDC fluorescence (Fig. 2, curve b). A 10-fold increase in the NBD fluorescence was obtained after 1 h. This indicates that NBD was released to solution and the fluorescence of NBD was restored. Fig. 2 (curve c) shows the fluorescence spectra of probe after addition of Triton X100. It is apparent the emission intensity of the NBD significant increases whereas the luminescence intensity of the QD further decreases, and a 17-fold increase in the NBD fluorescence was obtained. This indicates that the complete release of the NBD on treatment of the probes with a detergent. The remaining QD fluorescence resulted from direct excitation of QDCs. Control fluorescence measurements on single QD-NBD micelles were conducted to explore the impact of single QD on NBD fluorescence. Compared with the probe, an obvious NBD fluorescence was observed and ratio of QD and NBD fluorescence is 2-fold (Fig. 2, curve d), indicates that single QD could not effectively quench NBD fluorescence. Further, when probes were incubated in HEPES buffer, no change in fluorescence was observed over a 24 h time period. Therefore, it was expected that the PLA2-triggered release of NBD could be monitored fluorometrically because of the efficient quenching of NBD fluorescence in the probes.
 |
| Fig. 2 Fluorescence spectra of (a) probes, (b) probes after addition of PLA2 (100 U L−1), (c) probes after addition of Triton X100, and (d) the single QD-loaded phospholipid micelles. | |
The ability for the PLA2 assay of probes was evaluated by measuring the fluorescence intensity as a function of time. The PLA2 activity assay relies on the intensity changes in the NBD fluorescence, and measurements were conducted at room temperature for enzyme concentrations of 50 U mL−1. As shown in Fig. 3A, the initial fluorescence intensity of the probe was rather weak, but the fluorescence increase was observed after addition of PLA2 within 60 min. PLA2 is a family of water-soluble enzymes that acts with calcium ion (Ca2+) as a cofactor, therefore, repeated measurement in the absence of Ca2+ is a useful control study. As expected, no change in fluorescence was observed in the presence of the calcium chelator EDTA (ethylenediaminetetraacetic acid), indicating that the fluorescence of the system is dependent on the PLA2-mediated hydrolysis of the lipids, rather than simply the presence of the enzyme. To further test the specificity of this probe toward PLA2, change of the probe fluorescence in the presence of PLC or PLD (each 100 U L−1) was investigated. Almost no response was observed in these cases, indicating that phospholipases PLC and PLD did not interfere in the determination of PLA2 although they can catalyze the hydrolysis of phospholipids.
 |
| Fig. 3 Fluorescence response of the probes to PLA2: (A) in the absence (a) and presence (b) of Ca2+; (B) with different enzyme concentrations; (C) in the presence of different concentrations inhibitor. PLA2 concentration, 50 U L−1. Ex, 460 nm, Em, 545 nm. | |
The sensitivity of the assay was investigated using varying PLA2 concentrations. The results were shown in Fig. 3B. The fluorescence responses increased with increasing PLA2 concentration from 5 to 400 U L−1. Compared with about 7.1-fold increase in fluorescence intensity using iron oxide nanocrystals as quencher,28 a 23-fold increase was obtained using the probe when 300 U L−1 PLA2 was determined due to low background signal of the probe. The peak fluorescence readouts at 545 nm were dynamically increased with increasing concentrations of PLA2 within the range of 5–200 U L−1, and a correlation coefficient of 0.994 was obtained (Fig. S5†). The detection limit of 3 U L−1 was achieved based on the signal-to-noise ratio (S/N = 3). This simple and sensitive assay for PLA2 activity allowed us to extend its application, for example, developing an enzyme inhibitor assay. LY311727, an inhibitor of phosphatidylcholine-specific PLA2, was tested to examine the inhibition of PLA2 activity. Fig. 3C shows the effect of LY311727 concentration on the activity of PLA2. As can be seen, the activity of PLA2 decreased with an increase in LY311727 concentration. These results suggest that the probe has a potential for screening inhibitors of PLA2.
The effect of LY311727 on the activity of PLA2 was examined and the fluorescence intensities decreased gradually with the increase of concentration of LY311727, indicating the inhibition of PLA2 activity by LY311727 (Fig. S6†). The IC50 value was calculated to be 52 μM.
Experimental
Chemicals and reagents
Hydrogenated soy phosphatidylcholine (HSPC), 1-palmitoyl-2-{6-[(7-nitro-2-1,3-benzoxadiazol-4-yl)amino]hexanoyl}-sn-glycero-3-phosphocholine (NBD PC) were purchased from Avanti Polar Lipids, Inc. Inhibitor 3-[3-(2-amino-2-oxoethyl)-1-benzyl-2-ethylindol-5-yl]oxypropylphosphonic acid (LY311727) was obtained from Santa Cruz Biotechnology, Inc. Phospholipase A2 (PLA2) from Naja mossambica, phospholipase C (PLC) from Clostridium perfringens, phospholipase D (PLD) from cabbage and Triton X-100 were purchased from Sigma-Aldrich Co. Hydrophobic CdSe/ZnS QD (Q1625, 16 nm) was purchased from Wuhan Jiayuan quantum dots Corporation, Ltd. Stock solution of HSPC was prepared by dissolving HSPC in chloroform to a concentration of 50 mg mL−1. Other chemicals and reagents were commercially available and were of analytical grade. Water was obtained by Millipore Milli-Q purification system.
Apparatus
Fluorescence spectra measurements were done on a F7000 spectrofluorometer (Hitachi, Japan). Dynamic light scattering (DLS) measurements were performed on a Zetasizer Nano from Malvern Instruments. Transmission electron microscopy (TEM, JEM-1010) was used to determine the size and morphology of QD and QDC-loaded phospholipid micelles.
Synthesis of QDC-loaded phospholipid micelles
QDC-loaded phospholipid micelles were prepared using an oil-in-water emulsion-based self-assembly method. A mixture containing HSPC (0.88 mg), NBD PC (0.1 mg) and QD (1 mg) in 150 μL chloroform was injected into a glass vial containing 3 mL of water, and the sample was sonicated until a homogenous mixture was obtained. The chloroform was then allowed to evaporate overnight. Following that, QDC-loaded phospholipid micelles samples were centrifuged at 1000 rpm for 30 minutes to remove large aggregates. To obtain the QDC-loaded micelle, the resulting supernatant was centrifuged at 3000 rpm for half hour, and the pellet was resuspended in water (1 mL). To obtain the single QD-loaded micelle, the resulting supernatant was then centrifuged at 10
000 rpm for half hour, and the pellet was resuspended in water (1 mL). The collected samples of QDC- and QD-loaded phospholipid micelles were stored in the dark at 4 °C.
Sensing of PLA2 and inhibitory assay
Aliquots (900 μL) of 10.0 mM HEPES (N-2-hydroxyethylpiperazine-N-ethane-sulphonicacid) buffer (pH 7.4) containing 2.0 mM CaCl2 and probes (50 μL) were firstly prepared. PLA2 (50 μL) were then added to the solution, and fluorescence was then recorded.
For the inhibitor assay, LY311727 was preincubated with PLA2 (50 unit per L) in 50 μL of HEPES buffer for 20 min before adding to the probe sample.
Conclusions
We developed a fluorescent probe based on the phospholipid micelle encapsulated QDC for the PLA2 activity assay. Fluorescence of NBD-labeled phospholipid was quenched by QDC, as the phospholipid layer is digested by the enzyme and fluorescence of NBD is restored. Compared with single QD, use of QDC enables improve quenching efficiency. The probe provided high sensitivity (LOD: 3 U L−1). In addition to determining phospholipase levels, the probe can be used to identify and study PLA2 inhibitors.
Acknowledgements
The authors gratefully acknowledge the financial support from the National Nature Science Foundation of China (no. 21175089 and 91332101), Program for Changjiang Scholars and Innovative Research Team in University (IRT-14R33), Program for Innovative Research Team in Shaanxi Province (No. 2014KCT-28), the Natural Science Basic Research Plan in Shaanxi Province of China (no. 2013SZS08-Z01 and 2013SZS08-P01), and the Fundamental Research Funds for the Central Universities (no. GK21405003 and GK261001080). This work was also supported in part by the National Institutes of Health NCI R01CA175480 (ZC).
Notes and references
- E. A. Dennis, J. Cao, Y. H. Hsu, V. Magrioti and G. Kokotos, Chem. Rev., 2011, 111, 6130–6185 CrossRef CAS PubMed.
- A. Kalyvas and S. David, Neuron, 2004, 41, 323–335 CrossRef CAS PubMed.
- H. W. M. Niessen, P. A. J. Krijnen, C. A. Visser, C. J. L. M. Meijer and C. Erik Hack, Cardiovasc. Res., 2003, 60, 68–77 CrossRef CAS PubMed.
- G. Y. Sun, J. Xu, M. D. Jensen and A. Simonyi, J. Lipid Res., 2004, 45, 205–213 CrossRef CAS PubMed.
- J. P. Laye and J. H. Gill, Drug Discovery Today, 2003, 8, 710–716 CrossRef CAS PubMed.
- C. Ehnholm and T. Kuusi, Methods Enzymol., 1986, 129, 716–738 CAS.
- M. Jimenez, J. Cabanes, F. Gandia-Herrero, J. Escribano, F. Garcia-Carmona and M. Perez-Gilabert, Anal. Biochem., 2003, 319, 131–137 CrossRef CAS PubMed.
- V. M. Mirsky, M. Mass, C. Krause and O. S. Wolfbeis, Anal. Chem., 1998, 70, 3674–3678 CrossRef CAS PubMed.
- L. J. Reynolds, W. N. Washburn, R. A. Deems and E. A. Dennis, Methods Enzymol., 1991, 197, 3–23 CAS.
- Z. Cheng and A. Tsourkas, Sci. Rep., 2014, 4, 6958 CrossRef CAS PubMed.
- T. Bayburt, B. Z. Yu, I. Street, F. Ghomashchi, F. Laliberte, H. Perrier, Z. Wang, R. Homan, M. K. Jain and M. H. Gelb, Anal. Biochem., 1995, 232, 7–23 CrossRef CAS PubMed.
- O. Wichmann and C. Schultz, Chem. Commun., 2001, 23, 2500–2501 RSC.
- O. Wichmann, J. Wittbrodt and C. Schultz, Angew. Chem., Int. Ed., 2006, 45, 508–512 CrossRef CAS PubMed.
- T. M. Rose and G. D. Prestwich, ACS Chem. Biol., 2006, 1(2), 83–92 CrossRef CAS PubMed.
- H. S. Hendrickson, E. K. Hendrickson, I. D. Johnson and S. A. Farber, Anal. Biochem., 1999, 276, 27–35 CrossRef CAS PubMed.
- D. Aili, M. Mager, D. Roche and M. M. Stevens, Nano Lett., 2011, 11, 1401–1405 CrossRef CAS PubMed.
- L. Sarda and P. Desnuelle, Biochim. Biophys. Acta, 1958, 30, 513–521 CrossRef CAS.
- S. H. Chen, Y. P. Hsu, H. Y. Lu and J. A. Ho, Biosens. Bioelectron., 2014, 52, 202–208 CrossRef CAS PubMed.
- S. Chemburu, E. Ji, Y. Casana, Y. Wu, T. Buranda, K. S. Schanze, G. P. Lopez and D. G. Whitten, J. Phys. Chem., 2008, 112, 14492–14499 CrossRef CAS PubMed.
- S. Y. Okada, R. Jelinek and D. Charych, Angew. Chem., Int. Ed., 1999, 38, 655–659 CrossRef CAS.
- R. Gill, M. Zayats and I. Willner, Angew. Chem., Int. Ed., 2008, 47, 7602–7625 CrossRef CAS PubMed.
- G. Gopalakrishnan, C. Danelon, P. Izewska, M. Prummer, P. Y. Bolinger, I. Geissbhler, D. Demurtas, J. Dubochet and H. Vogel, Angew. Chem., Int. Ed., 2006, 45, 5478–5483 CrossRef CAS PubMed.
- W. Zheng, Y. Liu, A. West, E. E. Schuler, K. Yehl, R. B. Dyer, J. T. Kindt and K. Salaita, J. Am. Chem. Soc., 2014, 136, 1992–1999 CrossRef CAS PubMed.
- B. Dubertret, P. Skourides, D. J. Norris, V. Noireaux, A. H. Brivanlou and A. Libchaber, Science, 2002, 298, 1759–1762 CrossRef CAS PubMed.
- O. Carion, B. Mahler, T. Pons and B. Dubertret, Nat. Protoc., 2007, 2, 2383–2390 CrossRef CAS PubMed.
- V. R. Kethineedi, G. Crivat, M. A. Tarr and Z. Rosenzweig, Anal. Bioanal. Chem., 2013, 405, 9729–9737 CrossRef CAS PubMed.
- U. H. F. Bunz and V. M. Rotello, Angew. Chem., Int. Ed., 2010, 49, 3268–3279 CrossRef CAS PubMed.
- Q. Gao, L. Yan, M. Chiorazzo, E. J. Delikatny, A. Tsourkasa and Z. Cheng, Chem. Commun., 2015, 51, 12313–12315 RSC.
- S. J. Liu, Q. Wen, L. J. Tang and J. H. Jiang, Anal. Chem., 2012, 84, 5944–5950 CrossRef CAS PubMed.
- P. Chantal, P. Lilianne, K. Arnold and S. Benoit, Langmuir, 2010, 26, 5388–5396 CrossRef PubMed.
- D. V. Haute, J. M. Longmate and J. M. Berlin, Adv. Mater., 2015, 1–7 Search PubMed.
- L. Ye, K. T. Yong, L. Liu, I. Roy, R. Hu, J. Zhu, H. Cai, W. C. Law, J. Liu, K. Wang, J. Liu, Y. Liu, Y. Hu, X. Zhang, M. T. Swihart and P. N. Prasad, Nat. Nanotechnol., 2012, 7, 453–458 CrossRef CAS PubMed.
Footnote |
† Electronic supplementary information (ESI) available. See DOI: 10.1039/c5ra25292j |
|
This journal is © The Royal Society of Chemistry 2016 |
Click here to see how this site uses Cookies. View our privacy policy here.