
Metabolite identification and pharmacokinetic study of Lamiophlomis rotata in rats†
Feng Zhanga,
Mingping La‡
a,
Xiaobin Gonga,
Shouhong Gaoa,
Zhijun Wua,
Lianna Sunb,
Xia Taoa and
Wansheng Chen*a
aDepartment of Pharmacy, Changzheng Hospital, Second Military Medical University, 415 Fengyang Road, Shanghai 200003, P. R. China. E-mail: chenwansheng@smmu.edu.cn; chenwanshengsmmu@aliyun.com
bDepartment of Identification of Traditional Chinese Medicine, School of Pharmacy, Second Military Medical University, 325 Guohe Road, Shanghai 200433, P. R. China
First published on 15th February 2016
Abstract
An ultra-high performance liquid chromatography coupled with time-of-flight mass spectrometry technique and a subsequent LC-MS/MS method were developed for metabolite profile study of Lamiophlomis rotata extract after its oral administration. Metabolite profile analysis for plasma, bile, urine and feces were performed on a sub-2-μm analytical column, and showed that 39 prototypes and 47 metabolites were identified or tentatively characterized. More than half the metabolites underwent phase II reaction, including sulfate, glucuronide, taurine, glycine, and glutathione conjugation. The targeted and valid LC-MS/MS method, using one-step protein precipitation for rat plasma, was applied for the pharmacokinetic study of shanzhiside methyl ester, 8-O-acetylshanzhiside methyl ester, lamalbid, verbascoside, forsythoside B, and luteolin-7-O-β-D-glucopyranoside. Pharmacokinetics results showed that six bioactive components did not vary significantly in rats after administration of the aerial parts and the whole plant, which was consistent with the metabolite profile comparison between two groups. This article contributes to the understanding of the metabolism of L. rotata, and provides detailed performance analysis and scientific data to support the medicine parts alteration in the Chinese Pharmacopoeia.
Introduction
Lamiophlomis rotata (Benth.) Kudo (Duyiwei in Chinese), a famous Traditional Chinese Medicine (TCM) recorded in the Chinese Pharmacopoeia,1,2 is commonly used in clinical practice for its variety of pharmaceutical effects, including pain relief, anti-inflammation, hemostasis, blood circulation promotion, and osteoporosis alleviation.3 The major bioactive compounds of L. rotata could be classified into three groups: iridoids (such as shanzhiside methyl ester and 8-O-acetylshanzhiside methyl ester), flavonoids (such as luteolin and luteolin-7-O-β-D-glucopyranoside), and phenylethanoid glycosides (such as forsythoside B and verbascoside).4–9In our previous report, ultra-high performance liquid chromatography coupled with time-of-flight mass spectrometry (LC-TOF/MS) method has been established to study the chemical constituents of L. rotata, revealing a total of 48 compounds,10 which delineated the chemical profile in vitro. As grown awareness that TCM metabolism and pharmacokinetic studies played as determinants of the TCM action in vivo, many modern research on TCMs and TCM preparations were engaged in these studies, to discover the phytochemical constituents necessary for therapeutic efficacy.11 However, there was sparse data of its in vivo metabolism study, except one report which only investigated pharmacokinetics of four iridoids after rabbits following intravenous administration of iridoids extraction of L. rotata.12 Thus, to clarify components “which were absorbed” (chemical constituents of the original TCM) and “which were produced” (bio-transformed metabolites) became the basis for metabolism and pharmacokinetics studies of L. rotata, which was the core of the plasma pharmacochemistry.13–16 Moreover, both qualitative and quantitative analysis for L. rotata in vitro showed that the chemical profile for the aerial parts and the whole plant from different areas did not vary significantly,10 which approved the reasonable medicine parts alteration,1,2,17 but whether in vivo metabolism evidence consistency for the two medicine parts was the same as the above conclusion was still unclear.
In this study, a LC-TOF/MS method was established to analyze L. rotata metabolism from different biological matrix including rat plasma, urine, feces and bile after oral administration. Besides, the pharmacokinetics of shanzhiside methyl ester, 8-O-acetylshanzhiside methyl ester, lamalbid, verbascoside, forsythoside B, and luteolin-7-O-β-D-glucopyranoside (Fig. 1) were studied by a fully validated LC-MS/MS method. Then, the qualitative and quantitative in vivo metabolism data were compared in rats after administration of the aerial parts and the whole plant.
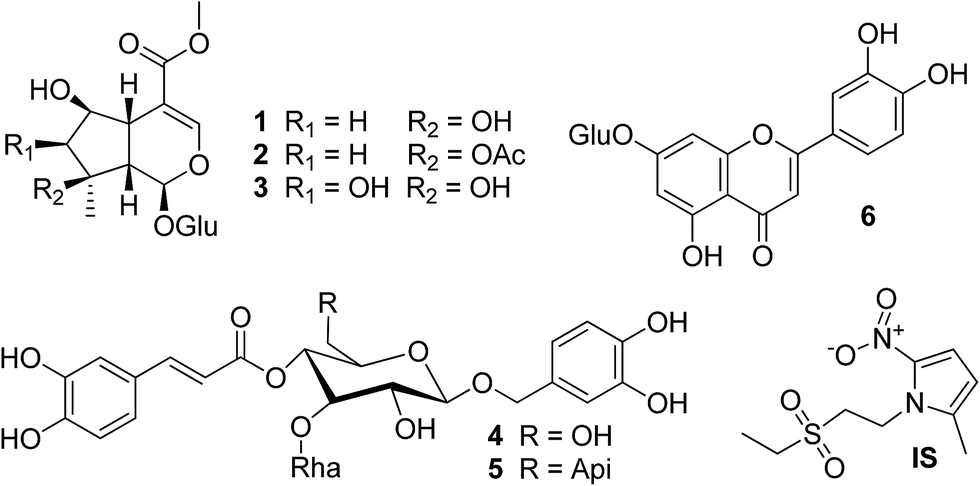 | ||
| Fig. 1 Chemical structures of the six bioactive marker compounds: shanzhiside methyl ester (1), 8-O-acetylshanzhiside methyl ester (2), lamalbid (3), verbascoside (4), forsythoside B (5), luteolin-7-O-β-D-glucopyranoside (6) and tinidazole (IS). | ||
Materials and methods
Chemicals, reagents, drug preparation and animals
31 standard compounds (ESI, Table S1†) were isolated in our laboratory from L. rotata. All structures were confirmed by UV, MS, 1H and 13C NMR spectral data with reported literature values (≥98%).Acetonitrile (Merck, Darmstadt, Germany) and formic acid (Tedia, Fairfield, OH, USA) were of HPLC grade. Deionized water was prepared by a Milli-Q50SP Reagent Water System (Bedford, MA, USA). Other reagents were of analytical grade.
The aerial parts (0351A) and the whole plant (0351W) of L. rotata (Yushu, Qinghai) were extracted by 50% ethanol and the extract was prepared according to previous methods, and the amounts of the investigated six biomarkers were analyzed by the established HPLC-UV method to assess the quality homogeneity.10
Experiments on animals were approved by the Animal Ethics Committee of Second Military Medical University. Sprague-Dawley rats (200 ± 20 g), obtained from Shanghai SLAC laboratory animal Co. Ltd. (Shanghai, China), were housed for 5 days acclimation, with temperature of 20 ± 1 °C, relative humidity of 50 ± 10% and 12 h light–dark cycle, and fed with water and normal food ad libitum.
Biological samples collection and pretreatment for qualitative analysis
For metabolites elucidation, 15 male Sprague-Dawley rats (200 ± 20 g) were randomly divided into three groups: A1-aerial parts group (n = 6), B1-whole plant group (n = 6) and C1-control group (n = 3). For groups A1 and B1, a single dose of 0.3 g kg−1 L. rotata extract which was dissolved in 0.5% CMC-Na solution (4 mL, equivalent to 3.0 g kg−1 of crude drugs), was orally administrated to rats twice a day for two consecutive days. Rats in group C1 received normal saline (4 mL).Blank blood, bile, urine and feces samples were collected from the control group. All samples were stored at −80 °C until analysis. The retro-orbital blood samples were withdrawn via the cannular into the heparinized tubes at 30 min post-dosing of L. rotata extract. Plasma was obtained by centrifuging for 10 min at 4000 × g at 4 °C. Urine and feces samples were collected from the metabolism cages during the 24–36 h after the first oral administration. Two rats in groups A1 and B1 were fixed on a wooden plate and anesthetized by intraperitoneal injection of 10% aqueous chloral hydrate after the last dose. An abdominal incision was made and common bile duct was cannulated with polyethylene tubes for consecutive collection of bile samples, which were collected for 15 min once they were secreted. Then the incision was closed by suture.
Each sample of plasma, bile and urine was mixed and vortexed with methanol for 30 s and centrifuged at 20![[thin space (1/6-em)]](https://www.rsc.org/images/entities/char_2009.gif) 000 × g for 10 min at 4 °C. Plasma or bile (100 μL) was mixed with methanol (200 μL) with a ratio of 1:2 in volume, while urine (1.5 mL) was 1:1. The supernatant was evaporated to dryness by N2 (gentle stream, 37 °C) and then the obtained residue was dissolved by 6% acetonitrile (100 μL) and centrifuged at 20000 × g for 10 min. The subsequent supernatants were applied to the LC-TOF/MS analysis.
000 × g for 10 min at 4 °C. Plasma or bile (100 μL) was mixed with methanol (200 μL) with a ratio of 1:2 in volume, while urine (1.5 mL) was 1:1. The supernatant was evaporated to dryness by N2 (gentle stream, 37 °C) and then the obtained residue was dissolved by 6% acetonitrile (100 μL) and centrifuged at 20000 × g for 10 min. The subsequent supernatants were applied to the LC-TOF/MS analysis.
Feces (1 g) were extracted exhaustively with 20 mL methanol by ultrasonication, and 2 mL of the supernatant was evaporated to dryness by N2. The dried residue was dissolved by 1 mL of 6% acetonitrile and centrifuged at 20000 × g for 10 min. The obtained supernatants were applied to injection.
Plasma collection and pretreatment for quantitative analysis
For pharmacokinetic study, 15 rats were grouped into three groups. Rats in drug groups were orally administrated with L. rotata extract at a single dose of 0.8 g kg−1: A2-aerial parts group (n = 6) and B2-whole plant group (n = 6). Rats in group C2 received normal saline (4 mL).Blood samples (about 250 μL) were collected in 1.5 mL heparinized polythene tubes at 0.083, 0.25, 0.5, 1, 1.5, 2, 3, 4, 6, 8, 12 and 24 h after administration. Plasma was obtained by centrifuging for 10 min at 4000 × g at 4 °C. Methanol adding 0.1% formic acid and IS (tinidazole 200 ng mL−1, 300 μL) was added to plasma samples (100 μL). The mixture was centrifuged at 13000 rpm for 10 min after vortex-mixing for 3 min, and then the obtained supernatant (200 μL) was transferred into another tube and evaporated to dryness by N2. The dried residue was reconstituted with 8% acetonitrile (400 μL) and the subsequent supernatants (10 μL) were applied to the LC-MS/MS analysis. Pharmacokinetic parameters were calculated using Drug and Statistics (DAS) 3.2.6 (2.0, Mathematical Pharmacology Professional Committee of China, Shanghai, China) using noncompartmental pharmacokinetic model. Significance of pharmacokinetic parameters between two groups was assessed by t-tests and P value less than 0.05 was considered as significant (SPSS 17.0 statistical software).
Standard solutions preparation for quantitative analysis
The standard stock solutions were prepared by dissolving six analytes in methanol and then diluted by 10% methanol at appropriate amount to obtain a series of standard working solutions. A 200 ng mL−1 IS working solution was also prepared through diluting the stock solution by methanol with 0.1% formic acid. Calibration solutions were prepared by mixing the standard working solutions with blank rat plasma at appropriate amount: 1.00, 2.50, 7.50, 12.50, 25.00, 37.50, and 62.50 ng mL−1 for lamalbid, 4.00, 10.00, 30.00, 50.00, 100.00, 150.00, and 250.00 ng mL−1 for shanzhiside methyl ester, 8-O-acetylshanzhiside methyl ester and verbascoside, 3.50, 7.00, 25.00, 50.00, 100.00, 150.00, and 250.00 ng mL−1 for forsythoside B, and 0.40, 1.00, 3.00, 5.00, 10.00, 15.00, and 25.00 ng mL−1 for luteolin-7-O-β-D-glucopyranoside. Quality control (QC) samples were prepared in the same way: 2.25, 4.50, and 22.50 ng mL−1 for lamalbid, 9.00, 18.00, and 90.00 ng mL−1 for shanzhiside methyl ester and 8-O-acetylshanzhiside methyl ester, 8.00, 16.00, and 90.00 ng mL−1 for verbascoside, 4.50, 9.00, and 45.00 ng mL−1 for forsythoside B, and 1.00, 2.00, and 10.00 ng mL−1 for luteolin-7-O-β-D-glucopyranoside. All samples were stored at −20 °C before analysis.LC-MS method for qualitative analysis of L. rotata in rat biological samples
LC-TOF/MS analysis was carried out on an Agilent 1290 series UHPLC coupled with a 6538 TOF mass spectrometer equipped with an electrospray ionization interface (Agilent Technologies, Santa Clara, CA, USA). Waters ACQUITY TM HSS T3 C18 column (100 mm × 2.1 mm, 1.8 μm) was applied for separation: flow rate, 0.3 mL min−1; column temperature, 35 °C; injection volume, 2 μL; post time, 5 min. Mobile phases were composed of acetonitrile (phase A) and 0.1% aqueous formic acid solution (phase B), with a gradient elution program: 6–13% A (0–14 min), 13–20% A (14–24 min), 20–31% A (24–28 min) and 31–95% A (28–30 min). Mass-spectrometric conditions were optimized as follows: drying gas flow 11.0 L min−1, capillary voltage 4 kV, nebulizer pressure 40 psi, drying gas temperature 350 °C, sheath gas temperature 400 °C. Mass spectra were recorded in the range of m/z 100–1000 in both negative and positive ion modes.LC-MS method for quantitative analysis of L. rotata in rat plasma
Assays were performed on an Agilent 1200 series HPLC and interfaced to a 6410 triple-quadrupole ESI-MS (Agilent Technologies, Santa Clara, CA, USA). Agilent Zorbax SB-C18 column (2.1 mm × 100 mm, 3.5 μm) was applied for separation: flow rate, 0.4 mL min−1; column temperature, 35 °C; injection volume, 10 μL; post time, 5 min. Mobile phases were composed of acetonitrile with 0.1% formic acid (phase C) and 0.1% aqueous formic acid solution (phase D), with a gradient elution program: 8–40% C (0–1 min), 40–95% C (1–4 min) 95% C (4–5 min). Multiple reaction monitoring (MRM) in the negative mode with tinidazole as internal standard (IS) was applied for compounds analysis (Table 1). Parameters for detection were optimized as follows: drying gas flow 10 L min−1, capillary voltage 4.0 kV, nebulizer pressure 40 psi, gas temperature 350 °C, and collision-induced dissociation (CID) gas pressure 0.1 MPa. All data were acquired and analyzed using Agilent 6410 Quantitative Analysis version B.01.02 analyst data processing software (Agilent Corporation, MA, USA).| Compound | Mass | Prec ion (m/z) | Prod ion (m/z) | Frag (V) | CE (eV) |
|---|---|---|---|---|---|
| Shanzhiside methyl ester | 406.1475 | 451.3 | 243.2 | 125 | 15 |
| 8-O-Acetylshanzhiside methyl ester | 448.1581 | 493.2 | 225.1 | 120 | 18 |
| Lamalbid | 422.1424 | 467.2 | 259.1 | 140 | 14 |
| Verbascoside | 624.2054 | 623.2 | 161.1 | 150 | 38 |
| Forsythoside B | 756.2477 | 755.2 | 161.1 | 140 | 44 |
| Luteolin-7-O-β-D-glucopyranoside | 448.1006 | 447.1 | 285.2 | 190 | 30 |
| Tinidazole (IS) | 246.0674 | 246.0 | 125.9 | 80 | 4 |
The developed method was validated for selectivity, linearity, sensitivity, precision, accuracy, matrix effects, recovery and stability according to the US Food and Drug Administration (FDA) bioanalytical method validation guidance.18 Selectivity was tested by comparison of six individual blank rat plasma samples with corresponding spiked plasma samples with the analytes and IS. Calibration curves were presented as y = ax + b, where y was the peak area ratios (analyte/IS) and x was the analytes concentration prepared (seven different levels) using weighed (1/x2) least squares regression analysis. The lowest concentration of the calibration curve was determined as the lower limit quantification (LLOQ), with a maximum relative standard deviation (RSD, viz. precision) and relative error (RE, viz. accuracy) less than 20%. Accuracy and precision were evaluated in six replicates analyses for analytes and IS at three QC levels on three consecutive days. Matrix effect was assessed by comparing the analytes peak areas in the standard solutions dissolved in the pretreated bland rat plasma with those in the 10% methanol at the same concentration. Extraction recovery was calculated by comparing the analytes peak areas in the pre- with post-extracted samples. Stability was investigated under four storage conditions, respectively: 6 h at autosampler at room temperature; after three frozen (−20 °C)–thaw (room temperature, spontaneously) cycles; after storage at −20 °C for one month. Data was obtained from comparing the detected concentrations with the original analyte concentrations of QC samples.
Result and discussion
Qualitative analysis
The other peaks (M1–M47), which were found to exist only in the drug-containing rat biological samples but not in the extract, would be the possible metabolites of the L. rotata constituents. According to the origins of parent compounds and structural types, all these metabolites were categorized as iridoids-, phenylethanoid glycosides-, flavonoids-, norisoprenoid-, phenolic-, and glucide-related (Table 2). 47 metabolites were detected mainly including sulfate, glucuronide and taurine conjugates. TOF/MS analysis gave high-accuracy [M − H]− ions for most of these metabolites. Their structures were identified as followed, in accordance with the drug metabolism rules.24
| Peak no. | RT (min) | Formula | Precursor ions | Selected mode | Metabolite name | MS/MS fragment ions | Class | Source | |||
|---|---|---|---|---|---|---|---|---|---|---|---|
| P | U | F | B | ||||||||
| a I – iridoids, F – flavonoids, PG – phenylethanoid glycosides, N – nortriterpenoid, P – phenolic compounds and G – glycoside compounds; P-plasma, U-urine, F-feces and B-bile; M-metabolite. | |||||||||||
| M1 | 1.580 | C17H29NO9 | 392.1909 | [M + H]+ | Glutathione conjugation | 262.6784[M + H–GSH] | PG-M | ✓ | ✓ | ✓ | |
| M2 | 4.046 | C27H40O18 | 651.2101 | [M − H]− | Glucuronide conjugation | 476.1887[M − H–GlcUA] | PG-M | ✓ | ✓ | ||
| M3 | 5.372 | C34H44O22S | 835.1976 | [M − H]− | Sulfation conjugation | 755.2475[M − H–SO3] | PG-M | ✓ | ✓ | ||
| Hydroxylation | 593.2120[M − H–Glc] | ||||||||||
| M4 | 5.686 | C29H36O18S | 703.1546 | [M − H]− | Sulfation conjugation | 623.1983[M − H–SO3] | PG-M | ✓ | ✓ | ||
| Hydroxylation | 461.1672[M − H–Glc] | ||||||||||
| M5 | 8.775 | C40H52O25 | 931.2727 | [M − H]− | Glucuronide conjugation | 755.2388[M − H–GlcUA] | PG-M | ✓ | ✓ | ||
| Hydroxylation | 593.2100[M − H–Glc] | ||||||||||
| M6 | 9.813 | C35H44O21 | 799.2306 | [M − H]− | Glucuronide conjugation | 623.1914[M − H–GlcUA] | PG-M | ✓ | ✓ | ||
| M7 | 14.337 | C31H41NO17S | 730.2045 | [M − H]− | Taurine conjugation | 622.9417[M − H–Tau] | PG-M | ✓ | |||
| M8 | 1.314 | C17H26O15S | 501.094 | [M − H]− | Sulfation conjugation | 421.1834[M − H–SO3] | I-M | ✓ | |||
| M9 | 1.330 | C23H32O17 | 581.1733 | [M + H]+ | Glucuronide conjugation | 405.0991[M + H–GlcUA] | I-M | ✓ | ✓ | ✓ | |
| M10 | 2.184 | C17H24O14S | 483.0828 | [M − H]− | Sulfation conjugation | 403.0824[M − H–SO3] | I-M | ✓ | ✓ | ✓ | |
| M11 | 2.386 | C17H20O13S | 467.0837 | [M − H]− | Sulfation conjugation | 388.0905[M − H–SO3] | I-M | ✓ | |||
| M12 | 2.386 | C17H20O13S | 467.0841 | [M − H]− | Sulfation conjugation | 388.0905[M − H–SO3] | I-M | ✓ | |||
| M13 | 2.841 | C17H24O14S | 483.0823 | [M − H]− | Sulfation conjugation | 403.2533[M − H–SO3] | I-M | ✓ | ✓ | ||
| M14 | 2.880 | C20H30O15S | 543.1384 | [M + H]+ | Sulfation conjugation | 463.0844[M + H–SO3] | I-M | ✓ | ✓ | ||
| M15 | 3.020 | C26H38O18 | 639.2118 | [M + H]+ | Glucuronide conjugation | 463.0845[M + H–GlcUA] | I-M | ✓ | ✓ | ✓ | |
| 287.0491[M + H–GlcUA-GlcUA] | |||||||||||
| M16 | 3.134 | C17H24O15S | 499.0773 | [M − H]− | Sulfation conjugation | 419.9153[M − H–SO3] | I-M | ✓ | |||
| M17 | 3.138 | C23H34O16 | 565.1771 | [M − H]− | Glucuronide conjugation | 389.0320[M − H–GlcUA] | I-M | ✓ | ✓ | ✓ | |
| M18 | 3.525 | C19H29NO12S | 540.1364 | [M + HCOO]− | — | 349.0853, 317.2356, 293.2886 | I-M | ✓ | |||
| M19 | 3.630 | C23H34O17 | 583.1872 | [M + H]+ | Glucuronide conjugation | 406.5946[M + H–GlcUA] | I-M | ✓ | ✓ | ✓ | |
| M20 | 3.868 | C23H32O17 | 579.1359 | [M − H]− | Glucuronide conjugation | 403.0996[M − H–GlcUA] | I-M | ✓ | |||
| M21 | 4.743 | C17H25ClO14S | 519.0602 | [M − H]− | Sulfation conjugation | 438.6176[M − H–SO3] | I-M | ✓ | |||
| M22 | 5.623 | C23H32O18 | 595.1502 | [M − H]− | Glucuronide conjugation | 421.1166[M − H–GlcUA] | I-M | ✓ | ✓ | ||
| M23 | 5.854 | C22H31NO15 | 548.1656 | [M − H]− | Glutathione conjugation | 420.2198[M − H–GSH] | I-M | ✓ | |||
| M24 | 6.970 | C23H34O18 | 597.1666 | [M − H]− | Glucuronide conjugation | 421.1990[M − H–GlcUA] | I-M | ✓ | |||
| M25 | 7.002 | C23H32O16 | 563.1640 | [M − H]− | Glucuronide conjugation | 387.0956[M − H–GlcUA] | I-M | ✓ | |||
| 211.0351[M − H–GlcUA–GlcUA] | |||||||||||
| M26 | 7.510 | C25H36O18 | 623.1257 | [M − H]− | Glucuronide conjugation | 487.2290[M − H–GlcUA] | I-M | ✓ | |||
| M27 | 9.225 | C22H31NO12S | 532.1684 | [M − H]− | Hydroxylation | 442.9396[M − H + H2O–Tau] | I-M | ✓ | |||
| M28 | 1.512 | C12H23NO7 | 292.1414 | [M − H]− | Glycine conjugation | 236.1141[M − H–Gly] | G-M | ✓ | ✓ | ||
| M29 | 2.390 | C16H25NO10S | 424.1996 | [M + H]+ | Methylation | 409.1213[M + H–CH3] | G-M | ✓ | |||
| M30 | 3.600 | C10H20O9S | 315.0734 | [M + H]+ | Sulfation conjugation | 237.1216[M + H–SO3] | G-M | ✓ | ✓ | ||
| M31 | 3.920 | C16H28O10S | 411.1343 | [M − H]− | Sulfation conjugation | 331.3911[M − H–SO3] | G-M | ✓ | |||
| Glucuronide conjugation | 235.1557[M − H–GlcUA] | ||||||||||
| M32 | 5.847 | C22H36O13 | 507.209 | [M − H]− | Glucuronide conjugation | 331.1453[M − H–GlcUA] | G-M | ✓ | |||
| M33 | 3.860 | C21H18O11 | 447.0949 | [M + H]+ | Glucuronide conjugation | 270.8024[M + H–GlcUA] | F-M | ✓ | ✓ | ||
| M34 | 4.760 | C28H29NO15 | 620.1631 | [M + H]+ | Glutathione conjugation | 489.1439[M + H–GSH] | F-M | ✓ | |||
| M35 | 5.878 | C22H30O13 | 501.094 | [M − H]− | Decarbonation | 457.1026[M − H–CO2] | F-M | ✓ | ✓ | ||
| Glucuronide conjugation | 325.1548[M − H–GlcUA] | ||||||||||
| M36 | 6.566 | C26H27NO13 | 560.1423 | [M − H]− | Glutathione hydroxylation | 432.6875[M − H–GSH] | F-M | ✓ | |||
| M37 | 7.579 | C26H28O18S | 659.0925 | [M − H]− | Sulfation conjugation | 579.2313[M − H–SO3] | F-M | ✓ | ✓ | ||
| M38 | 9.320 | C32H36O21 | 755.1686 | [M − H]− | Glucuronide conjugation | 579.2633[M − H–GlcUA] | F-M | ✓ | |||
| M39 | 9.350 | C27H28O17 | 623.1257 | [M − H]− | Hydroxylation | 462.1888[M − H–Glc] | F-M | ✓ | ✓ | ✓ | |
| M40 | 10.510 | C21H20O14S | 527.0503 | [M − H]− | Sulfation conjugation | 447.2047[M − H–SO3] | F-M | ✓ | ✓ | ✓ | |
| M41 | 12.220 | C28H36O19S | 707.1523 | [M − H]− | Sulfation conjugation | 627.2069[M − H–SO3] | F-M | ✓ | |||
| M42 | 13.044 | C23H25NO12S | 584.107 | [M + HCOO]− | Taurine conjugation | 431.4099[M + HCOO–Tau] | F-M | ✓ | ✓ | ✓ | |
| M43 | 14.970 | C21H18O12 | 463.0874 | [M + H]+ | Glucuronide conjugation | 287.1385[M + H–GlcUA] | F-M | ✓ | ✓ | ||
| M44 | 15.423 | C15H10O8S | 349.0033 | [M − H]− | Sulfation conjugation | 269.0487[M − H–SO3] | F-M | ✓ | |||
| M45 | 9.248 | C29H46O7S | 537.2894 | [M − H]− | Sulfation conjugation | 457.3324[M − H–SO3] | N-M | ✓ | ✓ | ||
| M46 | 26.355 | C35H54O10 | 633.3654 | [M − H]− | Glucuronide conjugation | 456.4401[M − H–GlcUA] | N-M | ✓ | ✓ | ||
| M47 | 28.635 | C31H51NO6S | 564.3319 | [M − H]− | Taurine conjugation | 504.3043[M − H–C2H4N–O] | N-M | ✓ | |||
A total of seven peaks detected in rat urine were identified or tentatively characterized as phenylethanoid glycosides-related metabolites (M1–M7). Among them, two and five were detected in plasma and feces, respectively. M5 and M6 were assigned as glucuronide conjugates owing to the presence of characteristic neutral loss of 176 Da and corresponding [M − H]− ions in MS/MS spectra. Based on the similar rule, M3 and M4 were identified as sulfate conjugates (adding 80 Da), M1 and M7 were identified as glutathione (adding 129 Da) and taurine (adding 107 Da) conjugates, respectively. Details were presented in Table 3.
| Compound | Spiked (ng mL−1) | Matrix effect (%) | Extraction recovery (%) | Intra-day (n = 6) (%) | Inter-day (n = 6) (%) | Stability (REa, %) | ||||||
|---|---|---|---|---|---|---|---|---|---|---|---|---|
| Mean | RSD | Mean | RSD | RE | precision | RE | precision | Three freeze–thaw | Short-term | Long-term | ||
| a RE is expressed as (measured concentration/spiked concentration − 1) × 100%. | ||||||||||||
| Acetylshanzhiside methyl ester | 9.00 | 92.8 | 7.6 | 95.9 | 8.6 | 7.0 | 7.9 | 4.5 | 10.3 | 1.9 | 9.7 | 9.0 |
| 18.00 | 90.1 | 6.3 | 80.5 | 3.0 | −5.4 | 3.8 | −1.1 | 7.2 | −2.4 | 7.8 | 4.9 | |
| 90.0 | 85.9 | 1.2 | 67.0 | 1.8 | 3.0 | 3.8 | 9.4 | 6.0 | 2.8 | 5.5 | 2.4 | |
| 8-O-Acetylshanzhiside methyl ester | 9.00 | 90.3 | 17.9 | 90.9 | 16.5 | 21.2 | 14.7 | 13.6 | 16.2 | −18.8 | 0.7 | −18.0 |
| 18.00 | 94.1 | 9.1 | 84.2 | 7.3 | 0.0 | 10.4 | −1.1 | 10.0 | 9.5 | −0.3 | 8.7 | |
| 90.00 | 91.3 | 6.8 | 68.8 | 3.4 | 2.1 | 5.3 | 7.2 | 6.8 | 14.1 | 4.1 | 0.7 | |
| Lamalbid | 2.25 | 89.0 | 9.3 | 97.4 | 7.5 | 7.4 | 8.4 | 1.6 | 13.7 | −4.1 | −1.7 | −8.0 |
| 4.50 | 96.7 | 5.7 | 77.1 | 8.8 | −1.0 | 10.7 | 1.3 | 11.0 | 5.3 | −4.4 | −1.4 | |
| 22.50 | 86.9 | 2.9 | 69.0 | 1.5 | 0.4 | 2.9 | 8.2 | 6.9 | 6.5 | 4.6 | 8.2 | |
| Verbascoside | 4.50 | 84.3 | 9.1 | 58.2 | 12.3 | −5.5 | 9.9 | −10.9 | 14.7 | −11.3 | 8.1 | 7.3 |
| 9.00 | 92.1 | 1.8 | 81.3 | 6.2 | −2.2 | 6.0 | −17.8 | 14.8 | −5.0 | −10.5 | −11.4 | |
| 45.00 | 84.3 | 1.4 | 60.8 | 1.5 | −1.5 | 4.2 | 10.5 | 9.3 | 3.7 | 1.8 | −2.5 | |
| Forsythoside B | 8.00 | 82.4 | 8.0 | 62.5 | 11.8 | 0.8 | 9.6 | −4.5 | 15.5 | −8.8 | 5.7 | 1.8 |
| 16.00 | 94.2 | 3.4 | 73.4 | 3.8 | 0.3 | 3.4 | −13.1 | 12.4 | 0.9 | −4.1 | −9.4 | |
| 90.00 | 80.9 | 3.1 | 59.8 | 3.0 | −4.0 | 4.8 | 9.5 | 10.1 | 1.6 | 2.0 | −3.7 | |
| Luteolin-7-O-β-D-glucopyranoside | 1.00 | 84.8 | 7.9 | 85.2 | 5.8 | 7.8 | 5.6 | −3.8 | 13.3 | −5.3 | 6.3 | −2.7 |
| 2.00 | 97.0 | 5.4 | 81.8 | 9.2 | −6.4 | 9.4 | −7.9 | 8.5 | 9.3 | −1.0 | 1.6 | |
| 10.00 | 91.0 | 2.0 | 68.3 | 3.1 | −3.8 | 3.5 | −0.7 | 3.7 | 8.9 | 4.2 | 4.4 | |
Among 20 iridoids metabolites (M8–M27), most of them (18 compounds) could be were detected in urine, four were detected in plasma, nine were detected in feces and two were detected in bile. Peaks M9, M15, M17, M19, M20, M22 and M24–M26 were assigned as glucuronide conjugates due to the diagnostic neutral loss of 176 Da. Peaks M8, M10–M14, M16 and M21 were sulfate conjugates as their [M − H]− ions could further eliminate SO3 unit (80 Da). Peak M23 was found as glutathione conjugation.
Although amino acid conjugation reactions were less frequently for drug detoxification, products glycine (adding 57 Da) conjugation was found as M28 for glucide metabolites. The other four glucide metabolites in rat urine were tentatively characterized as sulfate (M30 and M31) and glucuronide (M32) conjugates, and methylation product (M29). Similarly, 12 flavonoids metabolites were detected in rat plasma (six peaks), urine (nine peaks), feces (four peaks) and bile (three peak), including four glucuronide conjugates (M33, M35, M38 and M43), four sulfate conjugates (M37, M40, M41 and M44), two glutathione conjugates (M34 and M36), and one taurine conjugate (M42). It was in good agreement with the previous report that phase II metabolism was considered as the major detoxification pathway and glucuronidation and sulfation were the major metabolites of flavonoid glycosides.25–27 Notohamosin B, the only nortriterpenoid found in the L. rotata, was found metabolized into three varieties compounds: sulfate (M45), glucuronide (M46), and taurine (M47) conjugates.
In general, metabolic profiling showed that iridoids, phenylethanoid glycosides, and flavonoids from L. rotata were detected in larger numbers of metabolites than in prototype in rat biological samples after its oral administration. Most of them underwent phase II metabolism to produce conjugates with endogenous compounds by conjugation enzymes, and more than one detoxified reactions. It mainly attributed to the multi-hydroxyl groups in the chemical structures of these compounds, which made the above endogenous water-soluble molecules easy to be attached. Moreover, for one prototype compound, the sequence of metabolite polarities was proposed as: sulfate > glucuronide > taurine conjugates. Although products of liver detoxification often lead the xenobiotics to be secreted into the intestines in bile, but sometime the metabolites could be transported into the blood, processed by kidney and excreted in urine. Therefore, among 47 metabolites, most (41 compounds) could be detected in urine, 16 were from plasma, and 20 were from feces (ESI, Fig. S1†). There is little trace for drug in the TIC of bile (only six), might owing to the limited collection time (15 min) in our experiment comparing with that in other researches (about 12 h).28–33 Furthermore, a 12 (object) × 59 (variable) data matrix containing the absolute peak areas was submitted to partial least squares (PLS) and the principal components (PCs) were calculated. Object 12 represented 12 rats administrated in A1 and B1 groups, and variable 59 meant that 59 common peaks were found as the “absorbed and produced” compounds in rat plasma for each rat. Then, peak areas and retention times of 59 variables for 12 rats were used as input data, and the PLS displayed scattered spots from A1 (red inverted triangle) and B1 (black triangle) groups (ESI, Fig. S2†). Results did not show clear classification for the drug-containing plasma between two groups. Furthermore, the in vivo metabolites profiles from two groups were also compared by the same method, and the PLS result showed that in vivo metabolites spots also scattered for two groups (ESI, Fig. S3†).
Quantitative analysis
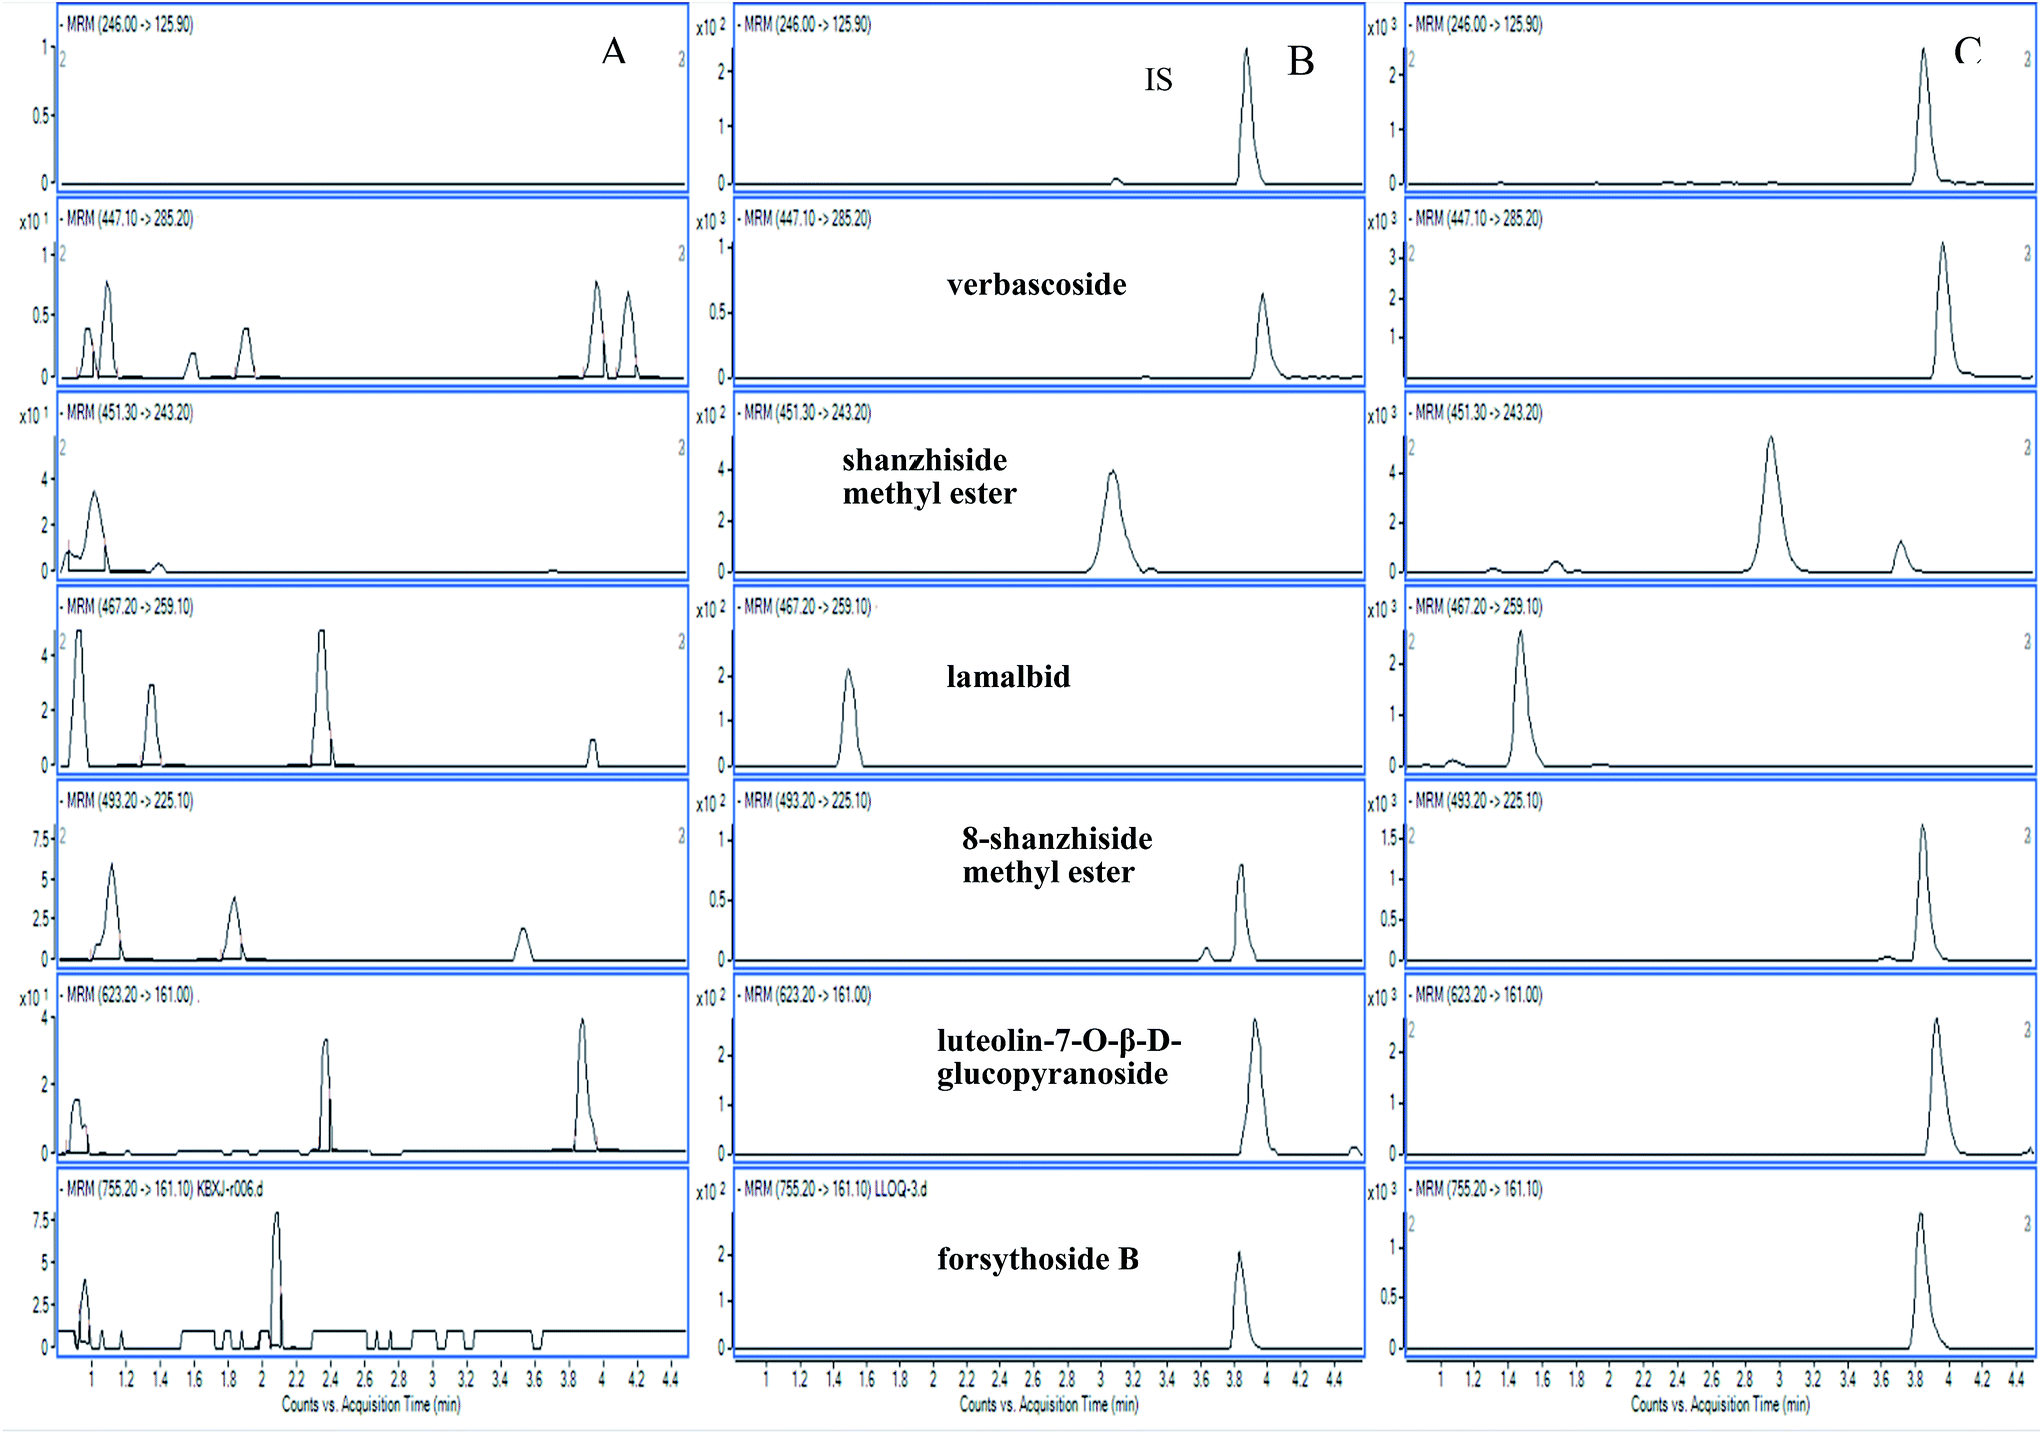 | ||
| Fig. 2 Representative MRM chromatograms of six analytes in different conditions. (A) Blank plasma; (B) blank plasma spiked with the analytes at LOQ; (C) 0.5 h rat plasma after oral administration of whole plant of L. rotata. | ||
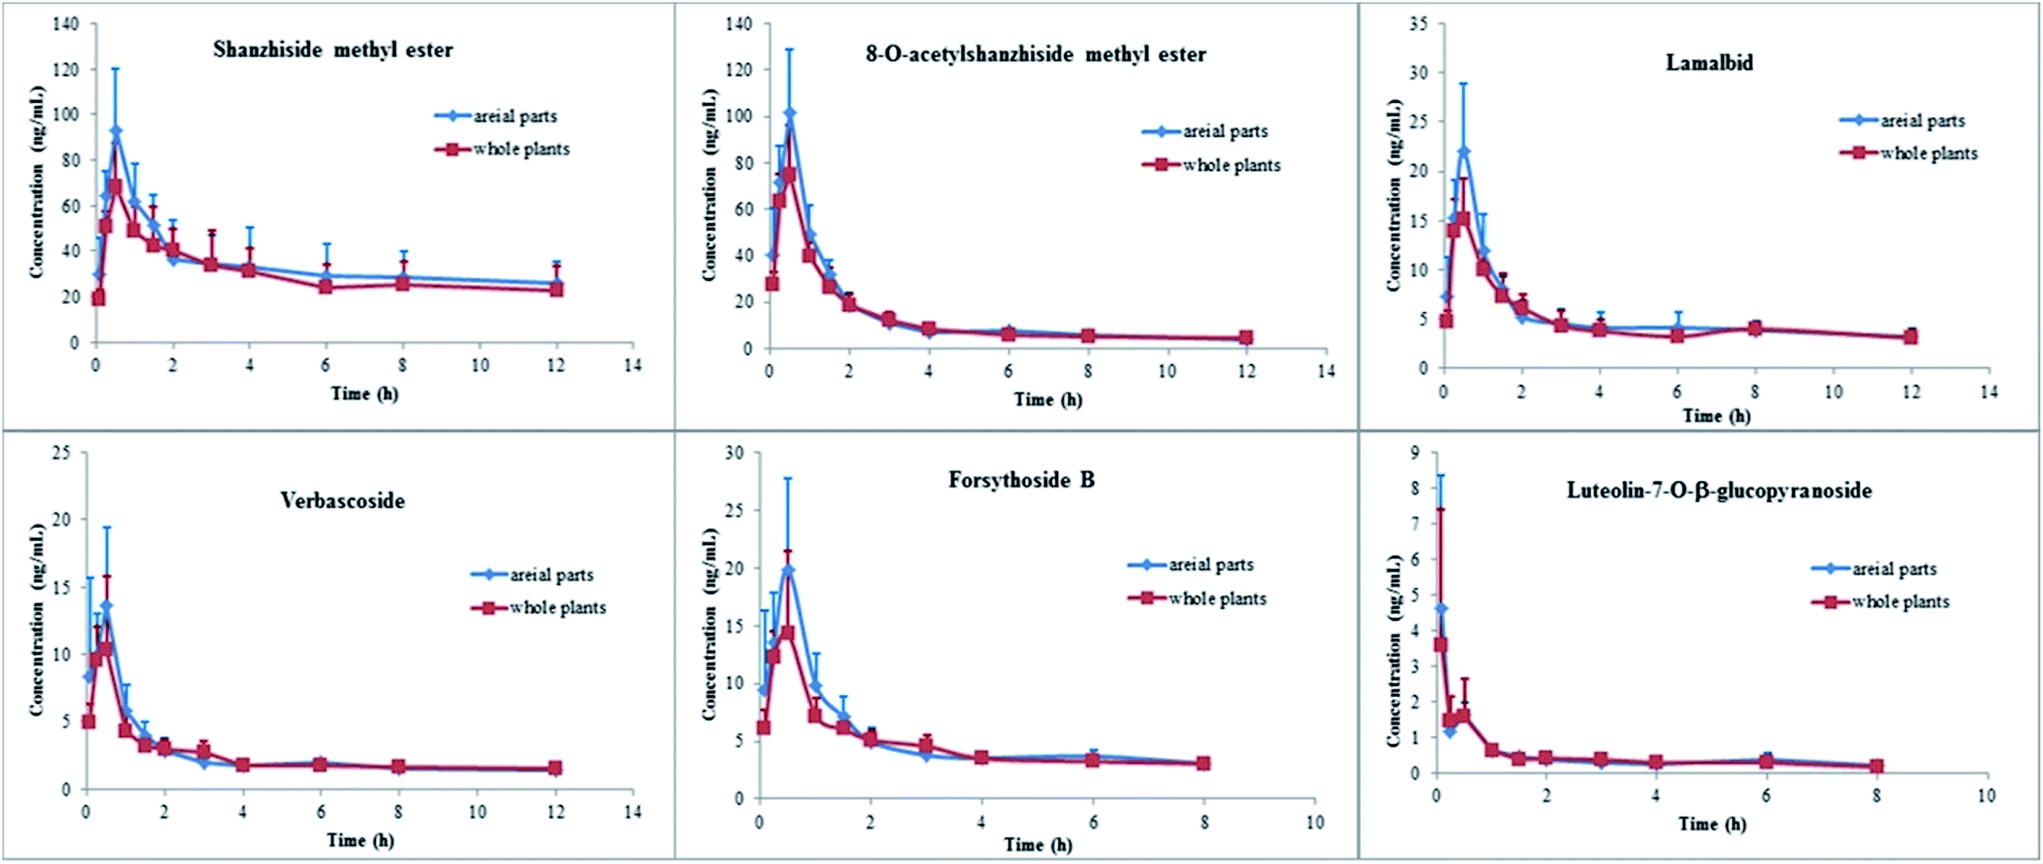 | ||
| Fig. 3 Mean plasma concentration–time profile of six analytes in six rats after oral administration of the aerial parts and whole plant of L. rotata. | ||
| Compound | Group | Parameters (n = 6) | |||||
|---|---|---|---|---|---|---|---|
| t1/2 (h) | Tmax (h) | Cmax (ng mL−1) | AUC0–t (ng h mL−1) | AUC0–∝ (ng h mL−1) | MRT0–t (h) | ||
| a Means P < 0.05. | |||||||
| Shanzhiside methyl ester | Aerial parts | 18.00 ± 13.43 | 0.67 ± 0.04 | 94.59 ± 25.02 | 416.62 ± 126.09 | 980.02 ± 616.18 | 4.99 ± 0.71 |
| Whole plant | 37.24 ± 22.50 | 0.50 ± 0.00 | 68.44 ± 19.40 | 363.70 ± 100.95 | 1837.29 ± 1407.71 | 4.98 ± 0.81 | |
| 8-O-Acetylshanzhiside methyl ester | Aerial parts | 8.20 ± 8.02 | 0.50 ± 0.00 | 101.39 ± 27.81 | 172.94 ± 30.48 | 226.08 ± 87.69 | 2.87 ± 0.44 |
| Whole plant | 8.42 ± 8.32 | 0.45 ± 0.10 | 75.32 ± 20.76 | 151.75 ± 22.20 | 195.02 ± 47.84 | 3.09 ± 0.28 | |
| Lamalbid | Aerial parts | 22.32 ± 17.38 | 0.50 ± 0.00a | 22.05 ± 6.86 | 63.07 ± 8.30 | 157.38 ± 124.51 | 4.47 ± 0.63 |
| Whole plant | 21.22 ± 12.92 | 0.33 ± 0.13a | 15.45 ± 4.04 | 56.70 ± 7.73 | 127.92 ± 62.12 | 4.71 ± 0.49 | |
| Verbascoside | Aerial parts | 34.96 ± 28.68 | 0.39 ± 0.18 | 15.72 ± 4.38 | 31.33 ± 4.59 | 104.36 ± 62.06 | 4.07 ± 0.54 |
| Whole plant | 126.14 ± 267.78 | 0.38 ± 0.14 | 11.68 ± 4.82 | 29.14 ± 3.33 | 289.91 ± 551.88 | 4.35 ± 0.33 | |
| Forsythoside B | Aerial parts | 24.24 ± 33.97 | 0.46 ± 0.10 | 21.03 ± 5.67 | 43.25 ± 6.51 | 148.79 ± 167.14 | 2.91 ± 0.37 |
| Whole plant | 18.04 ± 15.71 | 0.38 ± 0.14 | 15.51 ± 6.42 | 38.49 ± 3.75 | 115.16 ± 68.42 | 3.06 ± 0.25 | |
| Luteolin-7-O-β-D-glucopyranoside | Aerial parts | 5.91 ± 1.90 | 0.15 ± 0.17 | 4.72 ± 3.66 | 3.86 ± 0.72 | 5.20 ± 1.45 | 2.63 ± 0.51 |
| Whole plant | 4.36 ± 1.34 | 0.21 ± 0.17 | 3.83 ± 3.74 | 3.70 ± 0.73 | 4.79 ± 1.13 | 2.59 ± 0.53 | |
Conclusions
This paper developed qualitative and quantitative analyses of bioactive compounds of L. rotata in vivo. Results clearly indicated that 39 of 48 prototype components in five classes in the extract could be metabolized to generate 47 metabolites, including sulfate, glucuronide, taurine, glycine, and glutathione conjugates. Iridoids, flavonoids, phenylethanoid glycosides were major absorbed chemical components of L. rotata. Additionally, the urine samples contained the most abundant metabolites, feces secondly, plasma thirdly and bile finally. Besides, there was no significant difference in metabolites profile between drug-containing rat plasma samples after oral administration of the aerial parts and the whole plant of L. rotata. The further comparative pharmacokinetic study between two groups also verified the metabolites profiles similarity. This investigation provided helpful information to confirm the L. rotata medicine parts alteration in Chinese Pharmacopoeia.Acknowledgements
This work were supported by the National Natural Science Foundation of China (81202866 and 81325024) and National Significant Projects of New Drugs Creation (2011ZX09302). The authors greatly appreciate the kind help of Chang Shu and Zhipeng Wang, from Department of Pharmacy, Changzheng Hospital, Second Military Medical University.Notes and references
- Chinese Pharmacopoeia Commission, Pharmacopoeia of the People's Republic of China, The First Division of 2010 Edition, Chemical and Technologic Press, Beijing, 2010, pp. 245–246 Search PubMed.
- Chinese Pharmacopoeia Commission, Pharmacopoeia of the People's Republic of China, The First Division of 2015 Edition, Chemical and Technologic Press, Beijing, 2015, p. 262 Search PubMed.
- State Administration of Traditional Chinese Medicine, China Herb, Science and Technology Press, Shanghai, 2000, pp. 6074–6075 Search PubMed.
- F. Zhang, Z. J. Wu, L. N. Sun, J. Wang, X. Tao and W. S. Chen, Bioorg. Med. Chem. Lett., 2012, 2, 4447–4452 CrossRef PubMed.
- F. Zhang, L. N. Sun and W. S. Chen, Chem. Nat. Compd., 2009, 45, 360–362 CrossRef CAS.
- M. X. Lia, X. F. Shang, R. X. Zhang, Z. P. Jia, P. C. Fan, Q. Ying and L. L. Wei, Fitoterapia, 2010, 81, 167–172 CrossRef PubMed.
- W. L. Jiang, F. H. Fu, S. G. Zheng, D. L. Zhang, H. B. Zhu and J. Hou, Eur. J. Pharmacol., 2010, 629, 20–24 CrossRef CAS PubMed.
- W. L. Jiang, F. H. Fu, B. M. Xu, J. W. Tian, H. B. Zhu and J. Hou, Phytomedicine, 2010, 17, 635–639 CrossRef CAS PubMed.
- B. Zhu, N. Gong, H. Fan, C. S. Peng, X. J. Ding, Y. Jiang and Y. X. Wang, Anesthesiology, 2014, 121, 835–851 CrossRef CAS PubMed.
- M. P. La, F. Zhang, S. H. Gao, X. W. Liu, Z. J. Wu, L. N. Sun, X. Tao and W. S. Chen, J. Pharm. Biomed. Anal., 2015, 102, 366–376 CrossRef CAS PubMed.
- S. Bent, J. Gen. Intern. Med., 2008, 23, 854–859 CrossRef PubMed.
- P. C. Fan, M. X. Li, H. P. Ma, L. L. Jing, J. G. Qiu and Z. P. Jia, Biomed. Chromatogr., 2012, 26, 1543–1551 CrossRef CAS PubMed.
- M. Homma, K. Oka, C. Taniguchi, T. Niitsuma and T. Hayashi, Biomed. Chromatogr., 1997, 11, 125–131 CrossRef CAS PubMed.
- C. Xiang, X. Qiao, Q. Wang, R. Li, W. J. Miao, D. A. Guo and M. Ye, Drug Metab. Dispos., 2011, 39, 1597–1608 CrossRef CAS PubMed.
- T. Yi, L. Zhu, Y. N. Tang, J. Y. Zhang, Z. T. Liang, J. Xu, Z. Z. Zhao, Z. L. Yu, Z. X. Bian, Z. J. Yang and H. B. Chen, J. Ethnopharmacol., 2014, 153, 701–713 CrossRef CAS PubMed.
- P. Jiang, Q. Wang, Y. Q. Jia, R. Shi, Y. M. Ma, P. Liu, C. H. Liu, F. Y. Ye and N. N. Cheng, RSC Adv., 2015, 5, 21786–21796 RSC.
- Chinese Pharmacopoeia Commission, Pharmacopoeia of the People's Republic of China, The first division of 2005 edition, Chemical and Technologic Press, Beijing, 2005, pp. 184–185 Search PubMed.
- Food and Drug administration, Guidance for Industry: Bioanalytical Method Validation, 2013 Search PubMed.
- S. M. Ni, D. W. Qian, J. A. Duan, J. M. Guo, E. X. Shang, Y. Shu and C. F. Xue, J. Chromatogr. B: Anal. Technol. Biomed. Life Sci., 2010, 878, 2741–2750 CrossRef CAS PubMed.
- F. Zhang, Q. Zhan, S. H. Gao, X. Dong, B. Jiang, L. N. Sun, X. Tao and W. S. Chen, J. Ethnopharmacol., 2014, 152, 497–507 CrossRef CAS PubMed.
- C. Y. Li, L. W. Qi, P. Li, X. D. Wen, Y. F. Zhu, E. H. Liu, Z. Gong, X. L. Yang, M. T. Ren, Y. J. Li and X. X. Ge, Rapid Commun. Mass Spectrom., 2009, 23, 1977–1988 CrossRef CAS PubMed.
- X. W. Liu, F. Zhang, S. H. Gao, B. Jiang and W. S. Chen, Chin. J. Nat. Med., 2015, 13, 145–160 Search PubMed.
- X. M. Cai, L. J. Zou, J. Dong, L. L. Zhao, Y. Y. Wang, Q. Xu, X. Y. Xue, X. L. Zhang and X. M. Liang, Anal. Chim. Acta, 2009, 650, 10–15 CrossRef CAS PubMed.
- M. Holcapek, L. Kolárová and M. Nobilis, Anal. Bioanal. Chem., 2008, 391, 59–78 CrossRef CAS PubMed.
- V. Crespy, C. Morand, C. Besson, C. Manach, C. Demigne and C. Remesy, J. Agric. Food Chem., 2002, 50, 618–621 CrossRef CAS PubMed.
- W. Mullen, A. Boitier, A. J. Stewart and A. Crozier, J. Chromatogr. A, 2004, 1058, 163–168 CrossRef CAS PubMed.
- Z. X. Yan, Y. Chen, T. X. Li, J. Zhang and X. H. Yang, J. Chromatogr. B: Anal. Technol. Biomed. Life Sci., 2012, 885–886, 73–82 CrossRef CAS PubMed.
- L. Y. Du, D. W. Qian, E. X. Shang, P. Liu, S. Jiang, J. M. Guo, S. L. Su, J. A. Duan, J. Xu and M. Zhao, J. Ethnopharmacol., 2015, 169, 156–162 CrossRef CAS PubMed.
- Z. W. Chen, L. Tong, S. M. Li, D. X. Li, Y. Zhang, S. P. Zhou, Y. H. Zhu and H. Sun, J. Pharm. Anal., 2014, 4, 14–25 CrossRef CAS.
- X. Qiao, J. Han, M. Xu, Z. C. Zhang, M. Ye, G. Ye and D. A. Guo, J. Pharm. Biomed. Anal., 2011, 54, 789–798 CrossRef CAS PubMed.
- S. P. Li, W. Liu, L. Teng, X. M. Cheng, Z. T. Wang and C. H. Wang, J. Pharm. Biomed. Anal., 2014, 92, 53–62 CrossRef CAS PubMed.
- J. L. Geng, Y. Dai, Z. H. Yao, Z. F. Qin, X. L. Wang, L. Qin and X. S. Yao, J. Pharm. Biomed. Anal., 2014, 96, 90–103 CrossRef CAS PubMed.
- L. Y. Du, D. W. Qian, E. X. Shang, P. Liu, S. Jiang, J. M. Guo, S. L. Su, J. A. Duan, J. Xu and M. Zhao, J. Ethnopharmacol., 2015, 169, 156–162 CrossRef CAS PubMed.
Footnotes |
| † Electronic supplementary information (ESI) available: Fig. S1 and S2 and Tables S1 and S2. See DOI: 10.1039/c5ra25264d |
| ‡ M. P. La contributed equally to this study. |
| This journal is © The Royal Society of Chemistry 2016 |