 Open Access Article
Creative Commons Attribution 3.0 Unported Licence
Benzoic hydroxamate-based iron complexes as model compounds for humic substances: synthesis, characterization and algal growth experiments†
Ewelina
Orlowska
a,
Alexander
Roller
a,
Hubert
Wiesinger
a,
Marc
Pignitter
b,
Franz
Jirsa
ac,
Regina
Krachler
a,
Wolfgang
Kandioller
*a and
Bernhard K.
Keppler
a
aInstitute of Inorganic Chemistry, Faculty of Chemistry, University of Vienna, Waehringer Str. 42, A-1090 Vienna, Austria. E-mail: wolfgang.kandioller@univie.ac.at
bDepartment of Nutritional and Physiological Chemistry, Faculty of Chemistry University of Vienna, Althanstr. 14/UZA II, A-1090 Vienna, Austria
cDepartment of Zoology, University of Johannesburg, Auckland Park, 2006 South Africa
First published on 22nd April 2016
Abstract
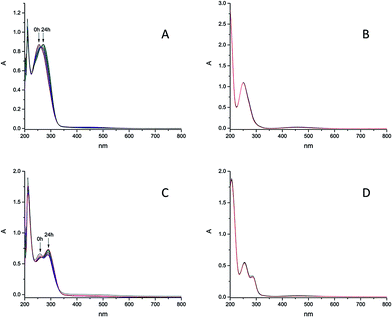
A series of monomeric and dimeric FeIII complexes bearing benzoic hydroxamates as O,O-chelates has been prepared and characterized by elemental analysis, IR spectroscopy, UV-Vis spectroscopy, electrospray ionization mass spectrometry (ESI-MS), cyclic voltammetry, EPR spectroscopy and for some examples by X-ray diffraction analysis. The stability of the synthesized complexes in pure water and seawater was monitored over 24 h by means of UV-Vis spectrometry. The ability to release iron from the synthesized model complexes has been investigated with algae growth experiments.
Introduction
Iron has been recognized as an essential trace element for all living organisms, ranging from archaea to mammals and is required for the function of many proteins and enzymes. Also photosynthesis as well as nitrogen assimilation is dependent on iron-based enzyme cofactors.1–3 More than 50% of the photosynthetic activity on earth is attributed to phytoplankton, which consists of photoautotrophic microscopic organisms.3–5 They are responsible for a major part of the global biosynthesis of organic compounds from inorganic carbon dioxide dissolved in water and therefore play a key role in the global CO2 cycle. Although iron is a common element on earth, large areas of the ocean show very low iron concentrations.6–8 In so called high-nutrient, low-chlorophyll (HNLC) areas nutrients like nitrate and phosphate are present in high concentrations; however, chlorophyll concentrations, as indicator for phytoplankton density are low.9,10 Evidences have shown that insufficient concentrations of iron in these areas are responsible for the inhibition of growth, development and productivity of marine phytoplankton.11–13 The presence of bioavailable iron in seawater is crucial for a high productivity of phytoplankton.14–20 The observed low iron concentrations can be explained by the chemical speciation of iron in seawater. Thermodynamically stable iron(III) precipitates in oxygenated seawater at pH 8 as ferric hydroxide aggregates.21 In fact, 99.97% of dissolved iron in seawater exists as complexes with organic chelators.22–25 However, the bioavailability of iron does not solely depend on its solubility moreover other parameters such as complex hydrolysis and photo- or bioreductions are essential.26 The accumulated complexed Fe(III) can be reduced by bioreductants or more importantly photochemical reactions. The formed Fe(II) dissociates and is prone to oxidation reactions with O2 or H2O2 (Fenton reaction). This reaction cycle increases the steady-state concentration of dissolved bioavailable iron.27Until now it was believed that the main sources of iron in the ocean are atmospheric deposition of volcanic dust, terrestrial sand and extraterrestrial dust, the upwelling of iron rich waters as well as hydrothermal vents and ice melting;26,28 however, the role of river water has been mainly neglected. Upon mixing of river water with seawater in the brackish water zone of estuaries the majority of the transported iron gets sequestered into the sediment due to the major change in ionic strength.29–34 Recent investigations in the Mississippi Delta and North Scotland have shown that a significant proportion of iron(III) complexes of aquatic humic substances (AHS) in the river remain in colloidal solution in sea water and can contribute to iron-fertilization of coastal waters.35–37 AHS, resistant against salt-induced flocculation, have been found in the entire Atlantic, Arctic and Pacific oceans. The identification of AHS as important carriers for iron explains the increased bioavailability of iron in natural seawater compared to artificial one.38,39 AHS have been under investigation for a very long time, and their composition has not been clarified in detail. The complex structure of this substance class origins from the incomplete decomposition of organic material, such as lignins which undergo chemical, physical and microbiological transformations.40,41 Furthermore other organic molecules like amino acids, sugars and peptides can be incorporated leading to a broad range of different structural features.42,43 Unfortunately, the very low concentration of those natural iron chelators in seawater makes the detection and characterization of them challenging.44 Being aware of the importance of those natural macromolecules for marine microorganisms it is of large interest to find synthetic compounds that are comparable to AHS, regarding their iron binding and transport properties in sea water, as well as their capability of providing bioavailable iron to algae. Comparing the latest EXAFS studies45 and the current information about AHS we put further requirements for the model compounds together. Overall they include mononuclear Fe(III) complexes, mainly O,O coordination, functional groups such as phenols and aromatic carboxylic groups and good water solubility. Iron shows very strong interaction with AHS even at low pH values, which is similar to iron complexes bearing hydroxamic acid derivatives.46 Thus ligands with hydroxamate functional groups seemed to be suitable models for humic substances as proposed by Frimmel et al.47,48 The strong chelating properties of hydroxamates are exploited by many microorganisms like bacteria which produce and release low molecular siderophores to bind and transport iron. Significant nitrogen content49–51 and possible presence of nitrogen in the first and second coordination sphere of iron in AHS supports our decision to use them as models.
Herein we report the synthesis of benzhydroxamic acids and their respective iron(III) coordination compounds. The synthesized complexes were investigated and characterized by standard analytical methods such as elemental analysis, UV-Vis, IR, EPR, cyclic voltammetry, mass spectrometry and X-ray diffraction. Moreover, the stability of the iron complexes in (sea)water was investigated. Algal growth experiments were performed with the marine single-cell chlorophyte Chlorella salina and haptophyte Diacronema lutheri to elucidate the potential of these iron complexes to act as model compounds for humic substances in regards of their biological function in sea water environment.
Experimental
Materials and methods
All chemicals were purchased from Sigma Aldrich (salicylic acid, 4-hydroxybenzoic acid, 3,4,5-trimethoxy benzoic acid, 3,4-dihydroxyhydrocaffeic acid, o-coumaric acid, iron(III) chloride hexahydrate, potassium hydroxide, hydroxylamine hydrochloride, palladium on carbon 10 wt% loading), Alfa (2,4-dihydroxybenzoic acid, 2,3-dihydroxybenzoic acid, 3,5-dihydroxybenzoic acid), Fluka (N-methylmorpholine, ethyl chloroformate, 3-hydroxybenzoic acid), Riedl de Haen (iron(III) chloride anhydrous) or Acros (vanilic acid, cinnamic acid, syringic acid, benzyl bromide, sodium bicarbonate) and used without further purification. All solvents were of analytical grade and used without further purification. If not otherwise stated the substances were synthesized and purified according to the general procedure. 1H NMR spectra were recorded on a Bruker Avance III™ 500 MHz spectrometer in DMSO-d6 at 298 K using standard pulse programs at 500.10 MHz for 1H experiments. UV-vis experiments were performed on an Agilent 8453 spectrophotometer and Perkin Elmer lambda 35 with PTP 6 (Peltier Temperature Programmer) and Julabo AWC 100 recirculating cooler in the range of 200–800 nm in both distilled water and seawater at 25 °C. Electrospray ionization mass spectra were measured with a Bruker maXis ESI-QqTOF spectrometer in the positive and negative mode using ACN/MeOH 1% H2O as solvent. Elemental analyses were performed at the Microanalytical Laboratory of the University of Vienna with a Perkin-Elmer 2400 CHN Series II elemental analyzer or a Eurovector EA3000 elemental analyzer and are within 0.4% of the calculated values. ATR-IR spectra were measured using a Bruker Vertex 70 Fourier transform IR spectrometer. Cyclic voltammograms were measured in a three-electrode cell using a 2.0 mm- and 3.0 mm-diameter glassy carbon working electrode, a platinum auxiliary electrode, and an Ag|Ag+ reference electrode containing 0.1 M AgNO3. Measurements were performed at room temperature using an EG & G PARC 273A potentiostat/galvanostat. Deaeration of solutions was accomplished by passing a stream of argon through the solution for 5 min prior to the measurement and then maintaining a blanket atmosphere of argon over the solution during the measurement. The potentials were measured in DMF containing 0.10 M [n-Bu4N][BF4], using [Fe(η5-C5H5)2] (E1/2 = +0.6–0.68 V vs. NHE) as internal standard and are quoted relative to the normal hydrogen electrode NHE.52 Electron paramagnetic resonance (EPR) spectra were acquired on a Bruker Elexsys-II E500 CW-EPR spectrometer operating at X-band with 100 kHz modulation frequency. All samples were dissolved in DMF and transferred to a 3 mm inner diameter quartz EPR tube, which was placed into a high-sensitivity cavity (SHQE1119). The spectra of all samples and the solvent alone were recorded at 90 ± 1 K with a variable nitrogen temperature control system using the following settings: center field: 6000 G; sweep width: 12![[thin space (1/6-em)]](https://www.rsc.org/images/entities/char_2009.gif) 000 G; sweep time: 335.5 s; modulation amplitude: 20.37 G; microwave power: 15 mW; conversion time: 81.92 ms; resolution: 4096 points; averaged scans: 3. The rhombic symmetry of the S = 5/2 spin system was determined by the experimentally observed effective g-values using visual RHOMBO.53 X-ray diffraction measurements were performed on a D8 Venture at 100 K experimental parameters of the X-ray diffraction measurements are listed in Table S1–S13.† Distortion parameters for all diffraction measurements are listed in Table S14.† SAINT54 was used to process the data. The structures were solved by direct methods and refined by full-matrix least-squares techniques. Non-hydrogen atoms were refined with anisotropic displacement parameters. Hydrogen atoms were inserted at calculated positions and refined with a riding model or as free rotating groups. The following computer programs were used: structure solution, SHELXS-97;55 refinement, SHELXL-2013 (ref. 55) OLEX2;56 SHELXLE;57 molecular diagrams. The crystallographic data files of the complexes have been deposited at the Cambridge Crystallographic Database as CCDC 1436734 (6a), 1436733 (6b), 1436732 (6d), 1436731 (6e), 1436730 (6g), 1436729 (6j), respectively.†
000 G; sweep time: 335.5 s; modulation amplitude: 20.37 G; microwave power: 15 mW; conversion time: 81.92 ms; resolution: 4096 points; averaged scans: 3. The rhombic symmetry of the S = 5/2 spin system was determined by the experimentally observed effective g-values using visual RHOMBO.53 X-ray diffraction measurements were performed on a D8 Venture at 100 K experimental parameters of the X-ray diffraction measurements are listed in Table S1–S13.† Distortion parameters for all diffraction measurements are listed in Table S14.† SAINT54 was used to process the data. The structures were solved by direct methods and refined by full-matrix least-squares techniques. Non-hydrogen atoms were refined with anisotropic displacement parameters. Hydrogen atoms were inserted at calculated positions and refined with a riding model or as free rotating groups. The following computer programs were used: structure solution, SHELXS-97;55 refinement, SHELXL-2013 (ref. 55) OLEX2;56 SHELXLE;57 molecular diagrams. The crystallographic data files of the complexes have been deposited at the Cambridge Crystallographic Database as CCDC 1436734 (6a), 1436733 (6b), 1436732 (6d), 1436731 (6e), 1436730 (6g), 1436729 (6j), respectively.†
Algal growth experiments were carried out with batch cultures of the unicellular chlorophyte species C. salina, strain SAG 8.86 and haptophyte D. lutheri, strain SAG 926-1 obtained from the Culture Collection of Algae at Goettingen University. These algae species were chosen because of their widespread occurrence and abundance in the Northern Atlantic Ocean. Experiments were performed in modified sterile f/2 medium,58 containing EDTA as complexing agent, prepared with 35‰ salinity artificial seawater as described by Kester59 at pH 8.2. Cultures were grown in 200 mL Schott flasks kept at 21 ± 0.5 °C by means of a water bath, stirred with 300 rpm and supplied with filtered air. Plant grow-fluorescent lamps with a 16![[thin space (1/6-em)]](https://www.rsc.org/images/entities/char_2009.gif) :
:![[thin space (1/6-em)]](https://www.rsc.org/images/entities/char_2009.gif) 8 h light
8 h light![[thin space (1/6-em)]](https://www.rsc.org/images/entities/char_2009.gif) :
:![[thin space (1/6-em)]](https://www.rsc.org/images/entities/char_2009.gif) dark cycle were used to provide algae with light at mean intensities, directly measured at the flask surface, of 165 μmol m−2 s−1. All cultures were carried out in triplicates; for each approach three different control samples were prepared: full f/2 medium (+Fe, +EDTA), f/2 medium without iron (−Fe, +EDTA) and f/2 medium without EDTA (+Fe, −EDTA) (see S15†). As a negative control for our studies, we utilized iron-free samples where we used extra pure sodium chloride for the seawater preparation to avoid any iron contamination. To test benzoic hydroxamates-based iron complexes, the respective iron concentration was added in form of the respective complex into the f/2 medium and no additional EDTA was used. All the nutrient stock solutions were sterilized by passing through a 0.2 μm capsule filter (Sartorius Sartobran 300). Algae were precultured in full medium, at the beginning of the experiment an inoculum of 2–5 mL was used to obtain an initial concentration of app. 9 × 10⁴ cells per mL. In the first and second experiment on C. salina, five and three model compounds were tested respectively. The algal growth experiment on D. lutheri was carried out with six model compounds. The concentrations of tested substances were 11.7 μmol L−1. Moreover in each experiment one sample with isolated humic acid fraction and three control samples were (described above) tested. The experiments were carried out over a period of 24 to 30 days (depending on algal growth) and the algae concentration was monitored after 7 days from beginning of experiment and then every other day. The number of cells in the culture was estimated with a Neubauer improved cell counting chamber with a 0.1 mm depth and microscope. Because of the mobility of D. lutheri, in order to count the cells, 1 mL of each sample was collected and algae were fixed adding 10 μL of 10% formic acid solution. C. salina cells were counted without any treatment.
dark cycle were used to provide algae with light at mean intensities, directly measured at the flask surface, of 165 μmol m−2 s−1. All cultures were carried out in triplicates; for each approach three different control samples were prepared: full f/2 medium (+Fe, +EDTA), f/2 medium without iron (−Fe, +EDTA) and f/2 medium without EDTA (+Fe, −EDTA) (see S15†). As a negative control for our studies, we utilized iron-free samples where we used extra pure sodium chloride for the seawater preparation to avoid any iron contamination. To test benzoic hydroxamates-based iron complexes, the respective iron concentration was added in form of the respective complex into the f/2 medium and no additional EDTA was used. All the nutrient stock solutions were sterilized by passing through a 0.2 μm capsule filter (Sartorius Sartobran 300). Algae were precultured in full medium, at the beginning of the experiment an inoculum of 2–5 mL was used to obtain an initial concentration of app. 9 × 10⁴ cells per mL. In the first and second experiment on C. salina, five and three model compounds were tested respectively. The algal growth experiment on D. lutheri was carried out with six model compounds. The concentrations of tested substances were 11.7 μmol L−1. Moreover in each experiment one sample with isolated humic acid fraction and three control samples were (described above) tested. The experiments were carried out over a period of 24 to 30 days (depending on algal growth) and the algae concentration was monitored after 7 days from beginning of experiment and then every other day. The number of cells in the culture was estimated with a Neubauer improved cell counting chamber with a 0.1 mm depth and microscope. Because of the mobility of D. lutheri, in order to count the cells, 1 mL of each sample was collected and algae were fixed adding 10 μL of 10% formic acid solution. C. salina cells were counted without any treatment.
Synthesis of iron complexes
![[thin space (1/6-em)]](https://www.rsc.org/images/entities/char_2009.gif) :
:![[thin space (1/6-em)]](https://www.rsc.org/images/entities/char_2009.gif) 1 (100 mL) and left in refrigerator overnight. The suspension was filtered and diethyl ether was slowly added yielding the formation of a red precipitate. The product was filtered off and then dried in vacuo. Yield: 170 mg, 0.23 mmol, 37%. ESI-MS: m/z 731 [M + K]+, 715 [M + Na]+, 693 [M + H]+; anal. calcd for C27H30FeN3O15·0.75CHCl3: C, 42.63; H, 3.96; N, 5.37; found: C, 42.61; H, 4.22; N, 5.40. IR (ATR, selected bands, νmax): 3270, 1576, 1491, 1424, 1353, 1289, 1251, 1223, 1117, 1073, 979, 832, 776, 724, 571 cm−1.
1 (100 mL) and left in refrigerator overnight. The suspension was filtered and diethyl ether was slowly added yielding the formation of a red precipitate. The product was filtered off and then dried in vacuo. Yield: 170 mg, 0.23 mmol, 37%. ESI-MS: m/z 731 [M + K]+, 715 [M + Na]+, 693 [M + H]+; anal. calcd for C27H30FeN3O15·0.75CHCl3: C, 42.63; H, 3.96; N, 5.37; found: C, 42.61; H, 4.22; N, 5.40. IR (ATR, selected bands, νmax): 3270, 1576, 1491, 1424, 1353, 1289, 1251, 1223, 1117, 1073, 979, 832, 776, 724, 571 cm−1.
![[thin space (1/6-em)]](https://www.rsc.org/images/entities/char_2009.gif) :
:![[thin space (1/6-em)]](https://www.rsc.org/images/entities/char_2009.gif) 1 (60 mL) and left in refrigerator overnight. The suspension was filtered and diethyl ether was slowly added yielding the formation of a black precipitate. The product was filtered off and then dried in vacuo at r.t. Yield: 168 mg, 0.21 mmol, 18%. ESI-MS: m/z 667 [M + Na]+; m/z 449 [ML2 + H]+; anal. calcd for C27H30FeN3O12·0.75CHCl3·0.75MeOH: C, 45.16; H, 4.49; N, 5.54; found: C, 45.23; H, 4.78; N, 5.21. IR (ATR, selected bands, νmax): 3321, 2970, 1595, 1518, 1449, 1359, 1282, 1238, 1195, 1114, 1068, 1032, 1000, 862, 805, 717 cm−1.
1 (60 mL) and left in refrigerator overnight. The suspension was filtered and diethyl ether was slowly added yielding the formation of a black precipitate. The product was filtered off and then dried in vacuo at r.t. Yield: 168 mg, 0.21 mmol, 18%. ESI-MS: m/z 667 [M + Na]+; m/z 449 [ML2 + H]+; anal. calcd for C27H30FeN3O12·0.75CHCl3·0.75MeOH: C, 45.16; H, 4.49; N, 5.54; found: C, 45.23; H, 4.78; N, 5.21. IR (ATR, selected bands, νmax): 3321, 2970, 1595, 1518, 1449, 1359, 1282, 1238, 1195, 1114, 1068, 1032, 1000, 862, 805, 717 cm−1.
Isolation of the seawater-soluble humic acid fraction
Seawater-soluble humic acid fraction was isolated according to the previously published procedure.60 1 L filtered creek water (Craggie Burn, Scotland UK) was concentrated under reduced pressure to approximately 10 mL. 20 mL of artificial seawater were added and the solution was kept in darkness at 4 °C for 24 h. The sample was filled up to 50 mL with artificial seawater and filtrated through 0.45 μm cellulose-acetate membrane. 3 mL of the filtrate were treated with 1 mL of concentrated nitric acid to estimate the iron content with GF-AAS (6.131 mg L−1). For algal growth experiments, the applied volume of the concentrated humic acid sample contained the same iron amount as the modified sterile f/2 medium58 (1.17 × 10⁻⁵ mol L−1).Results and discussion
Synthesis – general overview
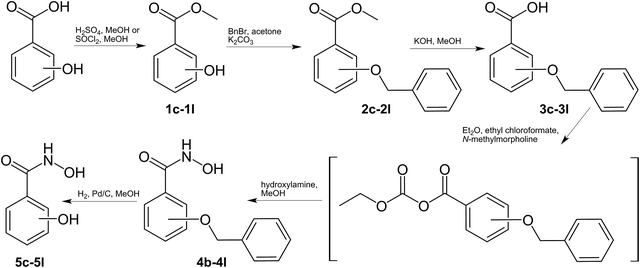
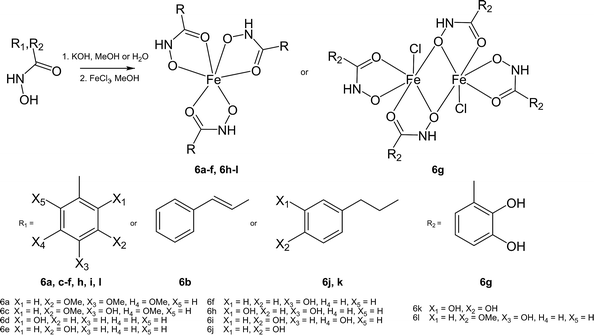
The hydroxamate ligands were synthesized starting from the respective commercially available benzoic acids, which were converted into the corresponding methyl esters 1c–1l. Methyl esters bearing free phenolic groups were protected with benzyl groups (2c–2l) to avoid undesired side reactions. In the next step the methyl esters were cleaved under alkaline conditions and converted to the corresponding hydroxamic acids in a one-step approach using ethyl chloroformate to generate intermediately the more reactive anhydrides which were treated with hydroxylamine yielding the desired hydroxamic acids (4b–4l).61 Cleavage of the benzyl groups was performed by palladium-catalyzed hydrogenation yielding the desired ligands (5c–5l) in good yields (Scheme 1). 3,4,5-Trimethoxybenzhydroxamic acid 4a was synthesized according to the previously published procedure by reaction of 3,4,5-trimethoxybenzoic acid with thionyl chloride and subsequent conversion with hydroxylamine hydrochloride under alkaline conditions.62 The Fe(III) complexes were synthesized by deprotonation of the ligand with potassium hydroxide and addition of iron chloride in aqueous or methanolic solution (Scheme 2).The purification of the complexes were found to be the crucial step of the synthesis, because the complexes were good to highly soluble in protic solvents as the formed by-product KCl. Separation via Sephadex G-10 or LH 20 failed and therefore a broad range of different purification strategies were tested. In some cases (6f, 6h, 6i, 6j and 6l) work up could be facilitated by using water as reaction solvents. However, multiple extraction steps were necessary for complexes 6c and 6k to isolate the salt-free compound explaining the poor yields. Overall, the complexes were isolated in poor to good yields (18–82%) depending on the utilized purification protocol. In order to confirm the formation of the desired products, 1H-NMR spectroscopy, electrospray ionization mass spectrometry (ESI-MS) and elemental analyses were performed for the synthesized ligands (see ESI†). Due to the paramagnetic properties of Fe(III) complexes, 1H-NMR spectroscopy could not be utilized for characterization and therefore other methods were used instead (elemental analysis, ESI-MS, X-ray diffraction analysis). The ESI-MS spectra of the complexes (ESI-MS, positive and negative mode) were measured in methanol or in acetonitrile. Overall the positively charged H+, Na+ or K+ adducts were detected. For example complex 6a showed peaks with m/z values of 773, 757 and 547, which were assigned to the [Fe(C10H12NO5)3K]+, [Fe(C10H12NO5)3Na]+ and [Fe(C10H12NO5)2]+ species, respectively. In the case of the dinuclear Fe(III) complex 6g a peak at m/z 390, which can be assigned to [Fe(C7H6NO4)2 − 2H+]−. All detected molecular peaks of the complexes showed the typical isotopic iron pattern. Also the electrochemical behaviour of the complexes 6a–l and their corresponding ligands was studied by means of cyclic voltammetry. Due to the redox activity of the ligands and subsequent reactions after irreversible reduction of iron(III) to iron(II), interpretation of the cyclic voltammograms and clear assignment of the iron reduction peak was not clearly achievable. What can be derived is that all complexes (see S20–S31†) showed only irreversible reduction waves. Depending on the ligand scaffold, the possible reduction peaks of iron(III) were found within a broad potential range but in most cases between −1.6 and −0.5 V vs. NHE. However, the measured values are distinctly lower compared to the reported potentials of Fe(III)-EDTA or Fe(III)-SOD (+0.12 and +0.27 V, respectively)27 and therefore more in the region of ferrienterobactin and ferrioxamine (−0.75 and −0.45 V, respectively).63 In this case Fe(III) cannot be reduced by biological reduction agents and the Fenton reaction is not feasible.
Single-crystal X-ray analysis
Single crystals suitable for X-ray diffraction analysis were obtained for complexes 6a, 6b, 6d, 6e, 6g, 6j by either precipitation from acetone, water, methanol, ethanol or slow diffusion of diethyl ether into acetone or methanol solution (see Experimental section, see Fig. 1 and S14–S19†). The complexes 6j and 6g crystallized in the monoclinic space group P21/n and C2/c, respectively. The complex 6a crystallized in the triclinic centrosymmetric space group P![[1 with combining macron]](https://www.rsc.org/images/entities/char_0031_0304.gif) and 6e in the orthorombic space group Pbca. In case of monomeric iron complexes, the octahedral Fe(III) center is surrounded by three chelate ligands bound via oxygen atoms of the hydroxamate groups (Table S14†). Compounds 6g and 6b crystallized in the monoclinic space group P21/c (Fig. 1). X-ray diffraction studies of 6g confirmed the formation of a dinuclear Fe(III) complex. Catechol groups are well known for their chelating properties and strong interaction with iron; however, the hydroxamic groups seem to have higher affinity towards iron explaining the observed structure. Important bond lengths between iron and the donor atoms are shown in Table 1.
and 6e in the orthorombic space group Pbca. In case of monomeric iron complexes, the octahedral Fe(III) center is surrounded by three chelate ligands bound via oxygen atoms of the hydroxamate groups (Table S14†). Compounds 6g and 6b crystallized in the monoclinic space group P21/c (Fig. 1). X-ray diffraction studies of 6g confirmed the formation of a dinuclear Fe(III) complex. Catechol groups are well known for their chelating properties and strong interaction with iron; however, the hydroxamic groups seem to have higher affinity towards iron explaining the observed structure. Important bond lengths between iron and the donor atoms are shown in Table 1.
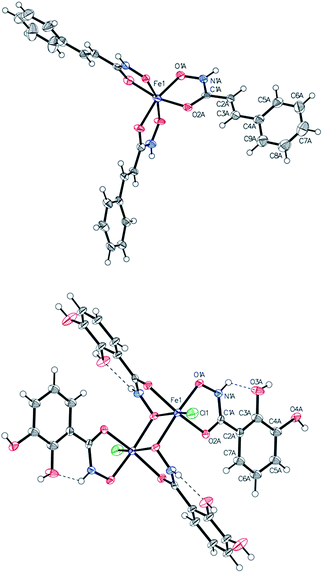 | ||
| Fig. 1 ORTEP view of one independent molecule of 6b (top) and 6g (bottom). Thermal displacement ellipsoids are drawn at the 50% probability level. | ||
| EXAFS45 | 6a | 6b | 6d | 6e | 6g | 6j | |
|---|---|---|---|---|---|---|---|
| Fe–O(C) | 1.98–1.99 | 2.045 | 1.986(3) | 2.021 | 2.026(3) | 2.000 | 2.037(3) |
| Fe–O(N) | — | 1.987 | 2.038(3) | 2.002 | 2.001 | 2.038(6) | 1.991(3) |
| Fe–C | 2.95 | 2.808 | 2.80 | 2.792(6) | 2.785(6) | 2.7805 | 2.794(6) |
| 3.647 | |||||||
| Fe–Fe | 3.3 | — | — | — | — | 3.282 | — |
| Fe–C–C | — | 4.239(6) | 4.217(3) | 4.219(6) | 4.218 | 4.1915 | 4.247(6) |
| Fe–N | — | 2.800(3) | 2.787(6) | 2.81 | 2.798 | 2.839(6) | 2.791(6) |
| Fe–O–C | 125 | 113 | 113 | 114 | 113 | 114.5 | 113 |
Comparison with the EXAFS studies45 of natural humic acids showed the similarity to the model compounds. In all crystallized complexes the Fe–O bond distances were around 2 Å and are in the same range as the distances in humic acids. The bond length indicates the octahedral iron(III) configuration. Complex 6b, with the Fe–O bond length of 1.98 Å showed best agreement with experimental values from EXAFS studies. The Fe⋯C distance in model compounds was between 2.78 Å and 2.81 Å and significantly shorter as in natural complexes where this bond is about 2.95 Å. Due to the shorter distance to carbon, the Fe–O–C bond angle was around 112° and also smaller as described in the literature namely 125°.
The EXAFS studies of natural humic acids indicate the presence of monomeric iron complexes in the solution which fits to all models with exception of 6g. In 6g the Fe⋯Fe bond length of 3.28 Å is in agreement with the values measured for the precipitated fulvic acids where the dimeric/polymeric form is predominant. Overall the synthesized hydroxamate-based Fe(III) complexes seem to be appropriate models for humic acid.
EPR spectroscopy
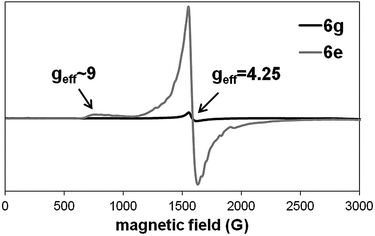
EPR measurements revealed the presence of rhombic high spin Fe(III) in all samples (Fig. 2). The EPR line at geff = 4.25 is a characteristic signal of mononuclear ferric complexes.64 This high-intensity signal results from the three coinciding g values for the I ± 3/2 > doublet at the 5/2 system. The appearance of a weak feature at approximately geff = 9 is also commonly seen in spectra of rhombic Fe(III) complexes and can be attributed to the 1 ↔ 2 transition. For the dinuclear Fe(III) complex 6g, the EPR signals almost disappeared most likely due to spin coupling effects.65 The rhombicity (η) as determined by the zero-field splitting parameters, was calculated to be 0.327 for all the S = 5/2 systems. As a completely rhombic system is reached at η = 0.33, the crystal field at the Fe(III) center shows a strong orthorhombic character.Stability studies
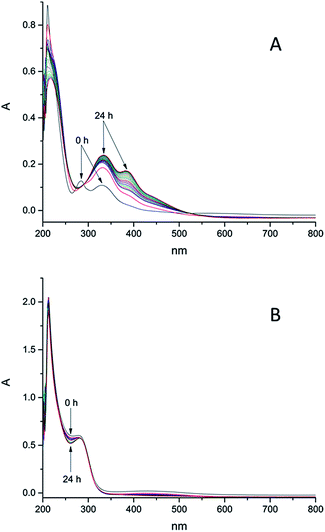
The stability of these model compounds in aqueous systems is important for further biological investigations, because the complexes have to be stable enough to enable cellular iron accumulation and if the complex decomposes too fast, the released iron will precipitate in water. According to literature iron shows high affinity to ligands bearing hydroxamic groups and iron monohydroxamates are, under the condition that no other instable groups are present, in most cases stable in aqueous solutions. At pH regions of our interest, namely 8.2–8.4 (seawater) the formation of trihydroxamates is highly preferred. Stability constants of the complexes with ligand scaffolds similar to our models have been already estimated.66 The determined values were in the range between 28.8 and 29.7 for the formation of trihydroxamates. Logarithmic stability constants of the complexes with benzoic hydroxamic acid and propanohydroxamic acid, which show structural similarities with our models, were 28.8 and 28.44 respectively. Comparing those values with the stability constants of Fe(III) EDTA which is 25.1,67 iron trihydroxamates are supposed to be more stable. However it should be considered that EDTA possesses six binding sides and the formation of its complex with iron(III) is thermodynamically favoured in comparison to bidentate hydroxamates. In order to prove this presumption, we investigated the stability of 6e (25 nM) treated with EDTA in distilled water and seawater. After addition of EDTA (25 nM) to the solution of 6e, significant changes in UV-Vis spectra were observed over 24 h (see S12–S13†) indicating ligand exchange reactions. Therefore EDTA was not added to the complex solutions used for algal growth experiments. The aqueous stability of the synthesized complexes in seawater at pH ≈ 8.2–8.4 (see Fig. S1–S4†) and distilled water (see Fig. S5–S9†) was monitored over 24 h by means of UV-Vis spectrometry. Complex 6k bearing hydrocaffeic hydroxamate was found to be the most instable over this time range, whereas most of the investigated complexes showed no changes in their UV-Vis spectra under these conditions (Fig. 3). Furthermore, 6k showed an increased stability in distilled water over 24 h. The possible explanation for the changes in the recorded UV-Vis spectra of 6k can be attributed to the presence of a uncoordinated catecholic moiety, which is prone to photo-oxidation in seawater; however, stabilization can be achieved by coordination of iron(III) ions.The obtained results confirm that the Fe(III) is tightly bound to the hydroxamate and the free catechol group is able to react with other metal ions or undergo oxidation. In seawater, the intensity of the signal at 335 nm increases over 24 h and also a new signal arose at 380 nm over time. In distilled water only the signal at 335 nm increased but no differences in absorbance at 380 nm was observed. Measurements at pH 11 showed the increase in absorbance at 335 nm and also the signal at 380 nm, which appeared directly after pH-adjustment from 7 to 11. On the basis of these results, the signal at 335 nm can be assigned to the oxidation of catecholic moiety, which proceeds more slowly in distilled water. The signal at 380 nm seems to be associated with the deprotonation of 6k which occurs very fast at pH 11 in contrast to pH 8.2–8.4 (seawater). Free catecholic moieties are also present in the structure of 6g, but in contrast to 6k, this model compound remained stable in solution. This contrary behaviour might be explained by the formation of stable hydrogen bonds between the nitrogen and the oxygen atoms of the ligand scaffold. To investigate the impact of the ligand scaffold on the observed different behaviour of 6g and 6k, the stability of the respective free ligands, namely dihydrocaffeic hydroxamic acid and hypogallic hydroxamic acid, were determined in both seawater and distilled water. Both were found to be instable in seawater and probably oxidation occurred over time. Complex 6k was not the only instable compound in seawater. We also saw significant changes in UV-Vis spectra of the complexes 6f, 6i and 6l (Fig. 4). In contrast to the decay in seawater, these compounds were found to be remarkably stable in distilled water. The observed results for 6f, 6i and 6l might be explained by the reaction or interaction with metal ions from seawater. Also the pH value of approximately 8.2–8.4 can contribute to the observed changes. To verify this assertion the stability of those complexes at pH 11 was investigated. In case of the complexes 6f and 6l it is most likely that both of them are deprotonated at higher pH value (see Fig. S10 and S11†). The increasing signal in seawater over 24 h is present in the spectra obtained at pH 11 immediately after base addition. The complex 6i seems to interact with seawater components because no influence of pH change on stability has been observed.
Algal growth experiments
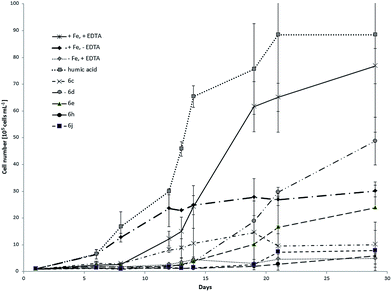
C. salina and D. lutheri showed significantly different growth response depending on the tested model compounds and control samples. Fig. 5 shows the respective growth curves of C. salina batch cultures using different iron sources and chelating agents. Without iron supply the culture can't grow effectively after its own intracellular reserve is consumed. If our compounds do not supply algae with iron, the culture growth will be comparable or worse. As second negative control we supplied the culture with iron but we waived the chelator EDTA. In this case the bioavailability of iron and other metal ions is decreased. The EDTA complex with iron has good aqueous solubility; however, the metal is bound very strongly to chelating ligand, limiting its bioavailability. Nevertheless the complex is light sensitive, which results in reduction of Fe(III) to Fe(II) and release of iron (lower affinity of EDTA towards Fe(II)).68 Thus the growth of C. salina without EDTA is expected to be worse than in the ideal medium. This negative control evaluates the impact of the chelator and other metal ions on the culture. It also shows if the algal species can uptake iron and other metal ions at very low concentrations and how far the growth will be inhibited. Samples with ideal f/2 medium without iron showed, as expected, poor growth.Controls with medium with iron but without the chelator EDTA showed moderate growth rates whereas samples with full medium with iron and EDTA have grown to algae concentration of approximately 7.7 × 10⁶ ± 6.6 × 10⁵ cells per mL. It is important to mention, that the samples without EDTA showed no further growth after 12 days. At the beginning of experiment the removal of inorganic iron was not necessarily complete. The low concentration of dissolved iron could be sufficient to support the growth of culture. After achieving the cell number of 3 × 10⁶ ± 2.2 × 10⁵ the requirements for iron were probably too high to support further growth. Surprisingly the sample containing isolated humic acid fraction had the biggest impact on the culture, reaching the concentration near 9 × 10⁶ ± 3.6 × 10⁶ cells per mL at the end of the experiment, resulting in slightly better growth than in the ideal medium. Moreover this sample showed not only the highest cell concentration at the end of experiment but also the fastest response and growth. We assume that, similar to the Fe-EDTA complex, the light sensitivity of the Fe(III)–AHS complexes and photoreduction of the Fe(III) to Fe(II) may contribute to the observed effects in C. salina. Moreover Fe(III)–AHS complexes can bind to the cell surface of the algae and undergo kinetically favoured biochemical reduction.69 The control sample without chelator EDTA also showed quick response and grew fast. The explanation for this could be the precipitation of iron(III) and formation of amorphous Fe(OH)3, which can supply algae with iron. The solubility of amorphous Fe(OH)3 is much better than the solubility of crystalline Fe(OH)3. Over days amorphous Fe(OH)3 can convert to the crystalline form. Therefore the bioavailability of iron is too low after a few days to cover the requirements.70 The model compounds showed mostly moderate to good impact on the culture growth with exception of 6c and 6j, which didn't significantly enhance the growth rate of C. salina comparing to the controls without iron. It is important to mention that the impact of model compounds on the growth of C. salina was noticeably weaker than for the control sample with chelator and iron but it was stronger compared to the control without iron. The relation between the concentration of algae in samples treated with model compounds and control samples at the end of the experiment is shown in Table 2. The most efficient growth promoting model compound was 6d with salicylic hydroxamic acid, where the treated samples reached the end concentration of 63.4% compared to ideal conditions. Moreover the algal growth was also better than in samples containing iron chloride without chelator. The similar model compound 6e was promoting growth of the C. salina and the samples algae concentration reached 31% of the concentration in samples under ideal conditions. Thus our experiments have shown that iron can be released from the hydroxamate complexes and absorbed by algae. Furthermore the solubility of the complexes plays also an important role for the bioavailability of iron. Complexes 6e and 6d with one free hydroxy group were more efficient promoting growth of C. salina than the complexes with methoxy groups or aliphatic chains with relative poor water solubility like 6j and 6c. Another aspect of the first experiment was the different growth patterns of the cultures. Samples with HS and iron without EDTA started to grow very soon but we noticed the short delay in growth of the sample with the ideal medium.
| 6c | 6d | 6e | 6h | 6j | Humic acid | |
|---|---|---|---|---|---|---|
| +Fe, +EDTA in % | 13.1 | 63.4 | 31 | 7.7 | 10.2 | 115 |
| −Fe, +EDTA | 2 | 10 | 5 | 1.2 | 1.6 | 18 |
| +Fe, −EDTA | 0.3 | 1.6 | 0.8 | 0.2 | 0.3 | 3 |
This delay was much more significant in case of model compounds. We observed the distinct changes in algae concentration after approximately two weeks. That lead us to the conclusion that the stability of the complexes in water seems to play an important role for the release and bioavailability of iron. Unfortunately it was not possible to monitor the growth of the culture longer than 30 days due to the limited stability of f/2 medium over this time period. Further observation would not provide reliable values due to the changing conditions between several cultures. In the second experiment, three model compounds namely 6b, 6i and 6k were tested. Fig. 6 shows growth curves of C. salina batch cultures under different conditions including standard deviation.
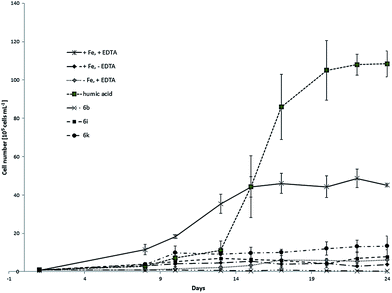 | ||
| Fig. 6 Growth curves of C. salina (error bars: ±SD) treated with model compounds 6b, 6i and 6k compared to control samples (+Fe, +EDTA; +Fe, −EDTA; −Fe, +EDTA). | ||
The samples kept at ideal conditions reached after 24 days the algae concentration of approximately 4.5 × 10⁶ ± 8.2 × 10⁴ cells per mL whereas the growth of cultures lacking EDTA or iron was poor. In contrast to the first experiment, control samples with chelator and without iron reached slightly higher concentration as control samples with iron without chelator. Nevertheless both values were low. Similar to the first experiment, samples containing isolated humic acid fraction had the biggest positive impact on the culture, reaching at the end of the experiment the concentration near 10 × 106 ± 6.7 × 10⁵ cells per mL which was better as the end concentration of the ideal medium. Model compounds 6b and 6i did not significantly support the growth of C. salina. In fact, in samples treated with 6b the lowest final algal concentration was observed. This can be explained with hydrophobic character and low solubility of the cinnamic hydroxamic acid in the complex 6b. UV-Vis studies of this compound have shown significant decrease in absorbance after 24 h due to the precipitation. Together with the results from the algal growth experiments, we assume that the iron bound in 6b is not sufficiently bioavailable for the C. salina. Samples containing 6k showed best response to the treatment and reached the concentration of 1.3 × 10⁶ ± 5.2 × 10⁵ cells per mL which is 30% of the algal concentration in ideal medium (Table 3). This effect of 6k on algae growth can be explained by the moderate stability of the complex in seawater which was already mentioned in UV-Vis studies. Moreover the ligand in 6k has two possible metal-binding sides. Dihydrocaffeic hydroxamic acid is bound via hydroxamate to iron and the cathecholic group is free for coordination which might additionally enhance the bioavailability of other metal ions as for example Zn and Cu.
| 6b | 6i | 6k | Humic acid | |
|---|---|---|---|---|
| +Fe, +EDTA in % | 0.7 | 17.3 | 29.7 | 166 |
| −Fe, +EDTA | 0.05 | 1.3 | 2.2 | 17.6 |
| +Fe, −EDTA | 0.1 | 2.1 | 3.6 | 29.2 |
This is an important factor because it is unlikely to achieve the same growth rate of the culture as under the ideal conditions using model complexes instead of EDTA and iron chloride. EDTA is not only chelator for iron but also for other metals included in micronutrient solution like for example Cu, Zn and Mn. In order to compare the results from the first two experiments with C. salina, we performed the same tests with the photoautotrophic algal species D. lutheri. In this experiment, six model compounds namely 6c, 6d, 6e, 6g, 6j and 6k were investigated. Fig. 7 shows the determined growth curves of D. lutheri batch cultures under different conditions including standard deviation. The culture of D. lutheri reached at all tested conditions significantly lower cell numbers in the growth experiments compared to C. salina. Control samples with ideal medium with iron and EDTA have grown to algae concentration of approximately 2.1 × 10⁶ ± 7.1 × 10⁵ cells per mL. Surprisingly the samples containing medium with iron but without the chelator EDTA had almost the same impact on the culture as the positive control whereas the samples lacking iron reached the end concentration of 1 × 10⁶ ± 6 × 10⁴ cells per mL.
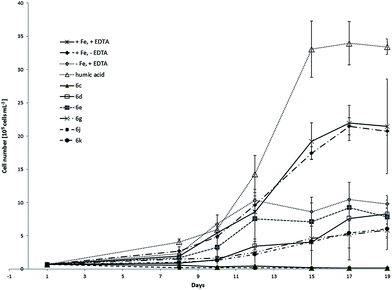 | ||
| Fig. 7 Growth curves of D. lutheri treated with model compounds 6c, 6d, 6e, 6g, 6j and 6k compared to control samples (+Fe, +EDTA; +Fe, −EDTA; −Fe, +EDTA). | ||
These findings might be explained by slower growth due to the lower cell number, higher intracellular iron pool or better iron uptake at low concentrations. As already observed in C. salina, samples treated with soluble humic acid fraction showed the best growth response. None of the investigated model compounds showed a big impact on the culture and the concentrations at the end of the experiment remained under the concentration of samples treated with ideal medium without iron. The complexes 6c and 6j did not support the growth of D. lutheri at all. Those two complexes had also been found to be the less effective in the culture of C. salina. The relation between the concentration of algae in samples treated with model compounds and control samples at the end of the experiment is shown in Table 4.
| 6c | 6d | 6e | 6g | 6j | 6k | Humic acid | |
|---|---|---|---|---|---|---|---|
| +Fe, +EDTA in % | 0 | 38.6 | 36.6 | 27.2 | 0 | 28.1 | 155.7 |
| −Fe, +EDTA | 0 | 0.8 | 0.8 | 0.6 | 0 | 0.6 | 3.4 |
| +Fe, −EDTA | 0 | 0.4 | 0.4 | 0.3 | 0 | 0.3 | 1.6 |
In all performed algal experiments, both C. salina and D. lutheri showed the typical growth pattern in full medium.71,72 In iron-free samples (−Fe, +EDTA) the growth was strongly inhibited, which means, iron deficiency conditions were given. The relative long time between the beginning of each experiment and start of the exponential growth is typical and known from large-scale iron fertilization experiments in HNLC regions.9,73
Conclusions
Herein, we present the synthesis of 11 novel iron(III) complexes as promising model compounds for humic acids. All complexes were characterized by elemental analysis, ESI-MS, IR, EPR, cyclic voltammetry and some of them by X-ray diffraction analysis. Comparison of the bond lengths, angles and distances in evaluated X-ray structures with the EXAFS studies45 of natural humic acids showed that the selected model structures are suitable as AHS model compounds. The ligand scaffold and the presence of different functional groups seem to have a big influence on the stability and solubility of the compounds, which was monitored in water and seawater over 24 h. We determined the impact of the synthesized model compounds on growth of the algae species C. salina and D. lutheri. The study revealed that several of our models support the growth of the algae culture confirming that the iron bound in the complexes is bioavailable. The results obtained from algal growth experiments support our proposal that iron complexes with benzoic hydroxamates are suitable models for the research on iron binding ability of humic substances; however, the induced growth upon treatment with the model compounds is still lower compared to ideal conditions and might be explained by the observed low redox potentials of the complexes. Therefore optimization with regard on the algal growth and redox potentials is required and currently ongoing. Furthermore, the synthesized model compounds will be used as reference substances in EXAFS experiments, where the similarity in the nearest surrounding of iron in the natural humic acids will be investigated.Acknowledgements
We cordially thank the FWF Austrian Science Fund (Project number P 25849-N19) for financial support and Markus Gruber for his valuable advices regarding algae cultivation.Notes and references
- R. Osterber, Nature, 1974, 249, 382–383 CrossRef
.
- F. Egami, J. Biochem., 1975, 77, 1165–1169 CAS
.
- J. A. Raven, New Phytol., 1988, 109, 279–287 CrossRef CAS
.
- W. W. Gregg, M. E. Conkright, J. E. O'Reilly, F. S. Patt, M. H. H. Wang, J. A. Yoder and N. W. Casey, Appl. Opt., 2002, 41, 1615–1628 CrossRef PubMed
.
- C. B. Field, M. J. Behrenfeld, J. T. Randerson and P. Falkowski, Science, 1998, 281, 237–240 CrossRef CAS PubMed
.
- P. W. Boyd and M. J. Ellwood, Nat. Geosci., 2010, 3, 675–682 CrossRef CAS
.
- R. F. Nolting, L. J. A. Gerringa, M. J. W. Swagerman, K. R. Timmermans and H. J. W. de Baar, Mar. Chem., 1998, 62, 335–352 CrossRef CAS
.
- J. H. Martin and R. M. Gordon, Deep–Sea Res., 1988, 35, 177–196 CrossRef CAS
.
- J. W. Pitchford and J. Brindley, J. Plankton Res., 1999, 21, 525–547 CrossRef
.
- A. M. Edwards, T. Platt and S. Sathyendranath, Ecol. Modell., 2004, 171, 103–125 CrossRef CAS
.
- A. Watson, P. Liss and R. Duce, Limnol. Oceanogr., 1991, 36, 1960–1965 CrossRef
.
- J. H. Martin and S. E. Fitzwater, Nature, 1988, 331, 341–343 CrossRef CAS
.
- S. E. Fitzwater, K. H. Coale, R. M. Gordon, K. S. Johnson and M. E. Ondrusek, Deep Sea Res., Part II, 1996, 43, 995–1015 CrossRef CAS
.
- D. A. Hutchins and K. W. Bruland, Nature, 1998, 393, 561–564 CrossRef CAS
.
- J. Lewandowska and A. Kosakowska, Oceanologia, 2004, 46, 269–287 Search PubMed
.
- B. W. Frost, Mar. Ecol.: Prog. Ser., 1987, 39, 49–68 CrossRef
.
- C. L. Moloney and J. G. Field, Limnol. Oceanogr., 1989, 34, 1290–1299 CrossRef CAS
.
- C. L. Moloney and J. G. Field, J. Plankton Res., 1991, 13, 1003–1038 CrossRef
.
- N. M. Price, L. F. Andersen and F. M. M. Morel, Deep–Sea Res., 1991, 38, 1361–1378 CrossRef
.
- W. G. Sunda and S. A. Huntsman, Mar. Chem., 1995, 50, 189–206 CrossRef CAS
.
- J. F. Wu, E. Boyle, W. Sunda and L. S. Wen, Science, 2001, 293, 847–849 CrossRef CAS PubMed
.
- J. F. Wu and G. W. Luther, Mar. Chem., 1995, 50, 159–177 CrossRef CAS
.
- E. L. Rue and K. W. Bruland, Mar. Chem., 1995, 50, 117–138 CrossRef CAS
.
- A. E. Witter and G. W. Luther, Mar. Chem., 1998, 62, 241–258 CrossRef CAS
.
- C. M. G. Van Den Berg, Mar. Chem., 1995, 50, 139–157 CrossRef CAS
.
-
K. Hunter and D. Turner, The Biogeochemistry of Iron in Seawater, Wiley, West Sussex, England, 2001 Search PubMed
.
- J. L. Pierre and M. Fontecave, BioMetals, 1999, 12, 195–199 CrossRef CAS PubMed
.
- J. K. Moore and O. Braucher, Biogeosciences, 2008, 5, 631–656 CAS
.
- E. R. Sholkovitz, Geochim. Cosmochim. Acta, 1976, 40, 831–845 CrossRef CAS
.
- J. M. Eckert and E. R. Sholkovitz, Geochim. Cosmochim. Acta, 1976, 40, 847–848 CrossRef CAS
.
- E. A. Boyle, J. M. Edmond and E. R. Sholkovitz, Geochim. Cosmochim. Acta, 1977, 41, 1313–1324 CrossRef CAS
.
- E. R. Sholkovitz and D. Copland, Geochim. Cosmochim. Acta, 1981, 45, 181–189 CrossRef CAS
.
- K. A. Hunter, M. R. Leonard, P. D. Carpenter and J. D. Smith, Colloids Surf., A, 1997, 120, 111–121 CrossRef CAS
.
- U. Nowostawska, J. P. Kim and K. A. Hunter, Mar. Chem., 2008, 110, 205–210 CrossRef CAS
.
- R. Krachler, F. von der Kammer, F. Jirsa, A. Suphandag, R. F. Krachler, C. Plessl, M. Vogt, B. K. Keppler and T. Hofmann, Global Biogeochem. Cycles, 2012, 26, GB3024 CrossRef
.
- R. Krachler, R. F. Krachler, F. von der Kammer, A. Suephandag, F. Jirsa, S. Ayromlou, T. Hofmann and B. K. Keppler, Sci. Total Environ., 2010, 408, 2402–2408 CrossRef CAS PubMed
.
- R. Krachler, F. Jirsa and S. Ayromlou, Biogeosciences, 2005, 2, 311–315 CrossRef CAS
.
- X. W. Liu and F. J. Millero, Mar. Chem., 2002, 77, 43–54 CrossRef CAS
.
- T. Hiemstra and W. H. van Riemsdijk, Mar. Chem., 2006, 102, 181–197 CrossRef CAS
.
- S. A. Waksman and T. C. Cordon, J. Am. Chem. Soc., 1936, 58, 969–972 CrossRef CAS
.
- S. A. Waksman and I. J. Hutchings, Soil Sci., 1936, 42, 119–130 CrossRef CAS
.
- G. W. Ding, J. D. Mao and B. S. Xing, Commun. Soil Sci. Plant Anal., 2001, 32, 1991–2005 CrossRef CAS
.
- J. B. Jahnel and F. H. Frimmel, Acta Hydrochim. Hydrobiol., 1995, 23, 31–35 CrossRef CAS
.
- E. Ibisanmi, S. G. Sander, P. W. Boyd, A. R. Bowie and K. A. Hunter, Deep Sea Res., Part II, 2011, 58, 2113–2125 CrossRef CAS
.
- J. W. J. van Schaik, I. Persson, D. B. Kleja and J. P. Gustafsson, Environ. Sci. Technol., 2008, 42, 2367–2373 CrossRef CAS PubMed
.
- F. H. Frimmel and J. Geywitz, Fresenius' Z. Anal. Chem., 1983, 316, 582–588 CrossRef CAS
.
- F. H. Frimmel, Z. Wasser- Abwasser-Forsch., 1981, 14, 7–10 CAS
.
- L. Bauer and O. Exner, Angew. Chem., Int. Ed. Engl., 1974, 13, 376–384 CrossRef
.
- D. C. Glick and A. Davis, Org. Geochem., 1991, 17, 421–430 CrossRef CAS
.
- H. Knicker, P. G. Hatcher and A. W. Scaroni, Int. J. Coal Geol., 1996, 32, 255–278 CrossRef CAS
.
- A. Vairavamurthy and S. Wang, Environ. Sci. Technol., 2002, 36, 3050–3056 CrossRef CAS PubMed
.
- W. C. Barrette, H. W. Johnson and D. T. Sawyer, Anal. Chem., 1984, 56, 1890–1898 CrossRef CAS PubMed
.
- W. R. Hagen, Mol. Phys., 2007, 105, 2031–2039 CrossRef CAS
.
-
M. R. Pressprich and J. Chambers, SAINT + Integration Engine, Program for Crystal Structure Integration, Bruker Analytical X-ray systems, Madison, 2004 Search PubMed
.
- G. M. Sheldrick, Acta Crystallogr., Sect. A: Found. Crystallogr., 2007, 64, 112 CrossRef PubMed
.
- O. V. Dolomanov, L. J. Bourhis, R. J. Gildea, J. A. K. Howard and H. Puschmann, J. Appl. Crystallogr., 2009, 42, 339–341 CrossRef CAS
.
- C. B. Hubschle, G. M. Sheldrick and B. Dittrich, J. Appl. Crystallogr., 2011, 44, 1281–1284 CrossRef PubMed
.
- R. R. Guillard and J. H. Ryther, Can. J. Microbiol., 1962, 8, 229–239 CrossRef CAS PubMed
.
- D. R. Kester, I. W. Duedall, D. N. Connors and R. m. Pytkowic, Limnol. Oceanogr., 1967, 12, 176–179 CrossRef CAS
.
- R. Krachler, R. F. Krachler, G. Wallner, S. Hann, M. Laux, M. F. C. Recalde, F. Jirsa, E. Neubauer, F. von der Kammer, T. Hofmann and B. K. Keppler, Mar. Chem., 2015, 174, 85–93 CrossRef CAS PubMed
.
- A. S. Reddy, M. S. Kumar and G. R. Reddy, Tetrahedron Lett., 2000, 41, 6285–6288 CrossRef CAS
.
- R. Takahashi, T. Nunokawa, T. Shibuya, R. Tomita, Y. Tatewaki, S. Okada, T. Kimura, S. Shimada and H. Matsuda, Bull. Agric. Chem. Soc. Jpn., 2012, 85, 236–244 CrossRef CAS
.
- S. R. Cooper, J. V. Mcardle and K. N. Raymond, Proc. Natl. Acad. Sci. U. S. A., 1978, 75, 3551–3554 CrossRef CAS
.
-
W. R. Hagen, Biomolecular EPR Spectroscopy, CRC Press, Boca Raton, Fl, USA, 2009 Search PubMed
.
- A. M. N. Silva, X. Kong, M. C. Parkin, R. Cammack and R. C. Hider, Dalton Trans., 2009, 8616–8625 RSC
.
- E. Farkas, E. Kozma, M. Petho, K. M. Herlihy and C. Micera, Polyhedron, 1998, 17, 3331–3342 CrossRef CAS
.
- H. Gomathi, Bioelectrochemistry, 2000, 16, 459–465 CAS
.
- F. M. M. Morel, Abstr. Pap., Jt. Conf.–Chem. Inst. Can. Am. Chem. Soc., 2005, 230, U1712 Search PubMed
.
- H. Lis, Y. Shaked, C. Kranzler, N. Keren and F. M. M. Morel, ISME J., 2015, 9, 1003–1013 CrossRef CAS PubMed
.
- S. M. Kraemer, Aquat. Sci., 2004, 66, 3–18 CrossRef CAS
.
- A. S. Miron, M. C. C. Garcia, F. G. Camacho, E. M. Grima and Y. Chisti, Enzyme Microb. Technol., 2002, 31, 1015–1023 CrossRef
.
-
G. E. Fogg and B. Thake, Algal Cultures and Phytoplanktion Ecology, The University of Wisconsin Press, Wisconsin, United States of America, 1987 Search PubMed
.
- M. Fujii and F. Chai, Deep Sea Res., Part II, 2009, 56, 2936–2947 CrossRef CAS
.
Footnote |
| † Electronic supplementary information (ESI) available. CCDC 1436729–1436734. For ESI and crystallographic data in CIF or other electronic format see DOI: 10.1039/c5ra25256c |
| This journal is © The Royal Society of Chemistry 2016 |

