Ultra-high Rhodamine B adsorption capacities from an aqueous solution by activated carbon derived from Phragmites australis doped with organic acid by phosphoric acid activation

Zizhang Guo, Jian Zhang* and Hai Liu
School of Environmental Science and Engineering, Shandong Key Laboratory of Water Pollution Control and Resource Reuse, Shandong University, Jinan 250100, China. E-mail: sduguozizhang@gmail.com; zhangjian00@sdu.edu.cn; Fax: +86 531 88364513; Tel: +86 531 88363015

Received 28th November 2015 , Accepted 5th April 2016

First published on 6th April 2016


Abstract

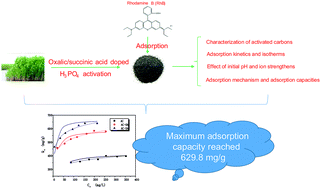
This study shows that oxalic acid (OA) and succinic acid (SA) were employed to modify Phragmites australis (PA)-based activated carbons (ACs) during phosphoric acid activation to improve Rhodamine B (RhB) removal from aqueous solutions. This study shows that oxalic acid (OA) and succinic acid (SA) were employed to modify Phragmites australis (PA)-based activated carbons (ACs) during phosphoric acid activation to improve Rhodamine B (RhB) removal from aqueous solutions. The unmodified activated carbon (AC), OA-modified and SA-modified ACs (AC-OA and AC-SA) were characterized by N2 adsorption/desorption, Boehm's titration, pHpzc and FT-IR analysis. It was found that the BET surface area of AC-OA (1040.36 m2 g−1) and AC-SA (1775.01 m2 g−1) was larger than unmodified AC (745.68 m2 g−1). In addition, AC-OA (2.987 mmol g−1) and AC-SA (3.194 mmol g−1) exhibited dramatically higher surface acidity than AC (1.852 mmol g−1). The RhB adsorption capacities of ACs were further investigated at different contact times, pHs, and ionic strengths. The adsorption equilibrium data of ACs were properly fitted to the Langmuir model. The kinetic studies show that the adsorption of RhB proceeds according to the pseudo-second order kinetics. The maximum RhB adsorption capacities of AC-OA (550.9 mg g−1) and AC-SA (629.8 mg g−1) were significantly higher than that of AC (417.1 mg g−1) due to their larger BET surface areas. Higher RhB adsorption could be attributed to their surface acidic functional groups.

1. Introduction

Synthetic dyes are generally released into the environment from industrial effluents and the discharge of highly-colored synthetic dye effluents can be very damaging to the receiving water bodies.1 Rhodamine B (RhB) is a basic synthetic dye imparting a red color in an aqueous solution and is widely used in paper, textile, leather, and paint industries.2 Human and animal exposure to RhB causes irritation to the skin, eyes and respiratory tract. The carcinogenicity, reproductive and developmental toxicity, neurotoxicity and chronic toxicity of RhB towards humans and animals have been reported.3–6 Furthermore, water-soluble dyes are characterized by their poor biodegradability and it is estimated that about 20% of the total dye remains in the effluent during the production process, thus building high concentrations in wastewaters.7,8 High concentrations of synthetic dyes in effluents results in the formation of wastewaters characterized by their toxicity, reduced light transparency and high organic load content.8

Consequently, the removal of colored synthetic dyestuffs from waste effluents becomes environmentally important. Many treatment processes have been applied for the removal of dyes from wastewater, including adsorption,1 photocatalytic degradation,6 chemical oxidation,4 electrochemical degradation,9 and AOP,10 but the adsorption process using suitable adsorbent has shown high efficiency for removal of dyes. Many absorbents have been used to remove dyes from wastewater, including tea leaves,1 industrial solid waste,3 fly ash,4 and Fe3O4 nanoparticles.5 However, their low removal abilities for high concentration dyes in wastewater often limit their application. Activated carbon (AC) is the most widespread adsorbent used in the removal of dyes due to its superior removal ability and adsorption capacity. There are numerous reports on the adsorption removal of RhB with ACs.3,11–13 However, the study on the Phragmites australis (PA)-based ACs as an adsorbent for removal of high concentrations of RhB from water has not been reported.

A variety of carbonaceous materials, such as biomass and their wastes,14,15 coal,16 and some polymers,17 have been used as precursors to prepare ACs. Because of the advantages of environmental protection and low-cost, preparing ACs with biomass wastes (lotus stalks, feathers, and bamboo) has attracted increasing attention in recent years.18–20 The adsorption performance of AC depends greatly on its well-developed porosity and surface chemical properties. The physicochemical properties of AC are tightly related to its raw material and method of preparation. Phosphoric acid activation is a customary method of producing ACs and has become the major method for the industrial preparation of ACs because of its lower activation temperature and reduced pollution.21,22

To obtain high-performance ACs, phosphoric acid activation doped with oxalic acid (OA) or succinic acid (SA) is employed in place of the single activating agent method for the preparation of AC. Because tartaric acid and citric acid have multiple groups that can easily bind on the adsorbent's surface, impregnating tartaric acid and citric acid onto the adsorbent (activated carbons and lignocellulose materials) was used to improve their adsorption ability.23,24 However, to date, no relevant studies have been performed on modifying activated carbon with OA and SA during the preparation process. At elevated temperature, phosphoric acid, as a good catalyst, could promote not only the hydrolysis of lignocelluloses, but also the etherification and esterification between Phragmites australis (PA) and OA/SA.24 Thus, this modification method may increase the acidic groups of the activated carbon produced.

Phragmites australis (PA) is abundant in the constructed wetland in China. With the harvest of PA in the winter, a great deal of PA wastes are left. In this study, PA served as the raw material to prepare ACs by phosphoric acid activation doped with the oxalic acid/succinic acid. The modified ACs were used as adsorbent for RhB removal for the first time and the adsorption equilibrium and kinetic properties of RhB on ACs were measured.

2. Materials and methods

2.1. Adsorbate and chemicals

A stock solution of 1000 mg L−1 of RhB was prepared by dissolving 1 g of dye in 1000 mL of double-distilled water and used for further studies by diluting to the concentrations required. The properties of the dye and organic acids (OA and SA) are given in Tables S1 and S2, respectively. All chemical reagents used in this study were of analytical grade.

2.2. Preparation of activated carbon

Phragmites australis (PA) was harvested from Nansi Lake in Shandong Province (China). PA was washed repeatedly with distilled water to eliminate the dust and soluble impurities, dried at 105 °C for 12 h and pulverized. PA with a particle size fraction of 0.45–1.0 mm was used as a precursor for the preparation of activated carbon. PA (10 g) was fully soaked in H3PO4 solution (85 wt%) at the given ratio (g H3PO4[thin space (1/6-em)]:[thin space (1/6-em)]g PA) and with different amounts of OA/SA (0–0.05 mol). After impregnation at room temperature for 10 h, the samples were heated to the desired temperature of 450 °C and maintained for 1 h in a muffle furnace under pure N2 conditions. After cooling to room temperature, carbonized materials were thoroughly washed with distilled water until the pH of the washing liquid was steady. Finally, ACs were filtered, dried at 105 °C for 10 h and sieved to 120 mesh with standard sieves (Model U200).

2.3. Characterization methods

The pore structure characteristics of ACs were determined by N2 adsorption/desorption at 77 K after degassing at 250 °C for 6 h using a surface area analyzer (Quantachrome Corporation, USA). Boehm's titration method25 was utilized to quantify the acidic functional groups on the surfaces of AC. The determination of pHpzc (point of zero charge) was carried out following a batch method proposed in the literature.26 The surface functional groups of ACs (ACs before and after RhB adsorption) were analyzed with Fourier transform infrared (FT-IR) spectroscopy (VERTEX70 spectrometer, Bruker Corporation, Germany). The surface morphology of the carbons was analyzed by a scanning electron microscope (SEM) (Hitachi 4800, Japan). Surface elemental compositions of the carbons were quantified using an X-ray photoelectron spectrometer (XPS) (Thermo Scientific ESCALAB 250, USA) with Al-Kα (1486.8 eV photons) irradiation source. All spectra were calibrated by the C 1s peak at 284.8 eV.

2.4. Adsorption experiments

Batch adsorption experiments were performed by adding 30 mg ACs into 50 mL RhB solution (400 mg L−1) to investigate the effect of contact times, pH, and ionic strengths on the adsorption. The samples were shaken at room temperature (25 ± 1 °C) at 120 rpm for 24 h to ensure that the sorption equilibrium was reached. Duplicate samples were prepared for all adsorption experiments. After equilibrium, the samples were filtered through a 0.45 μm membrane filter. The initial and residual concentration of RhB was determined by a UV-Vis spectrophotometer (UV-5100, Shanghai) at the wavelength of 552 nm. The removal efficiency and the amounts of RhB adsorbed on ACs, Qe (mg g−1), were calculated using the following eqn (1) and (2):
 
image file: c5ra25200h-t1.tif(1)
 
Qe = (C0Ce)V/W (2)
where C0 and Ce are the initial and equilibrium concentrations of RhB in the aqueous solution (mg L−1), respectively, V is the volume (L) of the solution, and M is the mass of adsorbent used (g).

3. Results and discussion

3.1. Preparations

The effect of impregnation ratio (IR) and duration on the acidic groups and adsorption equilibrium of RhB were evaluated at the concentration of 400 mg L−1 and equilibrium time of 12 h (Fig. S1). It can be clearly observed that acidic groups increased from 1.05 to 1.85 with an increasing IR from 0.5 to 2.0 and then slightly decreased when the IR was higher than 2.0. The maximum concentration was obtained at impregnation ratio of 2.0. The RhB removal efficiency followed the same trend. At low IR, the interactions between activation agent and precursors or the hydrolysis products of the precursors resulted in the formation of functional groups, which were stable. With the increase of impregnation ratio, the activation agent, which was unable to incorporate into the particle of the precursors, formed a hard film surrounding the particle prohibiting the diffusion of oxygen into the particle. The trend of RhB removal efficiency was because the acidic groups play a key role in RhB adsorption. From Fig. S1(b), the best impregnation time is 10 h.

The effect of OA and SA ratios on the removal efficiency of RhB were studied by adding 30 mg ACs into 50 mL RhB solution (600 mg g−1) (Fig. S2). It can be clearly observed that RhB removal efficiency increased 57–85% with increasing OA ratio from 0.01 to 0.04 (see Fig. S2(a)). Beyond that value, further increase in the OA ratio showed a gradually decrease of RhB removal efficiency. Similarly, the SA ratio from 0.01 to 0.04 showed an enhancement of RhB removal efficiency from 63% to 97% (see Fig. S2(b)) and then steadily decreased. The best removal efficiency of RhB was obtained at the organic acid[thin space (1/6-em)]:[thin space (1/6-em)]PA ratio of 0.04 mol acid[thin space (1/6-em)]:[thin space (1/6-em)]10 g PA. From the results obtained, the best removal efficiency of RhB was used in further investigations of the physicochemical properties and the factors affecting the adsorption experiments.

3.2. Characterizations

Fig. 1 shows the SEM micrographs of AC, AC-OA and AC-SA. Comparison of these micrographs shows that the modification does not significantly change the morphology of the surface matrix of the carbons. However, the acid modification decreases the number of cracks and cavities on the carbon surface, which is due to the corrosion of OA and SA on the carbon surface in the activating process. N2 adsorption and desorption isotherms and pore size distributions for ACs are depicted in Fig. 2. It was found that the mesoporous structure for each AC was indicated by the presence of hysteresis for each isotherm at P/P0 above 0.4 (Fig. 2a). The results also can be confirmed by pore size distributions of some pores that the carbon had with pore width between 2 and 9 nm (Fig. 2b). The textural parameters of ACs are shown in Table 1. AC-OA and AC-SA possessed the larger surface area and Vtot than AC, which is mainly due to the doped organic acids increasing the corrosion. AC-SA exhibited the highest surface area, Vmic and Vext, whereas AC-OA exhibited higher mesoporous structure and a higher pore volume than AC.
image file: c5ra25200h-f1.tif
Fig. 1 SEM images of AC (a and b), AC-OA (c and d) and AC-SA (e and f) (a, c and e, magnification 25[thin space (1/6-em)]000×; (b, d and f), magnification 100[thin space (1/6-em)]000×).

image file: c5ra25200h-f2.tif
Fig. 2 (a) N2 adsorption and desorption isotherms and (b) pore size distributions of activated carbons.
Table 1 Textural and chemical characteristics of activated carbons
Activated carbon AC AC-OA AC-SA
a BET surface area (SBET) was determined by using the Brunauer–Emmett–Teller (BET) theory.b Micropore surface area (Smic).c External surface area (Sext) and.d Micropore volume (Vmic) were evaluated by the t-plot method.e External volume.f Total pore volume (Vtot) was determined from the amount of N2 adsorbed at P/P0 of ∼0.95.g Boehm's titration.h pHpzc: point of zero charge.
SBETa (m2 g−1) 745.68 1040.36 1775.01
Smicb (m2 g−1) 489.35 471.16 953.42
Sextc (m2 g−1) 256.33 569.20 821.58
Vmicd (cm3 g−1) 0.221 0.213 0.426
Vexte (cm3 g−1) 0.200 0.465 0.736
Vtotf (cm3 g−1) 0.421 0.678 1.162
Carboxylic groupsg (mmol g−1) 0.793 1.098 1.205
Lactonic groupsg (mmol g−1) 0.235 0.127 0.206
Phenolic groupsg (mmol g−1) 0.824 1.762 1.783
Total acidityg (mmol g−1) 1.852 2.987 3.194
pHpzch 4.01 3.50 3.15


The results of Boehm's titrations are given in Table 1. AC-OA and AC-SA contained more acidic groups than AC, indicating that organic acid modification obviously enhanced the surface acidity of ACs. Fixation of the acidic groups on the surface of the AC makes it more hydrophilic and decreases its pH or pHpzc. Obvious differences existed between the amounts of acidic functional groups of ACs, confirming the observed pHpzc existed within the acidic range. AC-SA contained notably largest amount of acidic groups. The amounts of acidic groups on the surfaces of the three ACs were as follows: phenolic > carboxylic > lactonic. Fig. 3 shows the C 1s and O 1s peaks of the ACs. This shows that the C 1s could be fitted to three curves: C–C or C–H at 284.78–284.8 eV; C–O in alcohol, phenol, or ether at 286.34–286.56 eV; and O–C[double bond, length as m-dash]O or C[double bond, length as m-dash]O at 288.31–289.15 eV. The O 1s peak could be fitted to three curves: –C[double bond, length as m-dash]O at 531.15–531.33 eV; C–OH or C–O–C at 532.96–532.99 eV; chemisorbed oxygen (carboxylic groups) and/or water at 535.28–536.03 eV. The fitting parameters of C 1s and O 1s curves are calculated and shown in Table 2. According to Table 1, the acidic group values of AC, AC-OA and AC-SA are 1.852, 2.987 and 3.194 mmol g−1, respectively, which means that modified ACs have more acidic functional groups.


image file: c5ra25200h-f3.tif
Fig. 3 C 1s and O 1s XPS spectra of AC (a and b), AC-OA (c and d) and AC-SA (e and f).
Table 2 Peak numbers and relative contents (RC) of the surface functional groups determined by C 1s and O 1s XPS spectra from samples AC, AC-OA and AC-SA
Samples Peak from C 1s spectrum Peak from O 1s spectrum
Peak 1 Peak 2 Peak 3 Peak I Peak II Peak III
AC
BE (eV) 284.78 286.34 288.31 531.18 533.37 535.31
RC (%) 46.74 14.98 4.34 14.21 49.77 36.02
[thin space (1/6-em)]
AC-OA
BE (eV) 284.79 286.41 289.15 531.15 533.28 535.28
RC (%) 51.28 16.36 5.77 10.88 61.39 27.73
[thin space (1/6-em)]
AC-SA
BE (eV) 284.8 286.56 288.75 531.33 533.45 536.03
RC (%) 54.95 14.48 6.35 21.76 48.40 29.84


3.3. Adsorption kinetics

Adsorption is a time-dependent process and it is important to predict the removal rate of contaminants from aqueous solution. Fig. 4a shows the effect of contact time on the RhB adsorption by ACs. The adsorption capacities of RhB onto the three carbons increase rapidly in the first 50 min and thereafter gradually increase until they reach equilibrium. The fast adsorption during the initial stage may be due to the fact that the higher driving force enables the fast transfer of RhB to the surfaces of adsorbent particles. After a period of time, the adsorption becomes difficult because the number of vacant sites decreases and a repulsive force forms between the solute molecules on the solid surface and in the bulk phase.27 It is worth noting that the maximum adsorption capacity was achieved within 60 min for all ACs, indicating that the ACs could be desirable adsorbents for wastewater treatment plant applications. Furthermore, it can be observed that the modified ACs (AC-OA and AC-SA) had higher RhB adsorption capacities than the unmodified carbon (AC).
image file: c5ra25200h-f4.tif
Fig. 4 (a) Effect of contact time for RhB adsorption on AC, AC-OA, and AC-SA (b) intra-particle diffusion plots for RhB onto activated carbons (dosage = 0.6 g L−1, temperature = 25 ± 1 °C, initial pH = 4.00 ± 1, time = 12 h).

The adsorption kinetics are usually used to describe the solute uptake rate on the adsorbent and the possible mechanism of adsorption. Pseudo-first order,28 based on solid capacity, is defined as:

 
ln(QeQt) = ln[thin space (1/6-em)]Qek1t (3)

Pseudo-second order29 predicts the behavior over the whole range of adsorption and is represented by:

 
image file: c5ra25200h-t2.tif(4)

The Elovich kinetic equation30 is one of the most useful models describing chemisorption processes and is given by:

 
image file: c5ra25200h-t3.tif(5)
where Qe and Qt (mg g−1) are the amount of RhB adsorbed on the adsorbents at equilibrium and at time t, respectively; k1 (min−1) and k2 (mg min) are the pseudo-first-order and pseudo-second-order rate constants, respectively; a (mg g−1 h) is the initial sorption rate and b (g mg−1) is related to the extent of surface coverage and the activation energy for chemisorption. Table 3 shows the parameters of pseudo-first order, pseudo-second order and Elovich kinetic models for the adsorption of RhB onto ACs. Obviously, the pseudo-second order model yielded the best fit, with highest correlation coefficients (R2 > 0.99). This suggests that the overall rate of the adsorption process was controlled by chemisorption, which involves valence forces through electron sharing between the adsorbent and adsorbate. Accordingly, it was found that the internal and external surfaces of the porous carbons were easily accessible to RhB.

Table 3 Parameters of kinetics models and intra-particle diffusion model for the adsorption of RhB onto activated carbons
Kinetic models Parameter Activated carbons
AC AC-OA AC-SA
Pseudo-first order parameters Qe,exp (mg g−1) 417.1 550.9 629.8
Qe,cal (mg g−1) 287.5 247.4 331.7
k1 (min−1) 0.0048 0.0046 0.005
R2 0.9570 0.8755 0.9443
Pseudo-second order parameters Qe,cal (mg g−1) 434.8 500.0 526.3
k2 (g mg−1 min−1 10−4) 0.8802 1.754 1.249
R2 0.9975 0.9991 0.9978
Elovich kinetic parameters a 80.05 1445.92 1193.85
b 0.016 0.017 0.015
Qe,cal (mg g−1) 420.36 565.17 617.44
R2 0.9911 0.9890 0.9919
Intra-particle diffusion parameters kp1 (mg g−1 min−1/2) 44.807 54.83 43.012
C1 0.0738 142.73 188.67
(R1)2 0.9851 0.9995 0.9719
kp2 (mg g−1 min−1/2) 15.095 23.173 14.529
C2 139.48 248.93 349.94
(R2)2 0.9860 0.9718 0.9805
kp3 (mg g−1 min−1/2) 3.8467 3.3717 5.3155
C3 317.27 460.93 495.38
(R3)2 0.9700 0.9734 0.9736


As the above kinetic models were not able to identify the diffusion mechanism, the intra-particle diffusion model31 found a functional relationship common to most adsorption processes. According to this theory:

 
Qt = kpit1/2 + Ci (6)
where kpi (mg (g min1/2)−1) is the intra-particle diffusion rate constant and Ci is the thickness of the boundary layer. Fig. 4b shows the intra-particle plot for RhB onto ACs. It was evident that the adsorption process follows three steps, indicating a multi-stage adsorption processes. The diffusion parameters of each region are shown in Table 3. Each step can be identified by a change in the slope of the linear line used to fit the experimental data. These results could be illustrated as follows: the first region was very sharp and indicated rapid attachment of RhB molecules to the external surface of the ACs. The second linear region was the gradual adsorption stage in which intra-particle diffusion was the rate-limiting step. The third region shows the final equilibrium stage wherein RhB diffusion was very slow due to its low concentration. It can be observed that the linear lines of the second and the third stage do not pass through the origin. Therefore, intra-particle diffusion was not the only rate limiting-step and chemisorption or physisorption may also be involved in the process.27

3.4. Adsorption isotherms

The equilibrium isotherms in this study were analyzed using the Langmuir, Freundlich and Temkin isotherms. The Langmuir isotherm theory32 assumes monolayer coverage of adsorbate over a homogenous adsorbent surface and is represented by:
 
image file: c5ra25200h-t4.tif(7)

The Freundlich isotherm33 is an empirical equation assuming that the adsorption process occurs on heterogeneous surfaces and is given by:

 
image file: c5ra25200h-t5.tif(8)

Temkin and Pyzhev considered the effects of some indirect adsorbate/adsorbate interactions on adsorption isotherms and suggested that because of these interactions the heat of adsorption of all the molecules in the layer would decrease linearly with coverage.1 The Temkin isotherm has been used in the following form:

 
image file: c5ra25200h-t6.tif(9)
 
image file: c5ra25200h-t7.tif(10)
where qe (mg g−1) is the amount of RhB adsorbed by ACs at equilibrium; Ce (mg L−1) is the equilibrium concentration of RhB; qm is the maximum amount of RhB that forms a complete monolayer on the adsorbents surface; KL is the adsorption equilibrium constant (L mg−1). KF (mg1−1/n L1/n g−1) and n are Freundlich constants, representing the adsorption capacity of the adsorbent and the adsorption intensity, respectively. A (g−1) and B are Temkin constants. The relative parameters calculated from the isotherm models are shown in Table 4. The adsorption isotherms for ACs along with the non-linear fit of experimental data are presented in Fig. 5. The Langmuir model fitted the data better than the Freundlich and Temkin model with higher R2, implying that RhB adsorption on ACs was a monolayer adsorption and of uniform adsorption. The observed KL values show that the adsorbent prefers to bind acidic ions and that speciation predominates among sorbent characteristics when ion exchange is the predominant mechanism occurring in the adsorption of RhB. Li et al. also reported the sorption of RhB onto carbon prepared from scrap tires, in which the equilibrium experimental data were better fitted to a Langmuir isotherm.34

Table 4 Langmuir, Freundlich and Temkin isotherm constants for RhB adsorption onto activated carbons
Isotherm models Constants Activated carbons
AC AC-OA AC-SA
Langmuir KL (L mg−1) 0.0745 0.1545 0.2542
qm (mg g−1) 417.3 550.2 629.7
R2 0.9981 0.9980 0.9982
Freundlich KF (mg g−1 (L mg−1)1/n) 220.6 326.4 386.1
1/n 0.1014 0.1063 0.0963
R2 0.9770 0.9834 0.9862
Temkin A (L g−1) 226.32 595.33 4074.8
B 35.275 48.664 46.58
R2 0.9697 0.9887 0.9862


image file: c5ra25200h-f5.tif
Fig. 5 Adsorption isotherms of RhB onto activated carbons. Solid lines represent the Langmuir isotherms, dashed lines represent the Freundlich isotherms and dotted lines represent the Temkin isotherms (dosage = 0.6 g L−1, temperature = 25 ± 1 °C, initial pH = 4.00 ± 1, time = 12 h).

3.5. Effect of initial pH and ion strengths

Solution pH would affect both aqueous chemistry and surface binding sites of the adsorbent. The effect of pH on the adsorption of RhB by ACs is presented in Fig. 6a and b. The effect of pH on RhB removal was studied by adjusting the initial pH from 2.0 to 12.0 with 0.1 M HCl or NaOH. The pH values of solutions after the sorption experiments are shown in Fig. 6a. The final equilibrium pH values became lower after the adsorption of RhB. Furthermore, the final pH values of AC-OA and AC-SA were lower than that of AC. One possible reason may be that the acidic functional groups on the surface of ACs are releasing H+ ions into the solution. A similar phenomenon has been reported by Zhang et al.,27 in which the presence of acidic functional groups on the surface was likely to obtain considerable cation exchange capacity to the adsorbents.
image file: c5ra25200h-f6.tif
Fig. 6 (a) The change of pH values after adsorption of RhB. (b) RhB adsorption capacities by the carbons in different pH ranges. (c) Effect of ionic strengths (NaCl) on RhB adsorption (dosage = 0.6 g L−1, temperature = 25 ± 1 °C, time = 12 h).

The equilibrium RhB adsorption capacities of ACs in different pH ranges (Fig. 6b) was first increased from initial pH 2 to 4, reached an approximate maximum at the initial pH 4 and then reduced slowly from initial pH 4 to 10, while decreasing sharply over initial pH 10. The influence of pH on the pronounced sorption of RhB on the surface of ACs at low pH ranges leads to the assumption that chemisorptions dominate in this range and chemisorption along with physisorption occurs at higher pH ranges.13 In addition, it appears that a change in pH of the solution results in the formation of different ionic species (pKa = 3.7)35 and a different carbon surface charge. At pH values lower than 4, RhB ions are of cationic and monomeric molecular form. Thus, RhB can enter into the pore structure. At a pH values from 4 to 10, the zwitterionic form of RhB in water may increase the aggregation of RhB to form a larger molecular form (a dimer) and thus become unable to enter into the pore. At a pH value higher than 10, the OH neutralizes the surface acidic functional groups of the ACs.13,36

Dye-containing wastewater often contains various salts, which lead to high ionic strength and may affect dye adsorption onto adsorbents. Adsorption experiments to evaluate the ionic strength effect were carried out by adding NaCl at different concentrations (0–500 mmol L−1). As shown in Fig. 6c, the amount of RhB absorbed showed only a tiny change on increasing the NaCl concentrations. This implies that adsorption of RhB by ACs was unaffected by ionic strength.

3.6. Adsorption mechanism and capacities

Surface functional groups of AC, AC-OA and AC-SA were investigated using FT-IR spectroscopy in the range of 400–4000 cm−1 (Fig. 7a). After RhB adsorption, the functional groups of ACs were also measured and compared (Fig. 7c). The forms of bands for the three types of ACs were very similar, indicating that ACs have similar functional groups. However, the transmittances of modified carbons (AC-OA and AC-SA) were larger than that of AC, indicating that the amount of the modified carbons was more than that of AC. The bands at 3435 and 1715 cm−1 represented the stretching frequency of the hydroxyl and carboxylic groups. The peaks at 1625 cm−1 may be attributed to the stretching frequency of the asymmetric stretching vibration of –COO; the bands at 1170 and 671 cm−1 correspond to C–O and C–H stretching vibrations. After the adsorption of RhB, some new absorption bands occurred on dye-loaded activated carbons (Fig. 4c), which are due to the pore filling by the adsorbent. The swings of bands at 3435, 1715, 1625, 1170 and 671 cm−1 were smaller than that of before adsorption of RhB, implying that the acidic functional groups could adsorb more RhB species by electrostatic attraction, cation exchange and surface complexation.
image file: c5ra25200h-f7.tif
Fig. 7 . Infrared spectra of (a) activated carbons, (b) RhB and (c) activated carbons after adsorption of RhB.

From Table 1, the SBET and Vtot of AC-OA and AC-SA were higher than those of AC, while modified carbons showed more acidic groups, indicating that the RhB adsorption capacities of AC-OA and AC-SA were much greater than that of AC. However, compared to the porosity, acidity and adsorption capacities of AC, AC-OA and AC-SA, it can be concluded that surface functionality, rather than pore structure, plays a more crucial role in determining the adsorption capacity for RhB.

Table 5 shows the comparison of the maximum adsorption capacities for RhB onto various adsorbents. Although the published values were obtained under different experimental conditions, they may be useful as a criterion for comparing the adsorption capacities. It can be observed that the RhB adsorption capacities of ACs in this study were ultrahigh and larger than other carbon adsorbents.

Table 5 Comparison of the maximum adsorption capacities for RhB onto various adsorbents
Adsorbents Qmax (mg g−1) Reference
AC 417.1 This work
AC-OA 550.9 This work
AC-SA 629.8 This work
Sago waste carbon 16.2 3
Scrap tires activated carbon 307.2 34
Bagasse pith activated carbon 263.85 13
Rice husk-based porous carbon 431.1 37
Modified tannery waste 250.1 38
P.orientale Linn activated carbon 560.0 39
Rice husk-based activated carbon 400.8 40


4. Conclusion

In this study, oxalic acid and succinic acid were employed to modify PA-based ACs during phosphoric acid activation to improve its Rhodamine B removal from aqueous solutions. The prepared ACs exhibited high specific surface area, porosity and acidity. The adsorption capacities are ultra-high and significantly influenced by the contact time and pH value. Adsorption kinetics were found to follow a pseudo-second order kinetic model for the activated carbons. The adsorption equilibrium data were better fitted to the Langmuir model.

Acknowledgements

This study was supported by the Independent Innovation Foundation of Shandong University (2012JC029), the Natural Science Foundation for Distinguished Young Scholars of Shandong Province (JQ201216) and the National Water Special Project (2012ZX07203-004).

References

  1. B. Hameed, J. Hazard. Mater., 2009, 161, 753–759 CrossRef CAS PubMed.
  2. Y. Wong and J. Yu, Water Res., 1999, 33, 3512–3520 CrossRef CAS.
  3. K. Kadirvelu, C. Karthika, N. Vennilamani and S. Pattabhi, Chemosphere, 2005, 60, 1009–1017 CrossRef CAS PubMed.
  4. S.-H. Chang, K.-S. Wang, H.-C. Li, M.-Y. Wey and J.-D. Chou, J. Hazard. Mater., 2009, 172, 1131–1136 CrossRef CAS PubMed.
  5. L. Peng, P. Qin, M. Lei, Q. Zeng, H. Song, J. Yang, J. Shao, B. Liao and J. Gu, J. Hazard. Mater., 2012, 209, 193–198 CrossRef PubMed.
  6. R. Jain, M. Mathur, S. Sikarwar and A. Mittal, J. Environ. Manage., 2007, 85, 956–964 CrossRef CAS PubMed.
  7. J.-H. Huang, K.-L. Huang, S.-Q. Liu, A.-T. Wang and C. Yan, Colloids Surf., A, 2008, 330, 55–61 CrossRef CAS.
  8. K. P. Singh, S. Gupta, A. K. Singh and S. Sinha, Chem. Eng. J., 2010, 165, 151–160 CrossRef CAS.
  9. L. Fan, Y. Zhou, W. Yang, G. Chen and F. Yang, Dyes Pigm., 2008, 76, 440–446 CrossRef CAS.
  10. Y. Anjaneyulu, N. S. Chary and D. S. S. Raj, Rev. Environ. Sci. Bio/Technol., 2005, 4, 245–273 CrossRef CAS.
  11. K. Kadirvelu, M. Kavipriya, C. Karthika, M. Radhika, N. Vennilamani and S. Pattabhi, Bioresour. Technol., 2003, 87, 129–132 CrossRef CAS PubMed.
  12. H. Zhong, Y. Shaogui, J. Yongming and S. Cheng, J. Environ. Sci., 2009, 21, 268–272 CrossRef.
  13. H. M. Gad and A. A. El-Sayed, J. Hazard. Mater., 2009, 168, 1070–1081 CrossRef CAS PubMed.
  14. Z. Guo, X. Bian, J. Zhang, H. Liu, C. Cheng, C. Zhang and J. Wang, J. Taiwan Inst. Chem. Eng., 2014, 45, 2801–2804 CrossRef CAS.
  15. Z. Guo, J. Fan, J. Zhang, Y. Kang, H. Liu, L. Jiang and C. Zhang, J. Taiwan Inst. Chem. Eng., 2016, 58, 290–296 CrossRef CAS.
  16. P. Chingombe, B. Saha and R. Wakeman, Carbon, 2005, 43, 3132–3143 CrossRef CAS.
  17. R. Reit, J. Nguyen and W. J. Ready, Electrochim. Acta, 2013, 91, 96–100 CrossRef CAS.
  18. H. Liu, J. Zhang, W. Liu, N. Bao, C. Cheng and C. Zhang, Mater. Lett., 2012, 87, 17–19 CrossRef CAS.
  19. H. Liu, X. Wang, G. Zhai, J. Zhang, C. Zhang, N. Bao and C. Cheng, Chem. Eng. J., 2012, 209, 155–162 CrossRef CAS.
  20. Y. Wang, H. Ngo and W. Guo, Sci. Total Environ., 2015, 533, 32–39 CrossRef CAS PubMed.
  21. J. Laine and A. Calafat, Carbon, 1989, 27, 191–195 CrossRef CAS.
  22. H. Teng, T.-S. Yeh and L.-Y. Hsu, Carbon, 1998, 36, 1387–1395 CrossRef CAS.
  23. K. Sreejalekshmi, K. A. Krishnan and T. Anirudhan, J. Hazard. Mater., 2009, 161, 1506–1513 CrossRef CAS PubMed.
  24. H. Liu, S. Liang, J. Gao, H. H. Ngo, W. Guo, Z. Guo, J. Wang and Y. Li, Chem. Eng. J., 2014, 246, 168–174 CrossRef CAS.
  25. H. Boehm, Carbon, 1994, 32, 759–769 CrossRef CAS.
  26. B. Babić, S. Milonjić, M. Polovina and B. Kaludierović, Carbon, 1999, 37, 477–481 CrossRef.
  27. G. Zhang, L. Shi, Y. Zhang, D. Wei, T. Yan, Q. Wei and B. Du, RSC Adv., 2015, 5, 25279–25286 RSC.
  28. W. J. Weber and J. C. Morris, J. Sanit. Eng. Div., Am. Soc. Civ. Eng., 1963, 89, 31–60 Search PubMed.
  29. Y.-S. Ho and G. McKay, Process Biochem., 1999, 34, 451–465 CrossRef CAS.
  30. C. Aharoni and F. Tompkins, Adv. Catal., 1970, 21, 1–49 CAS.
  31. Z. Guo, L. Xu, C. Liu, F. Sun, Y. Kang and S. Liang, Desalin. Water Treat., 2015, 1–11 Search PubMed.
  32. I. Langmuir, J. Am. Chem. Soc., 1918, 40, 1361–1403 CrossRef CAS.
  33. H. Freundlich, J. Phys. Chem., 1906, 57, e470 Search PubMed.
  34. L. Li, S. Liu and T. Zhu, J. Environ. Sci., 2010, 22, 1273–1280 CrossRef CAS.
  35. S. Merouani, O. Hamdaoui, F. Saoudi and M. Chiha, Chem. Eng. J., 2010, 158, 550–557 CrossRef CAS.
  36. B. Hameed, J. Hazard. Mater., 2008, 154, 204–212 CrossRef CAS PubMed.
  37. Y. Guo, J. Zhao, H. Zhang, S. Yang, J. Qi, Z. Wang and H. Xu, Dyes Pigm., 2005, 66, 123–128 CrossRef CAS.
  38. J. Anandkumar and B. Mandal, J. Hazard. Mater., 2011, 186, 1088–1096 CrossRef CAS PubMed.
  39. L. Wang, J. Zhang, R. Zhao, C. Li, Y. Li and C. Zhang, Desalination, 2010, 254, 68–74 CrossRef CAS.
  40. L. Ding, B. Zou, W. Gao, Q. Liu, Z. Wang, Y. Guo, X. Wang and Y. Liu, Colloids Surf., A, 2014, 446, 1–7 CrossRef CAS.

Footnote

Electronic supplementary information (ESI) available. See DOI: 10.1039/c5ra25200h

This journal is © The Royal Society of Chemistry 2016
Click here to see how this site uses Cookies. View our privacy policy here.