DOI:
10.1039/C5RA25090K
(Paper)
RSC Adv., 2016,
6, 7817-7828
Anisotropy in lattice thermal conductivity tensor of bulk hexagonal-MT2 (M = W, Mo and T = S and Se) by first principles phonon calculations
Received
26th November 2015
, Accepted 11th January 2016
First published on 14th January 2016
Abstract
Using the phonon spectra obtained from first principles calculations, and a modified empirical phonon–phonon Umklapp scattering expression at high temperature, the anisotropy in thermal conductivity is investigated for four semiconducting transition metal dichalcogenides. Our calculations confirm that the anisotropic thermal conductivity in H-MT2 phases is mainly caused by strong directional dependence of phonon dispersions in a layered crystal. The heavy molecular mass can further increase the anisotropic feature of thermal properties. Acoustic phonon bands play dominate role in total thermal conductivity. It is found that longitudinal acoustic phonon band along provides at least 50% of total heat conductance. Contributions from remaining optical phonons are usually less than 1%. Thermal conductivities in [100] and [001] directions are calculated, and they are compared with other experimental and theoretical results. Our current method underestimates the intrinsic thermal conductivity. However, the large anisotropy in thermal conductivity is successfully captured by this simple and efficient approach.
1. Introduction
Thermal conductivity is a fundamental transport parameter that is commonly used to characterize a broad range of materials. A predictive theory for evaluating thermal conductivity is essential for the designing of advanced materials for efficient thermoelectric materials and power generation,1 and it could also help in understanding heat dissipation in microelectronics and nanoelectronics devices.2 Thermal conductivity in material could arise from both electronic (κe) and lattice (κl) contributions.3–6 In metals, the electronic component is well described by the Wiedemann–Franz law, scaling linearly with the electrical conductivity and temperature. In semiconductors and insulators, heat is mainly carried by the lattice vibrations (phonons) of crystals even at relatively high temperature. Empirical methods are available to estimate phonon thermal conductivity at different temperature regimes, using Debye-like phonon spectrum or only acoustic phonon bands.6–8 Theories about minimum thermal conductivity is well established in crystalline materials. Two exemplary methods are widely used in many studies for thermal barrier coatings, i.e., Cahill's model5 and Clarke's approach.9 Nowadays, computing intrinsic phonon thermal conductivity accurately relies on two different approaches. Solving Boltzmann transportation equation (BTE) approximately is a well-known strategy.10–14 Phonon–phonon Umklapp-process is directly related to phonon life time. The latter parameter of a phonon mode can be calculated from anharmonic phonon spectrum. In the simplest scenario, the lowest anharmonic effect is obtained in a perturbative way. For example, the third order force constants can be calculated from the harmonic ones by finite difference method.11 The harmonic force constants are corrected by anharmonic effects, and then phonon frequencies and lift times are evaluated. However, due to its high computational cost, the method only applied to simple cubic and hexagonal structures recently.10–12 On the other hand, finding the solution of BTE is also numerically expensive and difficult, because the phonon relaxation time has no simple monotonic dependence on temperature even in a single material.15 Therefore, the final solution of BTE is highly nontrivial due to various assumptions made during the calculation. Another approach applies Fourier's law directly to calculate thermal conductivity by using molecular dynamics based on classic force field or more accurate first principles method.16,17 This method seems to be suitable for investigating the heat transfer of complex structures (solid and liquid) at very high temperature and pressure.18,19 Nevertheless, combining first principles phonon calculations with some theoretically less rigorous treatment of phonon–phonon scattering process is still valuable. It may not provide the ultimate numerical accuracy, but it can be used to estimate the thermal conductivity with certain reliability, and it also allows us to gain some physical insights about the phonon transportation in a particular crystal structure.
In this paper, we have developed a fast and efficient method to estimate the phonon thermal conductivity of crystal structure using phonon spectrum. Our method is empirical, because it uses a modified expression for phonon–phonon Umklapp process at high temperature in a principal crystallographic direction. Other phonon scattering sources such as boundary and isotopes can be incorporated in the method by normal relaxation time approximation.
We apply the method to calculate thermal conductivity tensor of several semiconducting transition metal dichalcogenides with hexagonal crystal structures (H-MT2). This is a continuation of our previous work,20 where the phonon related properties have been discussed in detail for the same systems.
2. Computational methods and details
2.1 Structural optimization
All first principles calculations were performed using plane wave basis and projector augmented wave (PAW) method as implemented in Vienna Ab initio Simulation Package (vasp).21–23 For plane wave expansion in reciprocal space, we have used 700 eV for kinetic energy cutoff. The sampling k-points in the Brillouin zone were generated by using a 15 × 15 × 10 gird centered at Γ-point. The standard PBE-type PAW pseudopotentials were employed for all relevant elements, i.e., Mo (4p64d55s1), W (5d46s2), S (3s23p4) and Se (4s24p4). It is known that van der Waals interactions play important role in the equilibrium geometry of layered transition metal dichalcogenides. Therefore, we have tested several non-local van der Waals density functionals (optPBE-vdW,24,25 optB88-vdW,25 optB86b-vdW25 and vdW-DF2)26 to optimize structural parameters of all studied compounds, and their performance was compared to the local density approximation (LDA) and Perdew–Burke–Ernzerhof (PBE) exchange–correlation functional of generalized gradient approximation (GGA) level.27,28 The results are shown in Table 1. Since the overall accuracy of optPBE-vdW is found to be better than other tested density functionals, it was used in the subsequent phonon calculations.
Table 1 The calculated lattice constants (Å) of H-MT2 structures by different exchange–correlation functionals. The results are compared to experimental values and our previous study using local density approximation
| Method |
H-MoS2 |
H-MoSe2 |
H-WS2 |
H-WSe2 |
| a |
c |
a |
c |
a |
c |
a |
c |
| LDA |
3.1248 |
12.0755 |
3.2495 |
12.7390 |
3.1245 |
12.0653 |
3.2494 |
12.8196 |
| PBE |
3.1830 |
13.8316 |
3.3160 |
14.8740 |
3.1818 |
14.3310 |
3.3172 |
14.8783 |
| optPBE-vdW |
3.1786 |
12.1190 |
3.3116 |
12.8132 |
3.1833 |
12.2209 |
3.3145 |
12.9037 |
| optB88-vdW |
3.1732 |
11.9920 |
3.3003 |
12.6723 |
3.1756 |
12.0756 |
3.3021 |
12.7515 |
| optB86b-vdW |
3.1449 |
11.8941 |
3.2715 |
12.5913 |
3.1500 |
11.9893 |
3.2753 |
12.6737 |
| vdW-DF2 |
3.2588 |
12.2864 |
3.4090 |
13.0614 |
3.2589 |
12.3684 |
3.4085 |
13.1086 |
| Expt20 |
3.1622 |
12.3024 |
3.2900 |
12.9360 |
3.1540 |
12.3620 |
3.2774 |
12.9467 |
| Ref. 20 |
3.1789 |
12.2469 |
3.2838 |
12.9526 |
3.1454 |
12.2181 |
3.2675 |
12.9381 |
2.2 Phonon calculations
The finite displacement method was applied to calculate phonon spectra. Using the Phonopy program,29 a 2 × 2 × 2 supercell with 48 atoms was created to compute the atomic forces in vasp program. Due to the high symmetry of hexagonal-MT2 structure (point group: D6h), only three displacement patterns were required to obtain the full set of force constants. The k sampling points used for supercell were created by a 5 × 5 × 3 Γ-point centered grid. The kinetic energy cutoff value was the same as that of structural optimizations. For computing atomic forces, we employed very tight convergence criterion, i.e., 1.0 × 10⁻⁸ eV per cell for total energy and 1.0 × 10⁻³ eV Å−1 for force. For each H-MT2 structure, phonon spectra in [100] and [001] crystallographic directions were calculated using Phonopy program. Computing thermal conductivity requires very dense k-gird in each principal direction, we interpolated the phonon dispersion in a particular direction using 200 k-points in the same program.
2.3 Thermal conductivity tensor
There are only two none-zero diagonal components in the thermal conductivity tensor of D6h symmetry, i.e., κxx and κzz. Total thermal conductivity of H-MT2 structure is simply given as
From the normal phonon kinetic theory, the total thermal conductivity can be obtained from eqn (2).
| |
 | (2) |
Where,
CV(
ω,
T) is the mode specific heat at temperature
T,
vg(
ω) represents the phonon group velocity,
g(
ω) refers to the properly normalized phonon density of states or the degeneracy of a particular phonon frequency, and the relaxation time is given by
τ(
ω,
T); finally, the phonon angular frequency is denoted by
ω in the expression. We should note that in
eqn (2), the temperature dependence comes from
CV(
ω,
T) and
τ(
ω,
T) only, and which is true for harmonic phonons. Regarding the phonon spectrum of real crystal at finite temperature, the phonon frequency itself has dependence on temperature in terms of phonon lifetime due to the phonon–phonon interactions. In this paper, we evaluate the thermal conductivity by using harmonic phonon spectrum only. In a principal Cartesian direction,
eqn (2) is rewritten as
| |
 | (3) |
here,
κii refers to thermal conductivity tensor in a particular principal direction; the phonon branch is indicated by Greek letter
α;
N is the total number of atoms in the modelling cell, thus 3
N phonon dispersion curves are expected. In our calculation, we have used finite number of
k points in the first irreducible Brillouin zone,
i.e., 200
k points in each phonon dispersions. Thus, the modified version of
eqn (3), which is given by
eqn (4), was employed in actual calculations.
| |
 | (4) |
In eqn (4), the outer summation goes over all 3N phonon branches in a principal crystallographic direction, and the inner summation runs over all Mk evaluated k-points in each phonon branch for ω(k). Since, the summations are only carried out in the first irreducible Brillouin zone, we must consider the weight of each k point used in the calculation as indicated by function W(ωiiα,β). The total weight should be normalized to unity.
| |
 | (5) |
The weight of a k point is relevant to its degeneracy, and the latter property is defined by the k wave vector point group. We use ISOTROPY program to determine both properties for all sampled k points.30 In Table 2, we show the fractional coordinates, wave vector point group and degeneracy of several representative k points in [100] and [001] directions for a hexagonal crystal with point group D6h. M, Γ, and A are three special points, and Σ represents a general k-path in [100] direction on Γ–M path. Similarly, Δ is on Γ–A path in [001] direction. The weight of a high symmetry k point is smaller than a general k point due to its high degeneracy in the first irreducible Brillouin zone. As the number of sampled k points (Mk) goes to large, the weight of each k point is roughly given by 1/Mk.
Table 2 Sampled k points in the first irreducible Brillouin zone. The k coordinates, symmetry property, degeneracy and weight are given for each of them. For Σ and Δ, x and z are numbers between 0 and 1
| Symbol |
Coordinates |
k-point group |
k-star branch |
Degeneracy |
| M |
(π/a 0 0) |
D2h |
3 |
8 |
| Σ |
(πx/a 0 0) |
C2v |
6 |
4 |
| Γ |
(0 0 0) |
D6h |
1 |
24 |
| Δ |
(0 0 πz/c) |
C6v |
2 |
12 |
| A |
(0 0 π/c) |
D6h |
1 |
24 |
In eqn (4), once the phonon spectrum is obtained, the phonon velocity (phase and group velocities) and mode specific heat can be calculated easily in a principal direction. In our previous work, we have addressed computational details for those parameters.20 Therefore, further discussion is omitted in this paper.
2.4 Relaxation time approximation
The main difficulty of applying eqn (4) to calculate thermal conductivity is attributed to the estimation of the total relaxation time τ(ω,T). In the relaxation time approximation (RTA), different phonon scattering processes are decoupled from each other, and total relaxation time is simplify calculated by the normal parallel law of resistance.7 In our paper, we have considered three different phonon relaxation times, including Umklapp scattering, boundary scattering and isotope scattering. The total relaxation time is given by| |
 | (6) |
here, τU(ω,T) refers to Umklapp phonon–phonon scattering, and which has the strong dependences on both phonon frequency ω and temperature T; the phonon-boundary scattering τB(ω) and phonon-isotope scattering τS(ω) are explicitly determined by phonon frequency. The normal phonon–phonon scattering (or N-process) is not considered in current method, because it is not important at high temperature.7 Although various expressions are available for U-process at different temperature ranges, it is expected to show 1/T behavior above room temperature.7,15 In ref. 31, a universal expression for phonon–phonon Umklapp relaxation at high temperature has been discussed. In an earlier work,32 the similar expression was derived for complex dielectric crystal with like atoms. We are also aware that Tomas and coworkers15,33 have employed a different formulation for phonon–phonon U-process, involving two important input parameters, i.e., Debye temperature and Umklapp extinction temperature. The latter quantity has to be estimated empirically from phonon dispersion near the edge of Brillouin zone. Our tests showed that the expression used in ref. 15 must be applied together with other scattering processes such as boundary and isotope scattering mechanisms. Applying it along to calculate the intrinsic thermal conductivity results in a significant overestimation of its value by several orders of magnitude, compared to experiments or other theoretical studies. Therefore, it is not considered further in this work. Additionally, in our calculation, we are intended to eliminate the number of empirical parameters as fewer as possible. Therefore, we proposed a modified version of the universal phonon–phonon Umklapp scattering expression given in ref. 31. Our formulation for Umklapp scattering is given by| |
 | (7) |
here, M is the total mass of the cell, and which is related to averaged mass ![[M with combining macron]](https://www.rsc.org/images/entities/i_char_004d_0304.gif) in original expression by N ×
in original expression by N × ![[M with combining macron]](https://www.rsc.org/images/entities/i_char_004d_0304.gif) , where, N is the total number of atoms in the cell; a represents the lattice constant of cell in a principal direction, and it has the same dimension as the V1/3 in the original equation; the phonon phase velocity vp(ω) and group velocity vg(ω); γ(ω) is phonon mode-Grüneisen parameter; kB is Boltzmann constant. We should note that ratio M/a is a constant when varying the size of modeling supercell. Thus, ensuring the relaxation time has no dependence on supercell dimension. The scaling constant λ might be determined from physical properties of a crystal structure, and which is served as an adjustable parameter to improve the agreement between theoretical prediction and experiments.33 In this paper, it is treated as a constant, and we use λ = 1.9488, the same as ref. 31. From eqn (7), we can see the anisotropy in thermal conductivity has a complicated origination, i.e., coming from the properties of phonons and structural details (M and a).
, where, N is the total number of atoms in the cell; a represents the lattice constant of cell in a principal direction, and it has the same dimension as the V1/3 in the original equation; the phonon phase velocity vp(ω) and group velocity vg(ω); γ(ω) is phonon mode-Grüneisen parameter; kB is Boltzmann constant. We should note that ratio M/a is a constant when varying the size of modeling supercell. Thus, ensuring the relaxation time has no dependence on supercell dimension. The scaling constant λ might be determined from physical properties of a crystal structure, and which is served as an adjustable parameter to improve the agreement between theoretical prediction and experiments.33 In this paper, it is treated as a constant, and we use λ = 1.9488, the same as ref. 31. From eqn (7), we can see the anisotropy in thermal conductivity has a complicated origination, i.e., coming from the properties of phonons and structural details (M and a).
The boundary scattering usually refers to either the grain boundary or finite system size. Here, we employed the second definition, and treated it as the effective size of a testing sample. The relaxation time due to the boundary scattering is well-known,15,31 and which is written as
| |
 | (8) |
where,
d is the effective size of the sample, and group velocity is considered to be dependent on phonon frequency. In a simplified approximation such as Debye model, group velocity is simply computed from mechanical moduli and density of a material.
The last phonon scattering mechanism is caused by the point defects in the crystal structure. In real material, the possible candidates for point defect are very diverse. For pure single crystalline material, the most common type is the substitutional defect introduced by natural isotopes. The phonon–phonon relaxation time of point defect is usually given by eqn (9).31,34
| |
 | (9) |
| |
 | (10) |
Where,
V is the volume per atom, and which is given by
Vcell/
N;
CS is a characteristic constant of point defect;
fi refers to the fraction of atom
i with mass
mi and radius
ri that occupies a lattice site in the crystal structure; the average mass and average atomic radius of that lattice site are denoted as
![[m with combining macron]](https://www.rsc.org/images/entities/i_char_006d_0304.gif)
and
![[r with combining macron]](https://www.rsc.org/images/entities/i_char_0072_0304.gif)
. Obviously, for isotopes, we have
![[r with combining macron]](https://www.rsc.org/images/entities/i_char_0072_0304.gif)
=
ri, and
![[m with combining macron]](https://www.rsc.org/images/entities/i_char_006d_0304.gif)
=
mifi. The fraction
fi can be understood as the natural abundance of
ith isotope. For crystal structure with two or more elements, one must use
eqn (9) and
(10) to calculate
τS(
ω) for each element, and total relaxation time of point defects is obtained in the way similar to
eqn (6). For H-MT
2 structures, the atomic weight, atomic radius and natural abundance of an isotope are provided in
ref. 35. The computed impurity constant
CS for each element is shown in
Table 3.
Table 3 Impurity constant for different elements in H-MT2 structures
| Property |
Mo |
W |
S |
Se |
| CS (×10−4) |
209.6649 |
0.6967 |
1.6833 |
4.6276 |
2.5 Calculation of thermal conductivity
After obtaining the phonon dispersions in a principal crystallographic direction, our implementation of eqn (4)–(10) is straightforward. Since, no iteration is involved in the computation, a simple test can be done in less than one minute between 100 K and 1200 K for H-MT2 structure. Besides phonon spectrum, all other phonon properties and thermal conductivity were calculated using home-made programs. Our post-processing programs have an interface with Phonopy outputs.
3. Results and discussions
3.1 Anisotropic phonon related properties
In order to illustrate the anisotropy in phonon relaxation times of H-MT2 structure, we calculate the phonon spectrum, mode Grüneisen parameter, phonon velocities, and phonon mean free paths (MFPs) of different scattering processes in [100] and [001] directions. The MFPs are evaluated at room temperature (300 K). The results for H-MoS2 are displayed in Fig. 1 and 2 in [100] and [001] directions, respectively. Other investigated structures like H-MoSe2, H-WS2 and H-WSe2, their plots are quite similar to Fig. 1 and 2 in the corresponding direction. In our previous work,20 we have already discussed the strong directional dependence of phonon properties in those two principal crystallographic directions of H-MT2 structure. The strong anisotropies in mode-Grüneisen parameters, phonon velocities and phonon mean free path are inherited from the strong directional dependence of phonon spectrum in those layered materials. The phonon spectrum is more dispersive in [100], because the intra-layer bonding is mainly covalent. Meanwhile, since the inter-layer is completely bound by weak van der Waals interactions, the phonon bands in [001] direction are rather flat, compared to those of [100] direction. For the computed mode-Grüneisen parameter, optical modes show smaller values than low frequency acoustic branches except the two lower-laying optical dispersions. At the Γ point, the two low-frequency optical modes are usually referred to shearing mode (Γ+5) and compression mode (Γ+3).20,36 Their frequencies are very sensitive to the change of cell volume, as implied by large mode-Grüneisen parameters associated with them. Additionally, those two phonon bands intercross with three acoustic phonons in Brillouin zone. As discussed in ref. 31, phonon band intercrossing is an effective mechanism to significantly reduce phonon phase velocity locally, thus, it is considered as a desired feature in designing low thermal conductivity materials. The calculated phonon phase velocity of H-MoS2 is consistent with this suggestion. As shown in Fig. 1, we can see the decreasing of phase velocity at the band intercrossing frequency. This feature is less obvious in [001] than that of [100], because there is only one band crossing point in the former direction. Regarding the computed phonon velocities, the anisotropy is strong in H-MT2 structures. Both phase and group velocities are delocalized in frequency space in [100] direction. Otherwise, they are highly localized in [001] direction due to weak dispersive phonon bands. The frequency dependence of MFP is also calculated and illustrated in Fig. 1 and 2 at 300 K. According to the current theory of minimum thermal conductivity, phonon MFP has its lower limit value as the interatomic distance in the crystal structure.5 Usually, the order of magnitude of inter-atomic distance is roughly 10−10 m or 1 Å. This minimum MFP is indicated as vertical dashed lines in the same figures. However, applying eqn (7)–(10) to H-MoS2 in an actual calculation, the computed MFP of a phonon mode could be many orders of magnitude smaller than the theoretical limit. One way to rationalize the current results is all phonon modes that correspond to those MFPs do not contribute to thermal conductivity at all. Phonon transportation due to those modes is completely suppressed if one only considers a particular scattering mechanism along. The rule is even strict for total MFP, for mode ω, any phonon scattering process gives a MFP smaller than interatomic distance does not contribute to thermal conductivity. A direct consequence of our interpretation is optical phonons are not important for thermal transportation, and their contribution is negligible at most temperatures, especially in the case of isotope scattering is included in the total MFP. In other words, low-frequency acoustic phonons dominant the heat transfers in crystalline material. As shown in Fig. 1(d) and 2(d), the MFPs near Γ point is quite large. The total MFP in the same region is mainly determined by Umklapp-process which has the smallest value among the three scattering processes. Boundary scattering is very effective for decreasing MFP when system has a small size. MFP of boundary scattering is trivial, and its value is the same as the size of system (see eqn (8)). In our calculations, we simply assume the effective size of the system is 1 mm. The total phonon mean free path as a function of temperature (T) is calculated from phonon modes by eqn (11).| |
 | (11) |
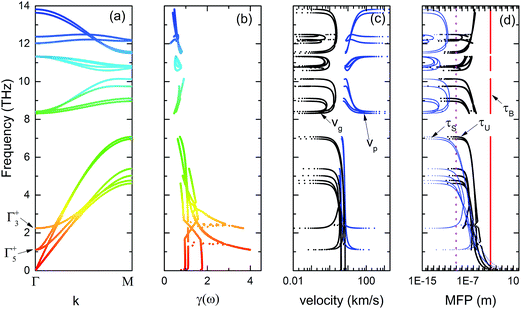 |
| | Fig. 1 The calculated phonon relevant properties and mean free paths (MFPs) of different phonon scattering processes at 300 K for H-MoS2. (a) Phonon spectrum in [100] direction; (b) mode-Grüneisen parameter in the same direction; (c) phonon phase (vp) and group (vg) velocities; (d) phonon mean free paths of isotopes (τS), boundary (τB) and Umklapp-process (τU). In graph (a) two lower-laying optical modes are indicated by their irreducible representations at Γ point. The vertical dashed line in graph (d) refers to the lower limit of MFP, and which is equivalent to average inter-atomic distance in crystal structure (∼10−10 m or 1 Å). | |
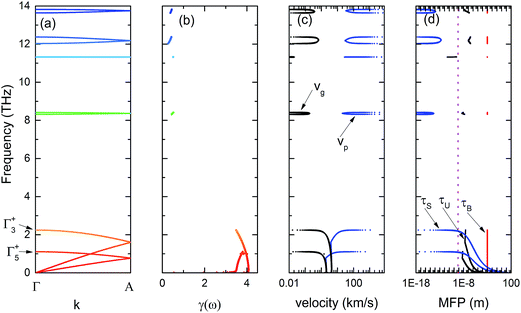 |
| | Fig. 2 The same as Fig. 1, but all properties are shown in [001] direction for H-MoS2. (a) Phonon spectrum; (b) mode-Grüneisen parameter; (c) phonon velocities (vp and vg); (d) relaxation times of boundary, isotope and Umklapp scattering mechanisms. | |
In Fig. 3, we show the calculated MFPs of H-MoS2 in [100] and [001] directions. The total MFPs in both directions are in the range between 104 nm and 102 nm below room temperature (300 K), and which are comparable to the typical grain size in the crystalline material. Phonon MFPs can be as big as 100 μm below 200 K. We consider the very large MFP at low temperature is artificial, because eqn (7) is only approximately correct at high temperature. Obviously, owning to the layered structure of H-MoS2, the values in [100] direction are larger than those in [001] direction at all temperatures. It is found that isotope scattering can bring down thermal conductivity greatly below 20 K in most materials.7,33 From Fig. 3, we find this scattering process affects the phonon MFPs slightly in two principal directions above 100 K. It is actually negligible in [001] direction. Boundary scattering is rather effective to reduce MFPs in all directions. For H-MoS2, the total MFP in [001] direction is fairly close to that of τU(ω,T) + τB(ω), because τU(ω,T) ≈ τS(ω) + τU(ω,T). Finally, we also calculate MFPs of all studied H-MT2 structures in [100] and [001] directions due to Umklapp-process, and the results are displayed in Fig. 4. Clearly, the heavy molecular mass of H-WSe2 or H-MoSe2 enhances the anisotropy in phonon MFPs of [100] and [001] directions. Among the four compounds, H-WSe2 is expected to give smallest thermal conductivity. The predicted phonon MFPs shown in Fig. 4(d) supports the conjecture. In summary, the structural anisotropy and large molecular mass in H-MT2 compounds are the main reasons for their strong anisotropy in thermal transportation.
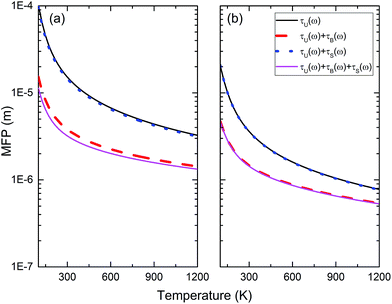 |
| | Fig. 3 Phonon mean free paths of H-MoS2 due to different scattering processes are calculated between 100 K and 1200 K. (a) [100] direction; (b) [001] direction. | |
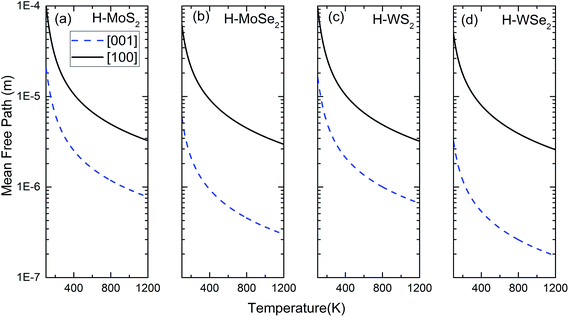 |
| | Fig. 4 The phonon Umklapp MFPs of four H-MT2 structures between 100 K and 1200 K in [100] and [001] directions. (a) H-MoS2; (b) H-MoSe2; (c) H-WS2; (d) H-WSe2. | |
3.2 Thermal conductivity tensors
Using the computed phonon MFPs, the temperature dependence of thermal conductivity in a principal direction can be easily obtained. Moreover, the anisotropy in thermal conductivity tensor as a function of temperature is also revealed. At first, we would like to show the thermal conductivities in [100] and [001] directions due to Umklapp-process in Fig. 5. The value computed in this way is also known as intrinsic thermal conductivity. For all H-MT2 structures, κxx is significantly larger than κzz. At the highest temperature considered in the calculation (1200 K), κxx has a magnitude of 1–2 W m−1 K−1. Meanwhile, κzz drops below 0.5 W m−1 K−1. Besides Umklapp-process, assuming the size of single crystal is 1 mm, and also including isotope scattering mechanism, the calculated thermal conductivity components are depicted in Fig. 6. As we have discussed in previous section, the total thermal conductivity is decreased a lot by boundary effect. In [100] direction, there is roughly 10 times reduction of thermal conductivity below 200 K by boundary scattering. The effect is less significant in [001] direction due to the small phonon–phonon Umklapp MFP. At high temperature, boundary scattering is less important, because phonon MFP is mostly determined by Umklapp-process only. We calculate the ratio κxx/κzz to indicate the anisotropy in thermal conductivity tensor. The results are shown in Fig. 7 for two cases, i.e., Umklapp-process and all three scattering sources combined. Without considering boundary scattering, the ratio κxx/κzz has weak dependence on temperature, and which is almost a constant in the whole temperature range for a particular H-MT2 structure. The results shown in Fig. 7(a) suggests that the heavier the total molecular mass, the bigger the ratio κxx/κzz is. On the other hand, Fig. 7(b) implies boundary scattering tends to impede the ratio κxx/κzz at all temperatures, but the effect is strong at lower temperature.
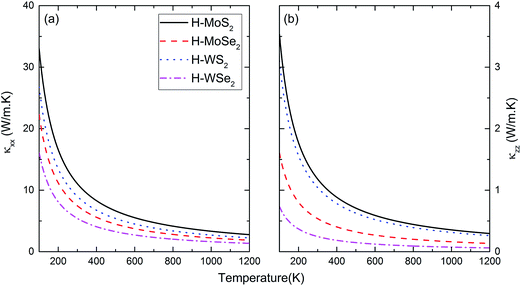 |
| | Fig. 5 The intrinsic thermal conductivity of H-MT2 structures between 100 K and 1200 K. (a) [100] direction; (b) [001] direction. | |
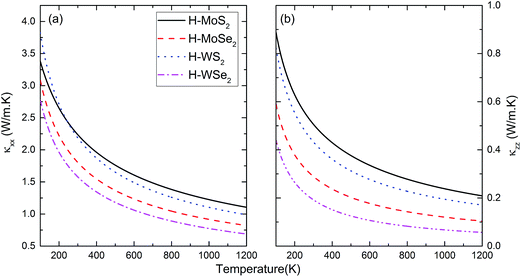 |
| | Fig. 6 The same as Fig. 5, but all three phonon scattering mechanisms are combined. (a) [100] direction; (b) [001] direction. | |
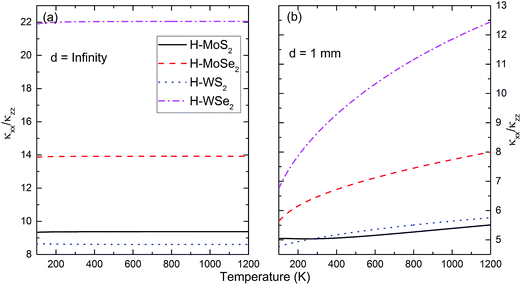 |
| | Fig. 7 The ratio κxx/κzz for H-MT2 is calculated between 100 K and 1200 K. (a) Umklapp process only; (b) all three scattering mechanisms are combined. | |
Finally, we illustrate the anisotropy in thermal conductivity by plotting its value in an arbitrary crystallographic direction using the obtained tensor components. This can be done by employing the following expression.
| |
 | (12) |
For H-MT2 (point group: D6h), eqn (12) is reduced to eqn (13)
| |
 | (13) |
where, the directional cosines
λ11 = sin
![[thin space (1/6-em)]](https://www.rsc.org/images/entities/char_2009.gif) θ
θ![[thin space (1/6-em)]](https://www.rsc.org/images/entities/char_2009.gif)
cos
![[thin space (1/6-em)]](https://www.rsc.org/images/entities/char_2009.gif) φ
φ,
λ12 = sin
![[thin space (1/6-em)]](https://www.rsc.org/images/entities/char_2009.gif) θ
θ![[thin space (1/6-em)]](https://www.rsc.org/images/entities/char_2009.gif)
sin
![[thin space (1/6-em)]](https://www.rsc.org/images/entities/char_2009.gif) φ
φ and
λ11 = cos
![[thin space (1/6-em)]](https://www.rsc.org/images/entities/char_2009.gif) θ
θ in spherical coordinates. The three-dimensional contour plots are illustrated for H-MoS
2 and H-WSe
2 at 300 K and 1000 K in
Fig. 8. The results for other H-MT
2 structures are analogous to
Fig. 8 and which are omitted here.
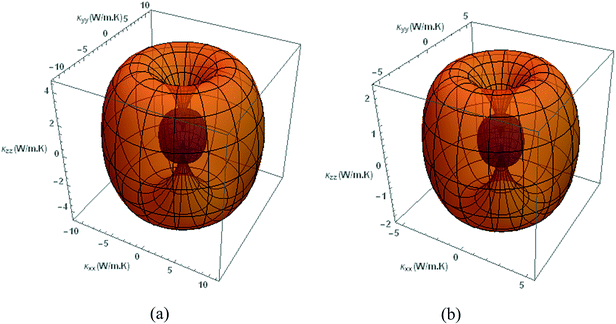 |
| | Fig. 8 Anisotropy in intrinsic thermal conductivity of H-MoS2 and H-WSe2 is shown at two temperatures. The outer-yellow contour represents the value at 300 K, and the inner-blue contour refers to 1000 K. (a) H-MoS2; (b) H-WSe2. | |
Due to the hexagonal symmetry, thermal conductivity at basal plane (x–y plane) is isotropic, and the contour at (10![[1 with combining macron]](https://www.rsc.org/images/entities/char_0031_0304.gif) 0) plane is anisotropic. The value of thermal conductivity approaching [0001] direction decreases rapidly, compared to that of [1000] direction. As a result, one can see a steep dip in the three-dimensional contour in [0001] direction. At (10
0) plane is anisotropic. The value of thermal conductivity approaching [0001] direction decreases rapidly, compared to that of [1000] direction. As a result, one can see a steep dip in the three-dimensional contour in [0001] direction. At (10![[1 with combining macron]](https://www.rsc.org/images/entities/char_0031_0304.gif) 0) plane, thermal conductivity is computed as
0) plane, thermal conductivity is computed as
| |
 | (14) |
where,
θ is the angle between the projected direction and [0001] axis. In analogous to
Fig. 8, we show the results at two temperatures for all H-MT
2 structures in
Fig. 9. Very strong dependence on crystallographic direction is seen in the calculated thermal conductivity at (10
![[1 with combining macron]](https://www.rsc.org/images/entities/char_0031_0304.gif)
0) plane.
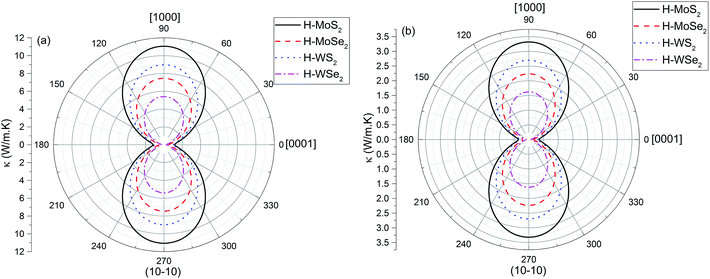 |
| | Fig. 9 Anisotropy in thermal conductivity of H-MT2 structures is shown on (10![[1 with combining macron]](https://www.rsc.org/images/entities/char_0031_0304.gif) 0) plane. (a) 300 K; (b) 1000 K. 0) plane. (a) 300 K; (b) 1000 K. | |
3.3 Thermal conductivity of individual phonon branch
Computing thermal conductivity associated with each phonon dispersion is straightforward using eqn (4). The results can be used to illuminate the importance of an individual phonon branch in heat transfer process. Here, we have done such calculations for U-process only at room temperature (300 K) for illustration purpose. In Fig. 10, the contribution of individual phonon dispersion to total thermal conductivity is depicted in terms of its relative percentage with respect to total value. The total thermal conductivity is mainly attributed to three acoustic phonon bands, i.e., TA1, TA2 and LA. Their total contribution is roughly one order of magnitude larger than other remaining phonon bands. Among three acoustic bands, the longitudinal acoustic band (LA) plays the dominate role in heat transfer. For all investigated H-MT2 structures, the results show that about 50% to 90% of total thermal conductivity is contributed by LA band. The main reason is longitudinal acoustic phonon band has a larger group velocity around Γ point than other two transverse bands. In Fig. 1 and 2, one can see phonon MFPs are extremely long for low-frequency acoustic bands near Γ point. Therefore, one possible strategy to further reduce thermal conductivity in H-MT2 structures is to decrease the longitudinal sound velocity by doping the structure with heavy element. Near the center of Brillouin zone, we have  in [100] direction. Using H-MoS2 as an example, replacing some S atoms by Se may decrease elastic constant C11 (C11 = 234.86 GPa for pure H-MoS2 and 193.80 GPa for H-MoSe2).
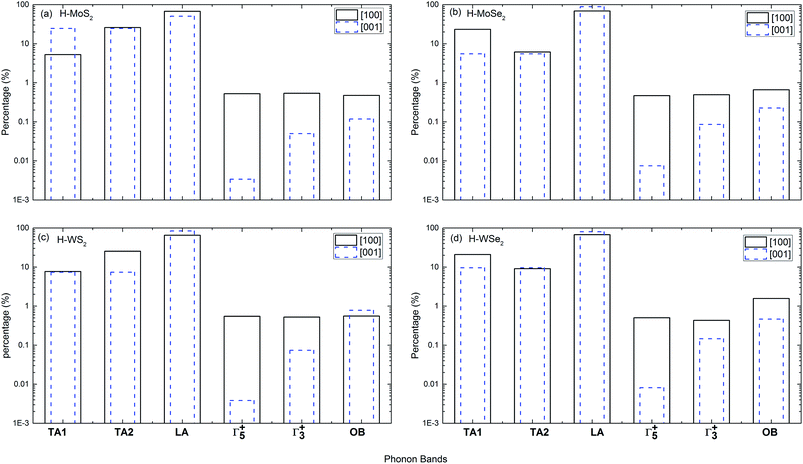 |
| | Fig. 10 The percentages of thermal conductivity associated with different phonon bands for Umklapp-process in [100] and [001] directions at 300 K. (a) H-MoS2; (b) H-MoSe2; (c) H-WS2; (d) H-WSe2. Notations for phonon bands: transverse acoustic band (TA), longitudinal acoustic band (LA), shearing optical band (Γ+5), compression optical band (Γ+3) and remaining 13 optical bands (OB). | |
In H-MT2 structures, two special lower-laying optical bands (Γ+5 and Γ+3) contribute to thermal conductivity differently in [100] and [001] directions. At basal plane, both phonon bands behave similarly to each other in heat transfer process, and the calculated percentages of them are fairly close. In [001] direction, phonon band Γ+5 almost does not carry any heat. Its contribution to total thermal conductivity is negligible. Since Γ+5 and Γ+3 bands have large mode Grüneisen parameter and small phonon group velocity, they play little role in total thermal conductivity for all studied structures. Finally, other 13 remaining optical modes only provide less than 1% of total value. Small group velocity and large frequency of optical bands are the main reason for their negligible role in heat conduction. Regarding the phonon bands and their contribution to lattice thermal conductivity, our conclusions are consistent with ref. 37 for H-WS2.
It is also interesting to note that Γ+5 and Γ+3 optical branches are not shown up in mono-layer MT2 structures. In those two-dimensional materials, LA, TA and ZA (out-of-plane acoustic phonon) acoustic branches play the dominant role in the thermal conductivity. Some recent calculations further revealed that ZA branch gives the largest contribution to total thermal conductivity at room temperature.38,39 Our results about bulk H-MT2, combined with ref. 38 and 39, provide a complementary explanation for the thermal conductivity of H-MT2 compounds in different forms.
3.4 Comparisons with other works
Our calculation of thermal conductivity tensor relies on a universal but empirical expression for Umklapp-process at high temperature. Obviously, we expect eqn (7) is a good approximation above room temperature for most crystalline materials. Generally, we may rescale eqn (7) by an arbitrary constant. The constant might be determined from the fitting procedure. For example, minimizing the difference between computed thermal conductivity and other known experimental values at certain temperature. In our current work, we discarded such methodology. Since the anisotropy in thermal conductivity is inherited from the crystal structures and phonon properties, the method employed here is sufficient to reveal their influences on phonon transportation.
Experimentally, little is known about the intrinsic thermal conductivity of many layered H-MT2 materials. In one particular work, Kim and coworkers measured thermal conductivities of four semiconducting metal dichalcogenides.40 Although, the samples used in their measurements may not represent the pure single crystalline phase, it is still illustrative to compare our calculations with their values. In Fig. 11, we plot the calculated thermal conductivities in [100] and [001] directions with other experimental and theoretical results. It is found that our current expression for phonon–phonon U-process tends to underestimate the intrinsic thermal conductivity for most H-MT2 structures. In some cases, the good agreement with experimental results is obtained by accident, i.e., κzz of H-MoS2 or H-WS2, and κxx of H-WS2.40–44 Recently, Gandi et al.37 calculated thermal conductivity of H-WS2 using rigorous theoretical treatment of phonon–phonon Umklapp-process based on third order force constants. The predicted κxx and κzz for H-WS2 are shown in Fig. 11(c) together with our calculations. It is interesting to note that a rather large ratio κxx/κzz is obtained for the structure. For example, our calculations find κxx/κzz ≈ 8.6, compared to 32–34 given in ref. 37. Certainly, for H-WS2, neither ref. 37 nor our empirical expression of U-process gives satisfactory prediction for the intrinsic thermal conductivity. A molecular dynamic simulation based on force field method was performed by Varshney and collaborators41 to investigate thermal transportation in H-MoS2 phase. They found that κxx = 18.06 W m−1 K−1, κzz = 4.17 W m−1 K−1 and κxx/κzz ≈ 4.0 between 250 K and 300 K. This ratio has been employed in ref. 44 to estimate κxx from κzz. For the same phase, we find κxx = 13.26 (11.06) W m−1 K−1, κzz = 1.42 (1.18) W m−1 K−1 and κxx/κzz ≈ 9.33 (9.37) at 250 K (300 K).
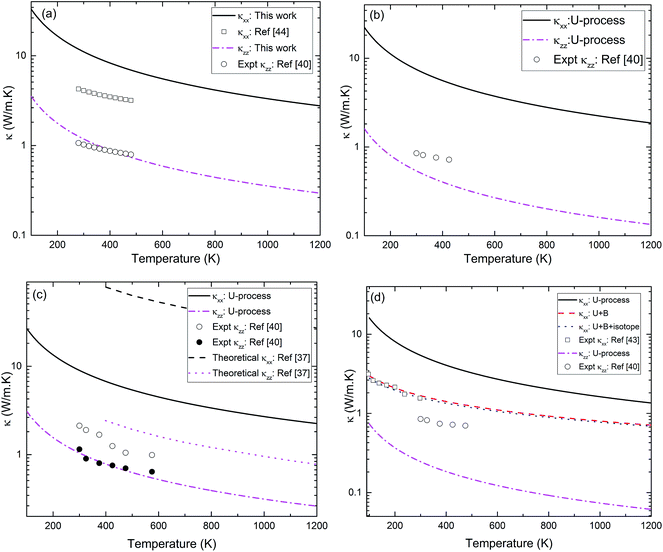 |
| | Fig. 11 The calculated thermal conductivities of H-MT2 structures in [100] and [001] directions are compared to other experimental works or theoretical values. (a) H-MoS2; (b) H-MoSe2; (c) H-WS2; (d) H-WSe2. For all structures, the intrinsic thermal conductivities are shown. In the case of H-WSe2, other scattering processes are also included for computing thermal conductivity. For boundary scattering, the size of sample is assumed to be 1 mm. | |
Finally, it might be necessary to mention that the intrinsic thermal conductivity of single layer H-MT2 is found to be significantly higher than bulk phase. For example, single-layer MoS2 has an intra-layer thermal conductivity of 100–200 W m−1 K−1 below 200 K.42 The reported values at room temperature (300 K) are 23.2 W m−1 K−1 (ref. 36) and 26.2 W m−1 K−1.42 The main difference between bulk and single-layer MT2 structures is the low-frequency optical bands introduced by inter-layer van der Waals interactions in former phase. The phonon band intercrossing is regarded as an important reason for having smaller thermal conductivity in bulk H-MT2 phases than single layer cases.
4. Conclusions
Employing a modified expression for phonon–phonon Umklapp-process, we calculated thermal conductivity tensor of four semiconducting H-MT2 structures, using phonon spectra obtained from first principles calculations. The anisotropy in thermal conductivity has been investigated by evaluating the phonon spectrum, mode-Grüneisen parameters, phonon velocities and relaxation times in [100] and [001] directions, respectively. Our results showed that all computed properties have strong dependences on crystallographic direction in H-MT2 structures. Structural anisotropy is the main reason behind this intriguing feature. Moreover, a heavy molecular mass enhances the anisotropy in phonon thermal conductivity. We also confirm that acoustic phonon bands dominate the phonon transportation, and contribution of optical bands can be neglected in those H-MT2 structures. Among three acoustic phonon bands, longitudinal band (LA) plays the most significant role in thermal conductivity. From the computed values, we found that our current expression for U-process underestimates the intrinsic thermal conductivity, compared to experiments. Further improvement is required in the future study. However, the methodology developed in this paper uses the phonon spectrum as the input, it is able to predict the large anisotropies in phonon related properties and thermal conductivity for any crystal structure in a quick and efficient way.
Acknowledgements
This work is financially supported by the Department of Science and Technology of Sichuan Province with Grant no. 2015GZ0198. First-principles calculations were carried out on the Chen Qingyun's group clusters at the Southwest University of Science and Technology.
References
- G. Chen, T. Zeng, T. Borca-Tasciuc and D. Song, Mater. Sci. Eng., 2000, 292, 155 CrossRef.
- G. Chen, Int. J. Therm. Sci., 2000, 39, 471 CrossRef CAS.
- R. Berman, Thermal conduction in solids, Oxford University Press, Oxford, 1976 Search PubMed.
- T. M. Tritt, Thermal conductivity: Theory, properties, and applications, Springer Science & Business Media, New York, 2004 Search PubMed.
- D. G. Cahill and R. O. Pohl, Annu. Rev. Phys. Chem., 1988, 39, 93 CrossRef CAS.
- G. A. Slack, Solid State Phys., 1979, 34, 1 CAS.
- M. G. Holland, Phys. Rev., 1963, 132, 2461 CrossRef CAS.
- M. Roufosse and P. J. Klemens, Phys. Rev. B: Condens. Matter Mater. Phys., 1973, 7, 5379 CrossRef CAS.
- D. R. Clarke, Surf. Coat. Technol., 2003, 163, 67 CrossRef.
- L. Lindsay, D. A. Broido and T. L. Reinecke, Phys. Rev. B: Condens. Matter Mater. Phys., 2013, 87, 165201 CrossRef.
- A. Togo, L. Chaput and I. Tanaka, Phys. Rev. B: Condens. Matter Mater. Phys., 2015, 91, 094306 CrossRef.
- A. H. Romero, E. K. U. Gross, M. J. Verstraete and O. Hellman, Phys. Rev. B: Condens. Matter Mater. Phys., 2015, 91, 214310 CrossRef.
- R. Guo, X. Wang, Y. Kuang and B. Huang, Phys. Rev. B: Condens. Matter Mater. Phys., 2015, 92, 115202 CrossRef.
- D. A. Broido, L. Lindsay and A. Ward, Phys. Rev. B: Condens. Matter Mater. Phys., 2012, 86, 115203 CrossRef.
- C. De Tomas, A. Cantarero, A. F. Lopeandia and F. X. Alvarez, J. Appl. Phys., 2014, 115, 164314 CrossRef.
- S. G. Volz and G. Chen, Phys. Rev. B: Condens. Matter Mater. Phys., 2000, 61, 2651 CrossRef CAS.
- A. Tenebaum, G. Ciccotti and R. Gallico, Phys. Rev. A, 1982, 25, 2778 CrossRef.
- S. Stackhouse, L. Stixrude and B. B. Karki, Phys. Rev. Lett., 2010, 104, 208501 CrossRef PubMed.
- S. Stackhouse, L. Stixrude and B. B. Karki, Earth Planet. Sci. Lett., 2015, 427, 11 CrossRef CAS.
- Y. Ding and B. Xiao, RSC Adv., 2015, 5, 18391 RSC.
- G. Kresse and J. Fürthmuller, Phys. Rev. B: Condens. Matter Mater. Phys., 1996, 54, 11169 CrossRef CAS.
- P. E. Blöchl, Phys. Rev. B: Condens. Matter Mater. Phys., 1994, 50, 17953 CrossRef.
- J. Hafner, J. Comput. Chem., 2008, 29, 2044 CrossRef CAS PubMed.
- J. Klimeš, D. R. Bowler and A. Michaelides, J. Phys.: Condens. Matter, 2010, 22, 022201 CrossRef PubMed.
- J. Klimeš, D. R. Bowler and A. Michaelides, Phys. Rev. B: Condens. Matter Mater. Phys., 2011, 83, 195131 CrossRef.
- K. Lee, E. D. Murray, L. Kong, B. I. Lundqvist and D. C. Langreth, Phys. Rev. B: Condens. Matter Mater. Phys., 2010, 82, 081101 CrossRef.
- J. P. Perdew and A. Zunger, Phys. Rev. B: Condens. Matter Mater. Phys., 1981, 23, 5048 CrossRef CAS.
- J. P. Perdew, K. Burke and M. Ernzerhof, Phys. Rev. Lett., 1996, 77, 3865 CrossRef CAS PubMed.
- http://phonopy.sourceforge.net/index.html.
- http://stokes.byu.edu/iso/isotropy.php.
- E. S. Toberer, A. Zevalkink and G. J. Snyder, J. Mater. Chem., 2011, 21, 15843 RSC.
- M. Roufosse and P. G. Klemens, Phys. Rev. B: Condens. Matter Mater. Phys., 1973, 7, 5379 CrossRef CAS.
- C. De Tomas, A. Cantarero, A. F. Lopeandia and F. X. Alvarez, Proc. - R. Soc. Edinburgh, Sect. A: Math. Phys. Sci., 2014, 470, 20140371 CrossRef PubMed.
- P. G. Klemens, Phys. B, 1999, 263, 102 CrossRef.
- http://www.webelements.com/.
- Y. Cai, J. Lan, G. Zhang and Y. W. Zhang, Phys. Rev. B: Condens. Matter Mater. Phys., 2014, 89, 035438 CrossRef.
- A. N. Gandi and U. Schwingenschlögl, Chem. Mater., 2014, 26, 6628 CrossRef CAS.
- W. X. Zhou and K. Q. Chen, Sci. Rep., 2015, 5, 15070 CrossRef CAS PubMed.
- W. Li, J. Carrete and N. Mingo, Appl. Phys. Lett., 2013, 103, 253103 CrossRef.
- J. Y. Kim, S. M. Choi, W. S. Seo and W. S. Cho, Bull. Korean Chem. Soc., 2010, 31, 3225 CrossRef CAS.
- V. Varshney, S. S. Patnaik, C. Muratore, A. K. Roy, A. A. Voevodin and B. L. Farmer, Comput. Mater. Sci., 2010, 48, 101 CrossRef CAS.
- X. Wei, Y. Wang, Y. Shen, G. Xie, H. Xiao, J. Zhong and G. Zhang, Appl. Phys. Lett., 2014, 105, 103902 CrossRef.
- C. Chiritescu, D. G. Cahill, N. Nguyen, D. Johnson, A. Bodapati, P. Keblinski and P. Zschack, Science, 2007, 315, 351 CrossRef CAS PubMed.
- H. Guo, T. Yang, P. Tao and Z. Zhang, Chin. Phys. B, 2014, 23, 017201 CrossRef.
|
| This journal is © The Royal Society of Chemistry 2016 |
Click here to see how this site uses Cookies. View our privacy policy here. 


![[M with combining macron]](https://www.rsc.org/images/entities/i_char_004d_0304.gif) in original expression by N ×
in original expression by N × ![[M with combining macron]](https://www.rsc.org/images/entities/i_char_004d_0304.gif) , where, N is the total number of atoms in the cell; a represents the lattice constant of cell in a principal direction, and it has the same dimension as the V1/3 in the original equation; the phonon phase velocity vp(ω) and group velocity vg(ω); γ(ω) is phonon mode-Grüneisen parameter; kB is Boltzmann constant. We should note that ratio M/a is a constant when varying the size of modeling supercell. Thus, ensuring the relaxation time has no dependence on supercell dimension. The scaling constant λ might be determined from physical properties of a crystal structure, and which is served as an adjustable parameter to improve the agreement between theoretical prediction and experiments.33 In this paper, it is treated as a constant, and we use λ = 1.9488, the same as ref. 31. From eqn (7), we can see the anisotropy in thermal conductivity has a complicated origination, i.e., coming from the properties of phonons and structural details (M and a).
, where, N is the total number of atoms in the cell; a represents the lattice constant of cell in a principal direction, and it has the same dimension as the V1/3 in the original equation; the phonon phase velocity vp(ω) and group velocity vg(ω); γ(ω) is phonon mode-Grüneisen parameter; kB is Boltzmann constant. We should note that ratio M/a is a constant when varying the size of modeling supercell. Thus, ensuring the relaxation time has no dependence on supercell dimension. The scaling constant λ might be determined from physical properties of a crystal structure, and which is served as an adjustable parameter to improve the agreement between theoretical prediction and experiments.33 In this paper, it is treated as a constant, and we use λ = 1.9488, the same as ref. 31. From eqn (7), we can see the anisotropy in thermal conductivity has a complicated origination, i.e., coming from the properties of phonons and structural details (M and a).


![[m with combining macron]](https://www.rsc.org/images/entities/i_char_006d_0304.gif) and
and ![[r with combining macron]](https://www.rsc.org/images/entities/i_char_0072_0304.gif) . Obviously, for isotopes, we have
. Obviously, for isotopes, we have ![[r with combining macron]](https://www.rsc.org/images/entities/i_char_0072_0304.gif) = ri, and
= ri, and ![[m with combining macron]](https://www.rsc.org/images/entities/i_char_006d_0304.gif) = mifi. The fraction fi can be understood as the natural abundance of ith isotope. For crystal structure with two or more elements, one must use eqn (9) and (10) to calculate τS(ω) for each element, and total relaxation time of point defects is obtained in the way similar to eqn (6). For H-MT2 structures, the atomic weight, atomic radius and natural abundance of an isotope are provided in ref. 35. The computed impurity constant CS for each element is shown in Table 3.
= mifi. The fraction fi can be understood as the natural abundance of ith isotope. For crystal structure with two or more elements, one must use eqn (9) and (10) to calculate τS(ω) for each element, and total relaxation time of point defects is obtained in the way similar to eqn (6). For H-MT2 structures, the atomic weight, atomic radius and natural abundance of an isotope are provided in ref. 35. The computed impurity constant CS for each element is shown in Table 3.


![[thin space (1/6-em)]](https://www.rsc.org/images/entities/char_2009.gif) θ
θ![[thin space (1/6-em)]](https://www.rsc.org/images/entities/char_2009.gif) cos
cos![[thin space (1/6-em)]](https://www.rsc.org/images/entities/char_2009.gif) φ, λ12 = sin
φ, λ12 = sin![[thin space (1/6-em)]](https://www.rsc.org/images/entities/char_2009.gif) θ
θ![[thin space (1/6-em)]](https://www.rsc.org/images/entities/char_2009.gif) sin
sin![[thin space (1/6-em)]](https://www.rsc.org/images/entities/char_2009.gif) φ and λ11 = cos
φ and λ11 = cos![[thin space (1/6-em)]](https://www.rsc.org/images/entities/char_2009.gif) θ in spherical coordinates. The three-dimensional contour plots are illustrated for H-MoS2 and H-WSe2 at 300 K and 1000 K in Fig. 8. The results for other H-MT2 structures are analogous to Fig. 8 and which are omitted here.
θ in spherical coordinates. The three-dimensional contour plots are illustrated for H-MoS2 and H-WSe2 at 300 K and 1000 K in Fig. 8. The results for other H-MT2 structures are analogous to Fig. 8 and which are omitted here.
![[1 with combining macron]](https://www.rsc.org/images/entities/char_0031_0304.gif) 0) plane is anisotropic. The value of thermal conductivity approaching [0001] direction decreases rapidly, compared to that of [1000] direction. As a result, one can see a steep dip in the three-dimensional contour in [0001] direction. At (10
0) plane is anisotropic. The value of thermal conductivity approaching [0001] direction decreases rapidly, compared to that of [1000] direction. As a result, one can see a steep dip in the three-dimensional contour in [0001] direction. At (10![[1 with combining macron]](https://www.rsc.org/images/entities/char_0031_0304.gif) 0) plane, thermal conductivity is computed as
0) plane, thermal conductivity is computed as
![[1 with combining macron]](https://www.rsc.org/images/entities/char_0031_0304.gif) 0) plane.
0) plane.

![[1 with combining macron]](https://www.rsc.org/images/entities/char_0031_0304.gif) 0) plane. (a) 300 K; (b) 1000 K.
0) plane. (a) 300 K; (b) 1000 K. in [100] direction. Using H-MoS2 as an example, replacing some S atoms by Se may decrease elastic constant C11 (C11 = 234.86 GPa for pure H-MoS2 and 193.80 GPa for H-MoSe2).


