DOI:
10.1039/C5RA24870A
(Paper)
RSC Adv., 2016,
6, 9139-9151
V and Ni recovery from a vanadium-rich power plant residual ash using acid producing fungi: Aspergillus niger and Penicillium simplicissimum
Received
23rd November 2015
, Accepted 11th January 2016
First published on 14th January 2016
Abstract
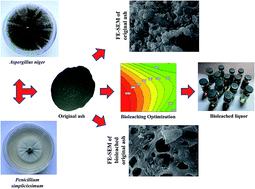
Bioleaching of V and Ni from a vanadium-rich power plant residual (PPR) ash using Aspergillus niger and Penicillium simplicissimum was investigated. To find the optimum fermentation period, prior to optimization, fungal growth was monitored through measurement of pH and produced organic acids. Preliminary tests revealed that spent-medium bioleaching, in contrast with one-step and two-step bioleaching methods, was the most efficient method, which should be optimized for enhancement of simultaneous V and Ni recovery. Pulp density, leaching temperature and leaching duration were selected as three influencing factors on metals recovery. Leaching temperature of 60 °C, leaching duration of 7 days and pulp densities of 29.2 and 32.2 g L−1 respectively for Aspergillus niger and Penicillium simplicissimum were determined as the optimal conditions. Under optimum condition V and Ni recoveries were respectively 97% and 50% using Aspergillus, while 90% of V and 49% of Ni were recovered using Penicillium. Chemical leaching tests were also conducted using commercial organic acids at equivalent values of maximum amount produced by both of the fungi. The results showed that bioleaching improved chemical leaching of V and Ni up to 15% and 12%, respectively. TCLP tests indicated that bioleaching successfully detoxified PPR ash. FE-SEM photomicrographs also confirmed high efficiency of bioleaching.
1. Introduction
Fuel oil is one of the major fuels combusting in thermal power plants throughout the world. The incomplete combustion of heavy fuel oil in power plants furnaces leads to production of large amounts of ashes which contain a relatively high content of heavy metals especially V and Ni. This amount is expected to increase considerably in the following years due to natural growing rate of world energy demand. It is noteworthy to mention that most of the metals present in power plant residual ash (PPR ash) are non-process elements which have no active part in the process of fuel burning. The main non-process elements in PPR ash are V and Ni that come with the fuel, and also Mg which in order to avoid fuel fouling is added to fuel as Mg(OH)2. The other present heavy metals originate from corrosion of the equipment at high temperatures during the process.1–3
Because V and Ni content of PPR ashes, about 2–4%, is an amount comparable to that of natural mineral resources, recovery of these metals is of great importance from both economic and environmental aspects. Bioleaching is an eco-friendly and more cost efficient approach for recovering valuable metals from these solid wastes and detoxifying them, in comparison to the chemical approaches in which strong chemicals under high temperature and pressure conditions are used.4–8 Bioleaching is based on the ability of microorganisms including bacteria or fungi in production of inorganic or organic acids that results in dissolution of metals. Aspergillus and Penicillium are the most active metal leaching genera of heterotrophic fungi which excrete large amounts of organic acids (citrate, gluconate, oxalate) and are mostly utilized in recovery of heavy and valuable metals from solid wastes.9–11
There are different methods of bioleaching for recovery of metals from various substrates including: (1) one-step bioleaching, in which the fungus is inoculated to the bioleaching medium simultaneously with the addition of the solid waste, (2) two-step bioleaching, in which the sample is added to the medium when the fungus is in its logarithmic growth phase, (3) spent-medium bioleaching, where after completion of fungal growth and production of maximum amount of organic acids, the solid waste is added to the biomass free medium. It seems that there are some inconsistencies in selecting the more efficient method, since the process highly depends on the type of substrate and also the utilized microorganism.12–15 However to industrialize the process and enhance metal leaching efficiencies, spent-medium leaching is believed to be a more appropriate method. Some of the advantages of spent-medium leaching over the two other methods are as follows. In this method, the biomass and solid waste are not in direct contact, so the biomass might be recycled and also the solid waste is not contaminated by the microbial biomass. Furthermore, acid formation by the microorganism in absence of the solid material can be optimized and also higher pulp densities can be applied as compared to one-step and two-step bioleaching.14,16 Optimization of different physical, chemical and biological factors is a very important issue in industrial processes. Some of these parameters include: (1) carbon source and oxygen supply; (2) inoculum and pre-culture period; (3) tolerance of microorganism to metal ions; (4) pH; (5) temperature of leaching environment; (6) pulp density; (7) physical and chemical states of the solid residue; and (8) bioleaching period. Generally finding out the key parameters and their optimal operating conditions for the bioleaching process is desirable.17,18
In this research simultaneous extraction of V and Ni from PPR ash using Aspergillus niger and Penicillium simplicissimum fungi was investigated. Prior to design of experiments, the growth condition of the fungi and different bioleaching methods were investigated. Spent-medium leaching as the most efficient method of bioleaching for recovering metals was selected to be optimized and the optimal conditions for fungal growth and organic acids excretion in pure culture were determined. The effects of pulp density, temperature of leaching environment and leaching duration as the numeric factors, and Aspergillus niger and Penicillium simplicissimum as the categoric factors on the recovery yields of vanadium and nickel and also the interactions between the factors were evaluated and optimized using Box–Behnken design of response surface methodology (RSM). Since organic acids and different fungal metabolites start decomposing at temperatures above 80 °C, the experiments were conducted below this temperature.19
2. Materials and methods
2.1. Microorganisms and growth conditions
The heterotrophic fungi of Aspergillus niger (PTCC 5210) and Penicillium simplicissimum (PTCC 5129) were provided by the Iranian Research Organization for Science and Technology (IROST) in Tehran, Iran. The fungi were cultured on potato dextrose agar (PDA) plates and incubated for seven days at 30 °C. Then the conidia of the fungi were harvested from the surface of the cultured PDA Petri dishes, using sterilized distilled water. The number of spores was counted under a phase-contrast microscope (Zeiss, Germany) using a Thoma chamber with a depth of 0.1 mm and an area of 0.0025 mm2 at 400× magnification. When the number of spores exceeded 107, the spore suspension was diluted using sterilized distilled water to reach the desired spore concentration. One milliliter of the prepared inoculum was inoculated to 100 mL of the sucrose medium composed of 100 g sucrose, 1.5 g NaNO3, 0.5 g KH2PO4, 0.025 g MgSO4·7H2O, 0.025 g KCl and 1.6 g yeast extract in 1 L distilled water.20 Prior to inoculation the sucrose medium was autoclaved and placed in 250 mL Erlenmeyer flasks. Fungal pure cultures were incubated at 30 °C with rotary shaking at 130 rpm in order to obtain the cell free medium for conducting spent-medium bioleaching experiments.
2.2. Power plant residual ash
The residual ash sample used in this study was collected from Shahid Salimi (Neka) power station a fuel oil consuming power plant in Iran. It was ground and screened to less than 75 μm particle sizes using a vibrator shifter. The elemental composition of the sample was determined using X-ray fluorescence (XRF) analysis. Table 1 shows metal composition of this solid waste and its high loss on ignition (LOI) which confirms the high carbonaceous and volatile fraction of the sample.
Table 1 Metal composition of PPR ash
Element |
Weight (mg kg−1 PPR ash) |
V |
30 490 |
Ni |
19 660 |
Cu |
970 |
Fe2O3 |
218 830 |
SiO2 |
2950 |
MgO |
1870 |
Na2O |
25 620 |
LOI |
70.11% |
2.3. Apparatus and analytical methods
An orbital shaker-incubator (Wise Cube, South Korea) was used for shaking the Erlenmeyer flasks and fixing the temperature in bioleaching experiments. After the desired fungal growth period, the pure cultures of each strain were filtered through 0.2 μm Whatman filter papers and the filtrates were analyzed for the concentration of excreted organic acids (i.e. citric, gluconic and oxalic acids) using high performance liquid chromatography (HPLC; Sykam, MACHERY-NAGEL, Germany) with a UV-Vis diode array detector (DAD) at 210 nm and a 250 × 4.6 mm, Nucleodur C18 ec, 5 μm column. 20 μL of the prepared HPLC-grade organic acids solutions were injected into the column as standards for detecting acids. A digital multi meter (CP-500L, ISTEK, Korea) was used to measure pH variations. The metal content of the sample was determined using XRF (PW2404, Philips, Netherland) analysis. For this purpose, 3 g of the sample was added to a small value of boric acid powder as sub base and converted to a tablet under high pressure (10 N) using a pressing machine. The tablet was inserted to XRF device and the amount of metals in the PPR ash sample was measured based on the type of element and the peak intensity. To calculate metal recovery yields, the concentration of metal ions in bioleached liquors were analyzed by inductively coupled-plasma optical emission spectrometer (ICP-OES; Vista-pro, Australia). In calculations, medium evaporation losses were taken into account. Metal components phases were identified using X-ray diffraction (XRD; X'Pert MPD, Philips, Netherland) analysis and it confirmed presence of Fe2(SO4)2(OH)·5H2O, FeSO4·4H2O, VOSO4·5H2O, Na6V10O28·4H2O and NaMgFe(SO4)3 phases in the PPR ash. Ni is present in amorphous form (not crystalline) and that is why no nickel compound has been detected in the XRD pattern. The surface morphology of the sample before and after bioleaching was also determined using a field emission scanning electron microscope (FE-SEM; HITACHI S-4160, Japan), operating at 20 kV.
2.4. Toxicity characteristic leaching procedure (TCLP) tests
Toxicity characteristic leaching procedure (TCLP) tests for V, Ni and Fe in the PPR ash samples before and after bioleaching were conducted based on USEPA methods 1312 (1990). The results were compared against the regulatory levels set by National Environmental Agency, Singapore (NEA) and U.S. EPA. The TCLP tests were carried out in the same acidic conditions found in most of the landfills. The samples were leached using acetic acid at a solid to liquid ratio of 1
:
20 and a leaching duration of 18 h. The concentrations of metals in the TCLP extract were measured using ICP-OES analysis.
2.5. Chemical leaching experiments
Chemical leaching tests were conducted using commercial organic acids at equivalent concentrations to the maximum values produced by Aspergillus niger and Penicillium simplicissimum in the pure cultures. The experiments were carried out in 250 mL Erlenmeyer flasks containing the mixture of organic acids (citric, gluconic, oxalic and malic acids) and deionized water for making up the desired acid concentrations. The samples were finally filtered and collected for measuring the metals concentrations using ICP-OES analysis.
2.6. Design of experiments and optimization
After preliminary experiments for determining the optimum condition of fungal growth and organic acids excretion, an experimental design was developed to investigate the effects of influencing parameters on metal recovery efficiencies. Response surface methodology is a collection of mathematical and statistical techniques useful to evaluate the effects of several independent factors on the process responses. Basically RSM consists of three major steps including: (1) introducing a suitable approximation to find true relationship between the set of independent variables (factors) and the dependent variable (response); (2) explaining the behavior of the system by the following quadratic equation: |
 | (1) |
where Y is the predicted response; β0, βii, βij are the model parameters; and xi, xj are the coded factors; (3) predicting the response and checking efficiency of the statistical model.21–24 Therefore in this study Box–Behnken design (BBD) of response surface methodology with three numeric factors at three levels and one categoric factor was used. BBD allows a decrease in the number of runs and so considers the economy of experiments. It also avoids all corner points and star points and allows fitting of the quadratic model. The number of experiments designed by Box–Behnken method is obtained using equation of 2k(k − 1) + Cp where k is the number of factors and Cp is the number of center points which in this work it was equal to 5.21,25 Accordingly for each of the microorganisms (Aspergillus and Penicillium) 17 batch runs was designed which made the total number of runs 34. Generally the objective of present study was to optimize and evaluate the effects of three independent variables of pulp density, temperature of leaching environment and leaching duration on the vanadium and nickel recovery from PPR ash using spent-medium bioleaching method. Spent-medium bioleaching is a more practical method for industrial applications which it is very important to optimize different involving parameters to reach higher metal extraction efficiencies. In Table 2 selected factors and their levels have been presented.
Table 2 The factors, their levels and experimental design based on BBD
Factors |
Units |
Type |
Low actual |
Center point |
High actual |
A: pulp density |
% w/v |
Numeric |
1 |
3 |
5 |
B: leaching temperature |
°C |
Numeric |
30 |
45 |
60 |
C: time (leaching duration) day |
|
Numeric |
7 |
14 |
21 |
D: fungus |
|
Categoric |
Penicillium simplicissimum |
Aspergillus niger |
|
BBD-RSM |
Run |
Factors |
Metal recovery (%) |
Pulp density (% w/v) |
Leaching temperature (°C) |
Time (day) |
Fungus |
V |
Ni |
1 |
3 |
45 |
14 |
Penicillium simp |
81.94 |
45.60 |
2 |
3 |
45 |
14 |
Penicillium simp |
77.94 |
43.06 |
3 |
3 |
30 |
21 |
Penicillium simp |
69.81 |
32.12 |
4 |
3 |
30 |
21 |
Aspergillus niger |
76.99 |
33.94 |
5 |
5 |
60 |
14 |
Aspergillus niger |
87.69 |
39.32 |
6 |
5 |
45 |
21 |
Penicillium simp |
71.06 |
31.28 |
7 |
5 |
30 |
14 |
Penicillium simp |
68.43 |
28.06 |
8 |
3 |
45 |
14 |
Aspergillus niger |
87.56 |
45.52 |
9 |
3 |
45 |
14 |
Aspergillus niger |
95.87 |
48.40 |
10 |
3 |
45 |
14 |
Penicillium simp |
82.42 |
46.29 |
11 |
1 |
45 |
7 |
Penicillium simp |
95.80 |
52.97 |
12 |
3 |
60 |
7 |
Penicillium simp |
89.43 |
50.31 |
13 |
1 |
45 |
21 |
Penicillium simp |
80.98 |
47.57 |
14 |
5 |
45 |
7 |
Penicillium simp |
73.99 |
32.97 |
15 |
1 |
30 |
14 |
Aspergillus niger |
98.30 |
51.23 |
16 |
1 |
45 |
21 |
Aspergillus niger |
89.42 |
49.21 |
17 |
5 |
60 |
14 |
Penicillium simp |
79.49 |
36.81 |
18 |
3 |
45 |
14 |
Penicillium simp |
83.22 |
45.58 |
19 |
1 |
45 |
7 |
Aspergillus niger |
99.12 |
52.03 |
20 |
1 |
60 |
14 |
Aspergillus niger |
100.00 |
56.01 |
21 |
3 |
45 |
14 |
Aspergillus niger |
95.20 |
48.26 |
22 |
5 |
45 |
7 |
Aspergillus niger |
79.13 |
34.03 |
23 |
3 |
45 |
14 |
Aspergillus niger |
88.69 |
44.58 |
24 |
3 |
60 |
7 |
Aspergillus niger |
92.68 |
50.65 |
25 |
1 |
60 |
14 |
Penicillium simp |
96.05 |
57.07 |
26 |
3 |
60 |
21 |
Penicillium simp |
79.50 |
46.41 |
27 |
1 |
30 |
14 |
Penicillium simp |
83.81 |
45.21 |
28 |
5 |
30 |
14 |
Aspergillus niger |
82.04 |
32.12 |
29 |
5 |
45 |
21 |
Aspergillus niger |
84.80 |
35.57 |
30 |
3 |
45 |
14 |
Aspergillus niger |
86.60 |
46.07 |
31 |
3 |
45 |
14 |
Penicillium simp |
76.85 |
44.35 |
32 |
3 |
60 |
21 |
Aspergillus niger |
87.17 |
48.90 |
33 |
3 |
30 |
7 |
Aspergillus niger |
86.11 |
38.78 |
34 |
3 |
30 |
7 |
Penicillium simp |
70.47 |
33.10 |
3. Results and discussion
3.1. Fungal growth investigation and preliminary experiments
To evaluate different bioleaching methods and to select the most efficient method for optimization process, prior to design of experiments some preliminary tests were carried out. In one-step bioleaching the ability of both fungi in presence of various pulp densities was comparatively examined in order to determine the upper limit of their growth. Both of the fungi up to pulp density of 5 g L−1 were able to grow sufficiently, but in higher pulp densities due to higher toxicity of the bioleaching solution, fungal growth decreased considerably. Penicillium simplicissimum was able to tolerate up to 15 g L−1 pulp density of the solid waste, but its growth retarded noticeably so that it was not suitable for conducting bioleaching experiments. Aspergillus niger showed a lower resistance to toxic environments so that it was not able to grow even at 10 g L−1 pulp density. The preliminary experiments revealed that using spent-medium bioleaching not only reaching to higher pulp densities was easier accessible, but also metal recovery yields were higher in comparison to one-step and two-step bioleaching methods.
In order to choose the appropriate time for filtering of the cultures (at the end of active fungal growth) in spent-medium bioleaching, the fungal growth in pure cultures were investigated through measurement of produced organic acids using HPLC. According to the HPLC results presented in Fig. 1, 14th day of fungal growth for Aspergillus and 15th day for Penicillium were selected as the optimum days for filtration of the cultures where the maximum organic acid production was observed.
 |
| Fig. 1 Maximum produced organic acids by Penicillium simplicissimum (during 15 days) and Aspergillus niger (during 14 days). | |
3.2. Statistical analysis
34 experiments including 17 runs for each microorganism at three different levels for any of the numeric factors and the related responses have been shown in Table 2. To identify the significance of the factors and their interactions and competency of the model, the results were statistically analyzed using Design Expert (version 7.1.4) software. The analysis of variance (ANOVA) suggested a quadratic model for the prediction of both vanadium and nickel recoveries. The results of ANOVA are presented in Table 3.
Table 3 ANOVA table for response surface models applied for metals extraction
Response |
Model |
ANOVA |
Source |
Sum of squares |
Df |
F value |
P-Value |
V recovery (%) |
Reduced quadratic model |
Model |
2357 |
12 |
21.95 |
<0.0001 |
A-pulp density |
853.4 |
1 |
95.33 |
<0.0001 |
B-temperature |
361.5 |
1 |
40.38 |
<0.0001 |
C-time |
138.1 |
1 |
15.42 |
0.0007 |
D-fungus |
717.4 |
1 |
80.14 |
<0.0001 |
AB |
0.9591 |
1 |
0.1071 |
0.7467 |
AC |
92.89 |
1 |
10.38 |
0.0040 |
AD |
6.878 |
1 |
0.7683 |
0.3907 |
BC |
4.004 |
1 |
0.4473 |
0.5109 |
BD |
48.48 |
1 |
5.415 |
0.0300 |
CD |
5.856 |
1 |
0.6542 |
0.4277 |
A2 |
34.46 |
1 |
3.849 |
0.0631 |
C2 |
99.71 |
1 |
11.14 |
0.0031 |
Residual |
188.0 |
21 |
|
|
Lack of fit |
77.31 |
13 |
0.4298 |
0.9151 |
R2 = 0.92 |
Radj2 = 0.88 |
|
|
|
Ni recovery (%) |
Reduced quadratic model |
Model |
1940 |
12 |
42.77 |
<0.0001 |
A-pulp density |
1245 |
1 |
329.4 |
<0.0001 |
B-temperature |
516.7 |
1 |
136.7 |
<0.0001 |
C-time |
24.60 |
1 |
6.509 |
0.0185 |
D-fungus |
37.82 |
1 |
10.01 |
0.0046 |
AB |
0.0595 |
1 |
0.0157 |
0.9013 |
AC |
8.141 |
1 |
2.154 |
0.1570 |
AD |
2.449 |
1 |
0.6480 |
0.4299 |
BC |
0.0036 |
1 |
0.0009 |
0.9756 |
BD |
11.06 |
1 |
2.925 |
0.1020 |
A2 |
11.77 |
1 |
3.115 |
0.0921 |
B2 |
15.57 |
1 |
4.120 |
0.0552 |
C2 |
58.46 |
1 |
15.47 |
0.0007 |
Residual |
79.38 |
21 |
|
|
Lack of fit |
61.32 |
13 |
2.089 |
0.1496 |
R2 = 0.96 |
Radj2 = 0.93 |
|
|
|
In this table Df is denoted to degree of freedom and the mean squares are calculated by dividing the sum of squares of each variation source by degree of freedom. F-Value is the ratio of error to model variance indicating how well the variables describe the data variation around the mean. Higher F-value indicates the more acceptable variation of data about its mean value and the more significance of the factor.26,27 A P-value of less than 0.05 (<0.0001) for the quadratic models selected for V and Ni recovery, at a 95% confidence level indicated the significance of the models. Also high F-values of 21.95 and 38.12 for V and Ni respectively, confirmed the adequacy of the models. High and close to each other values of R-squared and Adj R-squared ensured a satisfactory adjustment of the quadratic models to the experimental data. Since it is possible to obtain a model with high value of R-squared, but poor estimates of the mean response, the value of Adj R-squared is an important criterion that should be considered. The coefficient of variance (CV) which represents reproducibility of the model was 3.53 and 4.57 for V and Ni respectively. A model which its CV is less than 10% can be considered reasonably reproducible.28
3.3. Fitting metal recovery models
The results from 34 batch runs were analyzed using BBD to evaluate the significance of the factors and the following second-order quadratic models for V and Ni recovery using coded factors were obtained (eqn (1) and (2)): |
V recovery (%) = 85.33 − 7.30A + 4.75B − 2.94C + 4.59D + 0.35AB + 3.41AC + 0.66AD − 0.71BC − 1.74BD + 0.60CD + 2.02A2 − 3.44C2
| (2) |
|
Ni recovery (%) = 45.77 − 8.82A + 5.68B − 1.24C + 1.05D − 0.086AB + 1.01AC + 0.39AD + 0.021BC − 0.83BD + 0.26CD − 1.18A2 − 1.36B2 − 2.63C2
| (3) |
where A, B, C and D denote pulp density (g L−1), leaching temperature (°C), leaching duration (day) and fungus type (Aspergillus niger and Penicillium simplicissimum), respectively. The constant values of 85.33 and 45.77 are the offset terms. Both equations show that pulp density (A) has an impressive, but negative effect on V and Ni recoveries. It is also understood that leaching temperature (B) has an important and positive effect on metals recovery, but leaching duration (C) has a slightly negative effect. Furthermore eqn (1) indicates that the categoric factor of fungus (D) is an important factor in recovery of vanadium while eqn (2) shows that it has a negligible effect on the nickel recovery, meaning that both microorganisms have had an almost identical ability for the Ni recovery.
Fig. 2(a) and (b) shows the predicted data by models versus actual data obtained from the experimental results. Just a position of the points to the 45° line indicates a satisfactory correlation between the experimental data and the predicted values, confirming the robustness of the models. Fig. 2(c) and (d) shows the plot of residuals against the predicted responses for V and Ni recovery. The random and evenly scattering of the points around the zero residual level and between the upper and lower bounds which form two parallel lines equidistant from the zero line indicates the adequacy of the models.
 |
| Fig. 2 Predicted versus actual data for (a) V recovery and (b) Ni recovery; internally studentized residuals versus predicted values for (c) V recovery and (d) Ni recovery. | |
3.4. Two and three dimensional response plots
3.4.1. Vanadium recovery. Fig. 3(a) and (d) shows the two dimensional response plots of the relationship between pulp density and leaching duration and their effects on V recovery at constant temperature of 60 °C for the two microorganisms of Penicillium simplicissimum and Aspergillus niger. As it is obvious from the contour plots, higher pulp densities and longer leaching durations had negative effect on the vanadium recovery and caused decreases in extraction efficiencies. As previously mentioned, the effect of pulp density was more impressive and dominant in comparison to leaching duration. In one-step bioleaching where the microorganism is in direct contact with the solid particles, increasing pulp density increases the solution toxicity and consequently inhibits microbial activity and causes decreases in metal recovery yields. Numerous researches have been conducted on optimization of a variety of important factors including pulp density for one-step bioleaching of different solid wastes. It seems that the main problem with this method is lack of access to high pulp densities, even with a series of consecutive adaptation steps, due to low tolerance of the microorganisms in environments containing various toxic and heavy metals.11,23,26,29,30 In this study spent-medium bioleaching was selected to be optimized, which is considered as an indirect leaching mechanism and the microorganisms are not in direct contact with the solid waste. Although in this method the fungal growth is not inhibited by the toxic metals and reaching higher pulp densities is more accessible, but as it is clear from the contour plots, decreasing in recovery yields is inevitable. Increasing the amount of ash added to the cell free medium containing a constant volume of organic acids and other metabolites released by the fungi, decreases the accessibility of metal oxides to the organic acids, which leach the metals through formation of metal–acid complexes, and consequently causes decreases in metals recovery. Also for leaching durations longer than 14 days decreasing in recovery yields was observed which it was probably due to precipitation of the metal in presence of some organic acids or other metabolites as a matter of time.11,19
 |
| Fig. 3 Two dimensional contour plots for V recovery: (a) and (d) pulp density versus leaching duration at constant temperature of 60 °C; (b) and (e) pulp density versus leaching temperature at constant leaching duration of 7 days; (c) and (f) leaching temperature versus leaching duration at constant pulp densities of 29.2 g L−1 and 32.2 g L−1; for Penicillium simplicissimum and Aspergillus niger respectively. | |
Fig. 3(a) shows that for the fungus Penicillium simplicissimum reaching vanadium recovery of higher than 90% at constant temperature of 60 °C requires pulp densities lower than 25 g L−1, but Fig. 3(d) indicates that for the fungus Aspergillus niger reaching to the above mentioned recovery of vanadium is attainable up to 35 g L−1 pulp density. This demonstrates higher vanadium recovery potential of Aspergillus at higher pulp densities compared to Penicillium which it could be because of further production of organic acids especially citric acid by this fungus during its growth period. Aspergillus produced 8078 ppm citric acid, 2126 ppm gluconic acid and 1170 ppm oxalic acid while Penicillium excreted 5237 ppm citric acid, 3666 ppm gluconic acid and 1287 ppm oxalic acid.
Fig. 3(b) and (e) shows the contour plots of pulp density versus leaching temperature at constant leaching duration of 7 days. The plots show that lower pulp densities result in higher recovery yields. As stated before, when pulp density decreases accessibility of metal oxides to the organic acids and the rate of complexolysis and redoxolysis reactions increases and consequently the leaching efficiency will be increased. This figure reveals the significant role of leaching temperature in improving V recovery. Increasing the temperature enhances the transformation of the reactant to the interface of the heterogeneous reaction site because of the higher diffusion rate of the constituent's fraction. Also faster diffusion of reactants as a consequence of temperature rise causes a remarkable enhancement in the rate of reaction, which these are all reflected in the obtained contour plots for the experimental results.19
Fig. 3(b) shows that reaching a vanadium recovery of 97% using Penicillium simplicissimum is achievable only in the temperature and pulp density interval of (52 °C, 10 g L−1) up to (60 °C, 15 g L−1) while Fig. 3(e) indicates that for the fungus Aspergillus niger reaching to the same percent of vanadium recovery is possible in a broader interval of (30 °C, 10 g L−1) and (60 °C, 20 g L−1). These findings imply high importance of selecting suitable microorganism according to the solid waste and the method of bioleaching, so that by using Aspergillus instead of Penicillium, to achieve the similar vanadium recovery of 97% at 10 g L−1 pulp density the leaching temperature can be reduced from 52 °C to 30 °C.
Fig. 3(c) and (f) illustrates leaching temperature versus leaching duration for Penicillium simplicissimum and Aspergillus niger at their optimum pulp densities of 29.2 g L−1 and 32.2 g L−1, respectively. Fig. 3(f) indicates that the suitable range for vanadium recovery of 90% using Aspergillus is temperatures above 50 °C and a leaching duration between 7 to 15 days. Fig. 3(c) shows a similar trend but with lower vanadium recovery yields for the fungus Penicillium.
3.4.2. Nickel recovery. The effects of selected numeric factors on Ni recovery were almost similar for both of the fungi. The maximum Ni extraction efficiency was 56% using Aspergillus niger and 57% using Penicillium simplicissimum at 10 g L−1 pulp density and leaching temperature of 60 °C. The factor of leaching temperature was the most effective variable in recovery of Ni. Fig. 4(a)–(c) shows changes in Ni recovery by increasing the leaching temperature from 30 °C to 60 °C for Aspergillus. In a leaching duration of 7 to 15 days, Ni recovery increased from 47% at leaching temperature of 30 °C to 53% at 45 °C and 56% at 60 °C. This trend was repeated similarly for the fungus Penicillium.
 |
| Fig. 4 Two dimensional contour plots for Ni recovery: (a)–(c) pulp density versus leaching duration at constant leaching temperatures of 30, 45 and 60 °C; (d)–(f) pulp density versus leaching temperature at constant leaching durations of 7, 14 and 21 days; for Aspergillus niger. | |
Fig. 4(d)–(f) illustrates the effect of prolonging leaching duration on Ni recovery. Fig. 4(d) shows that at 20 g L−1 pulp density and leaching temperature of 45 °C, reaching to the Ni recovery of 49% is possible during 7 days of incubation while Fig. 4(e) indicates that at the same pulp density and leaching temperature but during 14 days of incubation, the recovery increased to 52%. Fig. 4(f) shows that increasing the leaching duration to 21 days not only didn't improve Ni recovery but also it adversely decreased Ni recovery to 46%. The reason for this phenomenon is formation of some metal complexes (such as nickel oxalate) in presence of fungal metabolites which are insoluble or act as an inhibitor of the reaction, slowing down the rate of metals dissolution.19,28 Nickel oxalate is formed as the following equation:
|
NiO + HO2C·CO2H → NiC(O2C·O2) + 2H+
| (4) |
The fungi in addition to organic acids including citric, gluconic and oxalic acids produce nearly 145 different secondary metabolites such as galactonic, hydroxypyruvic, fumaric, hexylitaconic, 4-hydroxymandelic acids, malic acid etc.19,31,32 These unidentified metabolites might make complexes with transition metals and influence the recovery yields.
Fig. 5(a)–(f) illustrates three dimensional contour plots of V and Ni recovery using Penicillium simplicissimum spent-medium at optimum values of the selected factors. Fig. 5(a) and (b) shows the strong positive effect of increasing leaching environment temperature on recovery of metals in result of accelerating the rate of dissolution reactions. Also the optimum intervals of pulp density and leaching duration for the recovery of V and Ni are clear from Fig. 5(c)–(f), confirming the previously described results of two dimensional contour plots.
 |
| Fig. 5 Three dimensional contour plots for V and Ni recovery using Penicillium simplicissimum: (a and b) pulp density versus leaching temperature at constant leaching duration of 7 days; (c and d) pulp density versus leaching duration at constant temperature of 60 °C; (e and f) leaching temperature versus leaching duration at constant pulp density of 29.2 g L−1. | |
3.5. Process optimization
The main objective of experimental optimization of bioleaching processes is reaching to higher recovery yields in a situation that is commercially viable and cost-efficient. Accordingly although the software suggested maximum vanadium and nickel recovery for a 10 g L−1 pulp density, but since for industrial applications maximizing pulp density and minimizing leaching duration can be very significant, the predefined criteria for the factors were selected as follows. Two optimal conditions of leaching temperature of 60 °C, minimum leaching duration of 7 days and maximum pulp densities of 29.2 g L−1 and 32.2 g L−1 for Penicillium simplicissimum and Aspergillus niger respectively were suggested by the statistical models. The decrease in metals recovery by increasing pulp density up to the suggested values by the software was negligible. Under the above mentioned circumstances, maximum extraction efficiencies of 92.9% V and 49.3% Ni using Aspergillus niger and 88.5% V and 48.9% Ni using Penicillium simplicissimum were predicted.
Fig. 6(a) and (b) shows V and Ni overlay plots for both of the fungi, where the yellow portion indicates the zone of possible response values for the factor space and graphical optimization. Fig. 6(a) shows the overlay plot for V recovery of more than 90% and Ni recovery of more than 47% using Aspergillus niger. The figure illustrates that in a minimum leaching duration of 7 days, it is possible to reach the desired recovery yields in a pulp density range of 10 to 32.2 g L−1 and leaching temperature range of 30 °C to 60 °C. Fig. 6(b) presents overlay plot for V and Ni recovery of more than 90% and 47%, respectively using Penicillium simplicissimum. It is understood that reaching to the desired metals recovery, is possible in a narrower range of 10 to 29.2 g L−1 pulp density and 36 °C to 60 °C leaching temperature in a constant minimum leaching duration of 7 days.
 |
| Fig. 6 Overlay plot of optimum region for metal recovery using (a) Aspergillus niger and (b) Penicillium simplicissimum. | |
3.6. Confirmation tests
To evaluate the validity of the statistical models, two experiments were conducted under optimal conditions suggested by the models for the two fungi. According to Table 4 the results of confirmatory experiments were within low and high predicted values in 95% confidence intervals (CI). The results indicated that the experimental responses were quite close to the predicted values, confirming the validity of the models.
Table 4 Point prediction and confirmation of responses under optimal conditions
Fungus |
Response (%) |
Predicted recovery (%) |
95% CI low |
95% CI high |
Confirmation experiment (%) |
Aspergillus niger |
V recovery |
92.96 |
88.58 |
97.35 |
97 |
Ni recovery |
49.31 |
46.55 |
52.07 |
50 |
Penicillium simplicissimum |
V recovery |
88.52 |
84.14 |
92.91 |
90 |
Ni recovery |
48.90 |
46.13 |
51.66 |
49 |
3.7. Determination of surface characteristics using FE-SEM
Fig. 7(a)–(d) shows the FE-SEM images of the PPR ash before and after bioleaching in two different magnifications. Fig. 7(a) shows some spherical particles of different sizes with a low porous surface, covered with irregularly shaped small particles. Fig. 7(b) shows the sample after bioleaching at the same magnification (×600) in which the particles have a washed and polished surface with higher porosity. The significant increase in porosity of the surface of bioleached sample and also disintegration of some of the particles, accounts for sufficient mobilization of the metals from PPR ash to the solution phase in result of bioleaching. The distinctive differences in surface morphology of the sample before and after bioleaching in a higher magnification (×6.00k) have been comparatively shown in Fig. 7(c) and (d).
 |
| Fig. 7 FE-SEM images of: (a) and (b) distribution of the particles and their morphology before and after bioleaching at ×600 magnification; (c) and (d) surface morphology of the particles before and after bioleaching at ×6.00k magnification. | |
3.8. Toxicity evaluation tests of PPR ash
The results of TCLP tests for PPR ash before and after bioleaching were compared with the recommended acceptance criteria for disposal set by U.S. EPA and NEA presented in Table 5. The results showed that before bioleaching the metals concentrations exceeded the regulatory levels for disposal of industrial wastes, indicating that PPR ash used in this study can be listed as hazardous waste and must be treated before disposal, while after bioleaching V, Ni and Fe concentrations reduced to below the regulatory values. Thus the bioleached PPR ash can be safely disposed or reused in other industries.
Table 5 TCLP test results for PPR ash before and after bioleaching
Element |
Metal concentration (mg L−1) |
PPR ash |
Bioleached PPR ash |
Regulatory levels |
Standard for pollution control on the security landfill site for hazardous wastes, National Environmental Agency. Treatment standards for hazardous wastes (U.S. EPA). |
V |
1386.9 |
18.0 |
200a |
Ni |
389.2 |
5.6 |
5a |
11b |
Fe |
2491.0 |
41.7 |
100a |
3.9. Comparison of bioleaching versus chemical leaching
Chemical leaching experiments were performed using mixture of commercial organic acids at the same concentrations as maximum amount produced by Penicillium simplicissimum (citric 5237 ppm, gluconic 3666 ppm, oxalic 1287 ppm and malic acid 188 ppm) and Aspergillus niger (8080 ppm, gluconic 2126 ppm, oxalic 1170 ppm and malic acid 1251 ppm) in pure cultures. The leaching condition was similar to optimum pulp density and bioleaching condition obtained for both of the fungi. The results for chemical leaching of V and Ni at two different conditions, above mentioned, have been presented in Table 6. Bioleaching using Penicillium simplicissimum compared with chemical leaching increased V and Ni recovery from 79% and 37% (chemical leaching) to 90% and 49% (bioleaching), respectively. The metal recovery yields obtained for Aspergillus niger were higher than Penicillium simplicissimum and it also improved chemical leaching of V and Ni up to 15% and 8%, respectively. The results confirmed that fungal leaching using spent-medium leaching method was more effective than chemical leaching. The most important reason for prevailing of bioleaching over chemical leaching is presence of other fungal metabolites in addition to citric, gluconic, oxalic and malic acids in biomass free spent-medium which play a significant role in the recovery of V and Ni. These unidentified fungal metabolites affect the leaching efficiency through making more soluble complexes with the metals.
Table 6 Chemical leaching test results of PPR ash
Fungus |
Organic acid concentration (ppm) |
pH |
Leaching temperature (°C) |
Pulp density (g L−1) |
V recovery (%) |
Ni recovery (%) |
Aspergillus niger |
Citric (8080) |
1.70 |
60 |
32.2 |
82 |
42 |
Gluconic (2126) |
Oxalic (1170) |
Malic (1251) |
Penicillium simplicissimum |
Citric (5237) |
1.75 |
60 |
29.2 |
79 |
37 |
Gluconic (3666) |
Oxalic (1287) |
Malic (188) |
4. Conclusion
Simultaneous extraction of V and Ni from a power plant residual ash by Aspergillus niger and Penicillium simplicissimum was optimized using BBD-RSM. Fungal growth investigation revealed that Penicillium and Aspergillus produced maximum amount of organic acids during 15 and 14 days of fermentation, respectively. Spent-medium bioleaching was the most effective method to be optimized for recovery of metals. Maximum recovery of V (97%) and Ni (50%) was obtained under optimal condition of 32.2 g L−1 pulp density, 60 °C leaching temperature and minimum leaching duration of 7 days using Aspergillus. According to TCLP tests, after bioleaching V, Ni and Fe concentrations in the waste reduced to below the regulatory levels for disposal, so the bioleached ash can be safely disposed or reused in other industries. In addition results showed that bioleaching was more effective than chemical leaching.
References
- M. A. Al-Ghouti, Y. S. Al-Degs, A. Ghrair, H. Khoury and M. Ziedan, Chem. Eng. J., 2011, 173, 191–197 CrossRef CAS.
- M. Al-Malack, A. Bukhari, O. Al-Amoudi, H. Al-Muhanna and T. Zaidi, Int. J. Environ. Res., 2013, 7, 455–466 CAS.
- M. V. Tsygankova, V. I. Bukin, E. I. Lysakova, A. G. Smirnova and A. M. Reznik, Russian Journal of Non-Ferrous Metals, 2011, 52, 19–23 CrossRef.
- A. Bharadwaj and Y.-P. Ting, Bioresour. Technol., 2013, 130, 673–680 CrossRef CAS PubMed.
- D. Mishra, D. J. Kim, D. E. Ralph, J. G. Ahn and Y. H. Rhee, Hydrometallurgy, 2007, 88, 202–209 CrossRef CAS.
- S. L. Tsai and M. S. Tsai, Resour., Conserv. Recycl., 1998, 22, 163–176 CrossRef.
- C. Zhu, L. Liu, M. Fan, L. Liu, B. Dai, J. Yang and D. Sun, RSC Adv., 2014, 4, 55044–55047 RSC.
- M. Chen, J. Wang, J. Huang and H. Chen, RSC Adv., 2015, 5, 34921–34926 RSC.
- F. Amiri, S. M. Mousavi and S. Yaghmaei, Sep. Purif. Technol., 2011, 80, 566–576 CrossRef CAS.
- D. Santhiya and Y. P. Ting, J. Biotechnol., 2005, 116, 171–184 CrossRef CAS PubMed.
- S. Biswas and K. Bhattacharjee, Sep. Purif. Technol., 2014, 135, 100–109 CrossRef CAS.
- F. Amiri, S. Yaghmaei and S. Mousavi, Bioresour. Technol., 2011, 102, 1567–1573 CrossRef CAS PubMed.
- I. Asghari and S. Mousavi, Rev. Environ. Sci. Biotechnol., 2014, 13, 139–161 CrossRef CAS.
- G. Natrajan and Y. P. Ting, Adv. Mater. Res., 2013, 825, 270–273 CrossRef.
- S. Feng, H. Yang and W. Wang, RSC Adv., 2015, 5, 98057–98066 RSC.
- H. Brandl, R. Bosshard and M. Wegmann, Hydrometallurgy, 2001, 59, 319–326 CrossRef CAS.
- T. J. Xu and Y. P. Ting, Enzyme Microb. Technol., 2004, 35, 444–454 CrossRef CAS.
- S. Y. Chen and P. L. Lin, Sep. Purif. Technol., 2010, 71, 178–185 CrossRef CAS.
- S. Biswas, R. Dey, S. Mukherjee and P. C. Banerjee, Appl. Biochem. Biotechnol., 2013, 170, 1547–1559 CrossRef CAS PubMed.
- P. P. Bosshard, R. Bachofen and H. Brandl, Environ. Sci. Technol., 1996, 30, 3066–3070 CrossRef CAS.
- S. C. Ferreira, R. Bruns, H. Ferreira, G. Matos, J. David, G. Brandao, E. P. da Silva, L. Portugal, P. Dos Reis and A. Souza, Anal. Chim. Acta, 2007, 597, 179–186 CrossRef CAS PubMed.
- K. Yetilmezsoy, S. Demirel and R. J. Vanderbei, J. Hazard. Mater., 2009, 171, 551–562 CrossRef CAS PubMed.
- S. Rastegar, S. Mousavi and S. Shojaosadati, Bioresour. Technol., 2014, 167, 61–68 CrossRef CAS PubMed.
- G. Annadurai and R. Sheeja, Bioprocess Eng., 1998, 18, 463–466 CrossRef CAS.
- M. I. Bajestani, S. Mousavi and S. Shojaosadati, Sep. Purif. Technol., 2014, 132, 309–316 CrossRef.
- M. Arshadi and S. M. Mousavi, Bioresour. Technol., 2014, 174, 233–242 CrossRef CAS PubMed.
- S. M. J. Mirazimi, F. Rashchi and M. Saba, Sep. Purif. Technol., 2013, 116, 175–183 CrossRef CAS.
- F. Amiri, S. M. Mousavi, S. Yaghmaei and M. Barati, Biochem. Eng. J., 2012, 67, 208–217 CrossRef CAS.
- D. Santhiya and Y. P. Ting, J. Biotechnol., 2006, 121, 62–74 CrossRef CAS PubMed.
- S. O. Rastegar, S. M. Mousavi and S. A. Shojaosadati, RSC Adv., 2015, 5, 41088–41097 RSC.
- K. F. Nielsen, J. M. Mogensen, M. Johansen, T. O. Larsen and J. C. Frisvad, Anal. Bioanal. Chem., 2009, 395, 1225–1242 CrossRef CAS PubMed.
- O. V. Singh and R. Kumar, Appl. Microbiol. Biotechnol., 2007, 75, 713–722 CrossRef CAS PubMed.
|
This journal is © The Royal Society of Chemistry 2016 |
Click here to see how this site uses Cookies. View our privacy policy here.