Green synthesis of zinc oxide nanoparticles and their effect on the stability and activity of proteinase K
Mansoore Hosseini Koupaeia,
Behzad Shareghi*a,
Ali Akbar Sabourybc,
Fateme Davar*d,
Aboulfazl Semnanie and
Mina Evinic
aDepartment of Biology, Faculty of Science, University of Shahrekord, P. O. Box. 115, Shahrekord, Iran. E-mail: b_shareghi@yahoo.com; Fax: +98 3832324419; Tel: +98 9131093764
bInstitute of Biochemistry and Biophysics, University of Tehran, Tehran, Iran
cCenter of Excellence in Biothermodynamics, University of Tehran, Tehran, Iran
dDepartment of Chemistry, Isfahan University of Technology, Isfahan, Iran 84156-83111. E-mail: davar@cc.iut.ac.ir
eDepartment of Chemistry, Faculty of Science, University of Shahrekord, Shahrekord, Iran
First published on 21st April 2016
Abstract
The use of environmentally benign materials for the synthesis of zinc oxide nanoparticles offers numerous benefits of eco-friendliness and compatibility for pharmaceutical, biotechnological and biological applications. In this paper, for the first time, we report on the use of coffee powder extract in the biosynthesis of ZnO nanoparticles. Furthermore, the effect of calcination time (at 600 °C) on the size of ZnO nanoparticles was investigated. The samples were characterized using transmission electron microscopy (TEM), scanning electron microscopy (SEM), energy dispersive X-ray spectroscopy (EDX) X-ray diffraction pattern (XRD), and Fourier transform infrared spectroscopy (FT-IR). Then, the influence of green synthesized ZnO nanoparticles calcined at 600 °C for 2 h on proteinase K was investigated. The enzyme activity of proteinase K showed that ZnO nanoparticles inhibited the activity of the enzyme and its thermal stability was increased by enhancing the concentration of nanoparticles. Far-UV circular dichroism (CD) studies showed that ZnO nanoparticles could change the secondary structure of proteinase K via increasing the content of the α-helix structure and decreasing the β-sheet. The fluorescence spectroscopic experiments revealed that ZnO nanoparticles had the ability to quench the intrinsic fluorescence of proteinase K through a static quenching procedure. The binding constant was determined using the Stern–Volmer equation. The thermodynamic parameters also indicated that the binding process was spontaneous and that hydrogen bonds and van der Waals forces played a major role in the interaction of ZnO nanoparticles with proteinase K.
1. Introduction
Most of the new physical and chemical methods employed for the synthesis of metal oxide nanoparticles use organic solvents and toxic reducing and chelating agents, thereby threatening the environment and limiting nanoparticle applications in biomedical, biotechnological, environmental, biological, and some industrial areas. Thus, the use of suitable and biocompatible processes for the preparation of metal oxide nanoparticles has received significant attention. These processes are classified in green chemistry.1–4Using plant extracts in the green synthesis of nanoparticles is one of the cleanest, biocompatible, nontoxic and eco-friendly methods used for large-scale production.5,6 Polyol components present in plant extracts such as coffee powder extract can act as chelating and capping agents for rapid biosynthesis of nanoparticles and stabilize the metallic nanoparticles formed.7 Literature review revealed that few studies have reported on the synthesis of some metal and metal oxide nanoparticles such as silver, ferric, copper oxide, gold, copper, palladium, etc. via a green route using different kinds of coffee powder and tea leaf extract,3,7–12 but none of them has focused on the synthesis of zinc oxide nanoparticles.
Metal oxide nanoparticles, especially the oxides of transition metals, are of interest because of their unique properties in medicine, biology, sporting, equipment, cosmetics, electronics, magnetic storage media, solar energy transformation, and other industries.13–16 Among the metal oxide nanoparticles, zinc oxide is interesting because of its numerous applications in optics, magnetism and gas sensing, showing high catalytic efficiency, strong adsorption ability, wastewater treatment, and antimicrobial activities, as well as acting as a fungicide and anti-bacterial agents.17–23 Overall, ZnO nanoparticles have been studied in different pharmaceutical, biological and industrial applications, but their interaction with enzymes and their effect on the stability, activity and structure of various enzymes should be studied in more details. Therefore, in this study, the interaction between green synthesized ZnO nanoparticles and proteinase K (as a model enzyme) was investigated.
Proteinase K (endopeptidase K; EC. 3.4.21.14), a typical member of subtilisin-like serin protease family from fungus Tritirachium album limber, has been named for its keratin hydrolyzing activity.24 Proteinase K is a monomeric protein with 278 amino acid residues, and 28![[thin space (1/6-em)]](https://www.rsc.org/images/entities/char_2009.gif) 930 dalton molecular mass.20 Proteinase K is one of the most active serin endopeptidase among the known proteases with high activity and stability in a pH range from 3 to 11; also, its maximal activity is in the pH range of 7.5 to 12.26,27
930 dalton molecular mass.20 Proteinase K is one of the most active serin endopeptidase among the known proteases with high activity and stability in a pH range from 3 to 11; also, its maximal activity is in the pH range of 7.5 to 12.26,27
In the active site of the enzyme, the catalytic triad of His 69, Ser 224 and Asp 39 hydrolyzes peptidic and steric bonds.28 The activity of proteinase K has been measured using the synthetic substrate ρ-nitrophenyl acetate. Hydrolysis of ρ-nitrophenyl acetate by proteinase K was found to release ρ-nitrophenol that could be monitored by the change in absorbance at 405 nm.26
The molecular structure of proteinase K consists of α mixed and β rich regions classified as α/β protein.25 Subtilisin family enzymes have important applications in biological and industrial areas as protein degrading components in laundry powders, food processing industry and medicine for the preparation of proteolytic creams and collagen implants. In addition, proteinase K rapidly inactivates RNase and DNases, providing high purity DNA and RNA in nucleic acid preparations.29,30 This enzyme has been used in researches on prions in Transmissible Spongiform Encephalopathy (TSE) and the proposed diagnostic tests have utilized proteinase K digestion of proteins from brain tissue samples.31
In spite of industrial and biological applications of proteinase K, the effect of ZnO nanoparticles on the stability, activity and structure of this enzyme needs more detailed studies. Such studies would help to understand the relationship between the changes in activity and structural changes in serin proteases with the α/β structures, as commonly found in subtilisin family. However, as mentioned before, for the first time, in the present work, attempts were made to utilize the coffee powder extract for the synthesis of zinc oxide nanoparticles. To continue, in the present study, we have investigated the effect of as-synthesized ZnO nanoparticles on the thermal stability, enzyme activity and secondary structure of proteinase K as a model enzyme by using different spectroscopic techniques such as UV-Vis spectroscopy, fluorescence and circular dichroism (CD) studies. Furthermore, the quenching constants and thermodynamic parameters were calculated and the forces playing a major role in the interaction of ZnO nanoparticles with proteinase K were also suggested.
2. Materials and methods
2.1 Materials
Proteinase K from Tritirachium album (EC. 3.4.21.14) and ρ-nitrophenyl acetate were purchased from Sigma Aldrich Co. Tris–HCl buffer and methanol was also bought from Sigma-Aldrich Co. Proteinase K was dissolved in Tris–HCl buffer (50 mM, pH = 8) before using and stored at a temperature less than 4 °C. The stock solution of ρ-nitrophenyl acetate, which was used as the proteinase K substrate, was prepared in methanol and deionized water on the same day. Zinc acetate·2H2O, which was used as a precursor, was obtained from Merck, Germany.2.2 Synthesis of ZnO nanoparticles
Coffee powder (Arabica coffee-hamwi cafe/Damascus) extract was used to produce ZnO nanoparticles. 10 g of coffee powder was dissolved in 100 ml of distilled water and boiled under constant stirring using a magnetic stirrer for around 3 h. After cooling, the extract was centrifuged twice for 10 min at 4500 rpm and the supernatant was filtered using Watman filter paper and stored at 4 °C for the green synthesis of ZnO nanoparticles.0.1 M aqueous solution of zinc acetate was used as the precursor. The composition of precursor (Zn2+ solution) and the coffee extract in 1![[thin space (1/6-em)]](https://www.rsc.org/images/entities/char_2009.gif) :
:![[thin space (1/6-em)]](https://www.rsc.org/images/entities/char_2009.gif) 1 volume ratio were prepared by adding the coffee powder extract drop by drop to zinc acetate solution, with constant stirring at 70–80 °C. As the solution started evaporating at the end of the process, the as-obtained viscous gel was loaded into the oven (at 90 °C) to produce a black color powder. Then, it was calcined in alumina crucible and heated at 600 °C in different times (1, 2 and 3 h). The obtained white precipitates were characterized with different methods.
1 volume ratio were prepared by adding the coffee powder extract drop by drop to zinc acetate solution, with constant stirring at 70–80 °C. As the solution started evaporating at the end of the process, the as-obtained viscous gel was loaded into the oven (at 90 °C) to produce a black color powder. Then, it was calcined in alumina crucible and heated at 600 °C in different times (1, 2 and 3 h). The obtained white precipitates were characterized with different methods.
2.3 Characterization techniques
The crystal size and phase of the synthesized powders prepared by coffee powder extract were analyzed using the powder X-ray diffraction (XRD) method on a D-max C III X-ray diffractometer (X Pert. Pro, Philips, Holland), through Ni-filtered Cu Kα radiation (λ = 0.15406 nm) over the range of 2θ = 10 to 80°.The morphology and size were observed using a field-emission scanning electron microscope on Tescan mira3 (Czech) equipped with an energy dispersive X-ray spectroscopy (EDX). The chemical purity of the samples was examined by EDX. Before taking the SEM images, the samples were coated by a very thin layer of Au to make the sample surface conducting and prevent charge accumulation, thereby obtaining a better contrast. Information on mean size and distribution were obtained by measuring the particle size of more than 100 nanoparticles. Transmission electron microscopy (TEM) images were obtained on a Philips EM208 (Holland) with an accelerating voltage of 150 kV.
The absorption properties of the synthesized nanoparticles were investigated at room temperature by Fourier transform infrared spectroscopy (FT-IR), which was recorded on JASCO 680 plus spectrophotometer in KBr Pellets.
2.4 Kinetic measurements
The enzyme activity of proteinase K was assayed using a UV-Vis spectrophotometer equipped with a thermostatic cell holder (model Pharmacia Biotech). Proteinase K was dissolved in Tris–HCl 50 mM with pH = 8 to prepare a stock solution (0.1 mg ml−1). A stock solution of ρ-nitrophenyl acetate in methanol and distilled water (5 mM) was used as the enzyme substrate at different fixed concentrations of 0.2 to 1.25 mM. Proteinase K activity was measured at 6 different concentrations of substrate and the assays were repeated at least 3 times. In fact, the activity of proteinase K was monitored by UV-Vis spectrophotometer at 405 nm, pH = 8, and the temperature of 35 °C, in the absence and presence of different concentrations of green synthesized ZnO nanoparticles suspended in deionized water and mixed ultrasonically before use. Care was taken to use similar experimental conditions to keep the enzyme reaction linear. To determine the enzyme kinetic parameters (Michaelis constant and maximum velocity), we determined the initial velocities of soluble enzyme samples during the first 10 s of reaction.322.5 Thermal stability measurements
All stability studies were carried out in quartz cells containing 0.1 mg ml−1 proteinase K and different concentrations of green synthesized ZnO nanoparticles suspension. In fact, the thermal denaturation curves of the enzyme were made in a Pharmacia Biotech UV-Vis spectrophotometer equipped with a temperature control unit from 293 to 373 K and at 280 nm, with a heating rate of 1 K min−1.2.6 Fluorescence spectra assay
Fluorescence measurements were carried out on a Shimadzu RF-5301PC Fluorescence spectrophotometer equipped with a constant temperature cell holder. Enzyme concentration used was 0.1 mg ml−1 in Tris–HCl buffer (50 mM, pH = 8). The fluorescence spectrum was measured from 290 to 450 nm with the excitation wavelength of 278 nm. The widths of the excitation slit and emission slit were set at 3 nm and 5 nm, respectively. The samples were prepared by mixing a solution of enzyme with different concentrations of ZnO nanoparticles and fluorescence spectra were recorded on 298 K and 308 K; also, the buffer was collected as backgrounds in the same temperature region.2.7 Circular dichroism measurements
Circular dichroism (CD) spectra were recorded using an Aviv model 215 spectropolarimeter (Lakewood, NJ, USA). All samples were prepared in the absence and presence of different concentrations of synthesized ZnO nanoparticles (0, 37.5 and 87.5 μM) with the constant concentrations of proteinase K (0.15 mg ml−1). Conformational changes in the secondary structure of the enzyme were monitored in the far UV region between 200 and 260 nm and in a 0.1 cm light path quartz cell.The results were expressed in molar ellipticity [θ] (deg cm2 mol−1) based on the mean amino acid residue weight (MRW) of 103.6 for proteinase K with a molecular weight of 28.93 kDa. The mean residue weight for the peptide bond was calculated from MRW = M/(N − 1), where M was the molecular mass of the polypeptide chain (in Da), and N was the number of amino acids in chain; the number of peptide bond was N − 1. The molar ellipticity was determined as ([θ]λ = θobs × 100 × MRW/cL), where c was the protein concentration in mg ml−1, L was the light path length in centimeters, and θ was the measured ellipticity in degree.33,34 The secondary structure of the protein was determined using the statistical method of CDNN CD software.35,36
In all experimental procedures, the solution was secured for 15 min before scan to equilibrate the sample solution fully.
3. Results and discussion
3.1 Oxide characterization
The XRD patterns of the samples at different calcination time (Fig. 1) showed the good crystallinity of the products. The all patterns could be indexed to the hexagonal phase of zinc oxide (JCPDS file no. 076-0704). No other peaks of impurities could be detected in all XRD patterns. The crystallites size of as-synthesized ZnO particles could be estimated by the peak broadening of the peaks in the XRD pattern. This was done according to the Scherrer formula (eqn (1)).37
 | (1) |
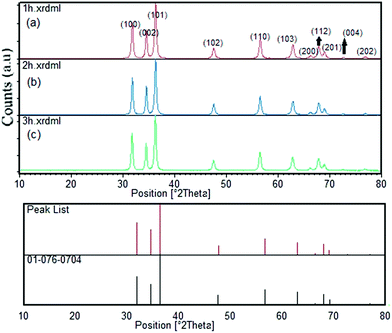 | ||
| Fig. 1 XRD pattern of ZnO nanoparticles synthesized from coffee powder extract calcined at 600 °C for different times ((a) 1 h, (b) 2 h and (c) 3 h calcination time). | ||
The ZnO nanoparticles calcined at different times were studied by FE-SEM images (Fig. 2). The particle size distribution of samples at different calcination times is shown in Fig. 2. From Fig. 2 it could be seen that the sample synthesized at 2 h calcination time possesses a relatively narrow size distribution in the range of 20 to 38 (Fig. 2b). The particle size distribution of the sample calcined at 1 and 3 hours is shown in Fig. 2a and c. The particle size distribution of these samples was in the range of 18 to 35 nm and 20 to 38 nm, respectively. As shown in Fig. 2a–c, particle size distribution values of nanoparticles were found to be increased with an increase in the calcination time.
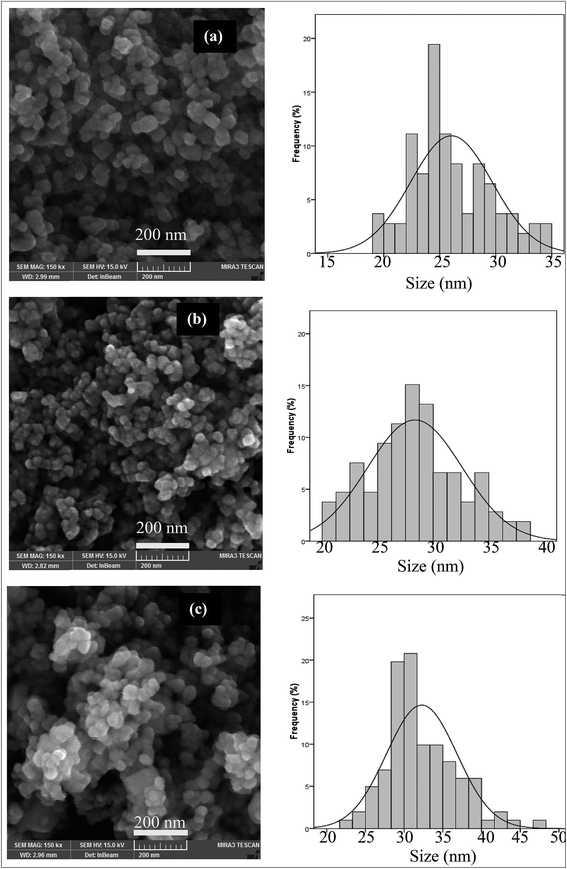 | ||
| Fig. 2 FE-SEM and particle size distribution histograms of the ZnO nanoparticles prepared at different calcination times at 600 °C ((a) 1 h, (b) 2 h and (c) 3 h). | ||
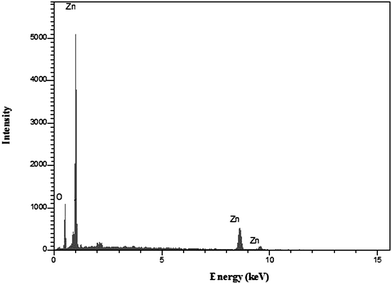
The EDX analysis was employed to determine the composition of ZnO nanoparticles calcined for 2 hour in 600 °C. As shown in Fig. 3, only zinc and oxygen elements existed in the product. No other elements could be detected, indicating the high purity of as-obtained ZnO nanoparticles. This result was in good agreement with XRD analysis.
The TEM image of ZnO nanoparticles calcined for 2 h in 600 °C is shown in Fig. 4. The ZnO nanoparticles had a hexagonal shape (as shown in Fig. 4b) and the average size of nanoparticles was around 28–46 nm in size, which was in a relatively good agreement with the crystallite size of XRD patterns.
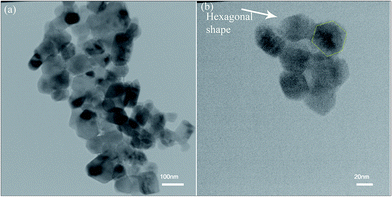 | ||
| Fig. 4 (a and b) TEM images of ZnO nanoparticles calcined at 600 °C for 2 h at different magnifications. | ||
The FT-IR spectroscopy was used to characterize as-synthesized ZnO nanoparticles calcined at 600 °C for 2 h. The FT-IR measurements of the synthesized precipitates before and after calcination were carried out to identify the probable biomolecules responsible for the capping/chelating of as-synthesized ZnO nanoparticles (Fig. 5a and b). The FT-IR spectra of uncalcined precipitates (Fig. 5a) displayed a number of absorption peaks, reflecting the complex nature of the coffee powder extract. The broad peak around 3400 cm−1 could be attributed to ν(OH) stretching of the phenolic group or different carboxylic acids of coffee (citric acid, chlorogenic acid and caffeic acid).44 The peak around 1600 cm−1 could be attributed to the C![[double bond, length as m-dash]](https://www.rsc.org/images/entities/char_e001.gif) C ring stretching in polyphenols or asymmetric stretching vibration of –COOH, and that around 1400 cm−1 corresponded to the (in-plane) bending vibrations of –OH in phenols or symmetric stretching vibration of –COOH functional group. On the other hand, the peak around 1000 cm−1 represented the presence of C–O stretching frequency. FTIR of these peaks suggested the presence of organic components from the coffee powder extract.3,8,42
C ring stretching in polyphenols or asymmetric stretching vibration of –COOH, and that around 1400 cm−1 corresponded to the (in-plane) bending vibrations of –OH in phenols or symmetric stretching vibration of –COOH functional group. On the other hand, the peak around 1000 cm−1 represented the presence of C–O stretching frequency. FTIR of these peaks suggested the presence of organic components from the coffee powder extract.3,8,42
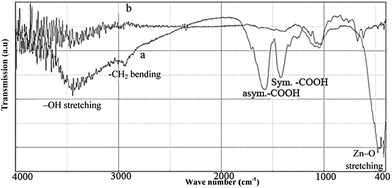 | ||
| Fig. 5 FT-IR spectrums of the synthesized precipitate using coffee powder extract. (a) Before, and (b) after calcined at 600 °C for 2 hours (asym. = asymmetric, sym. = symmetric). | ||
The FT-IR spectra of the white powder produced after calcination at 600 °C for 2 h (Fig. 5b) exhibited strong absorption bands around 410–480 cm−1, confirming the Zn–O stretching frequencies. Furthermore, the peaks intensity of –COOH group in 1400–1600 cm−1 was relatively reduced, indicating the removal of the organic compound from ZnO nanoparticles. The organic compound in plant extract could stabilize nanoparticles by the surface bound by their organic compounds.43 The citric acid, chlorogenic acid and caffeic acid were the active ingredients of coffee.44 The COOH group of these acids had a good tendency to be coordinated by zinc ions, thereby stabilizing ZnO nanoparticle and preventing them from being agglomerated.45 It should be mentioned that the phenolic ingredient of coffee extract was used for the synthesis of some metallic nanoparticles (as the reducing agent3,8,44) and thus, played a minor role in the stabilization of ZnO nanoparticles in this study.
In our green synthesis of ZnO nanoparticles, the coffee powder extract was used for the synthesis and capping/chelating of nanoparticles. As a result, in this method, we did not use any chemical agent, surfactant, etc. for the synthesis of ZnO nanoparticles. Therefore, green synthesized ZnO nanoparticles (calcined at 600 °C for 2 h) were chosen for the study of activity, thermal stability and structural changes of proteinase K (as a model enzyme).
3.2 Kinetic parameters of proteinase K in the presence of ZnO nanoparticles
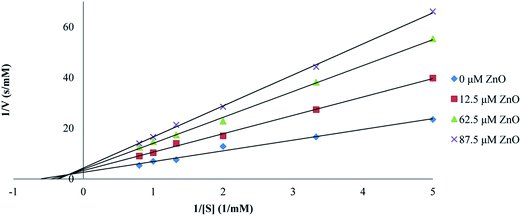
The effect of synthesized ZnO nanoparticles on the activity of proteinase K was examined after the incubation of enzyme for 15 min at different concentrations of ZnO nanoparticles. The substrate used at a probe for the hydrolytic activity was ρ-nitrophenyl acetate and experiments were performed in Tris–HCl buffer (pH = 8) at the temperature of 25 °C and 0.025 mg ml−1 enzyme concentration. ρ-Nitrophenyl acetate, as the substrate, was preferred to a polypeptide because ρ-nitrophenyl acetate was not chelated to transition metal ions; as a result, we could see the effect of Zn2+ on proteinase K itself (rather than on the substrate). ZnO nanoparticles were found to inhibit the hydrolysis activity of proteinase K. The double reciprocal Lineweaver–Burk plot for the activity of proteinase K was assayed as the hydrolysis of ρ-nitrophenyl acetate, in the presence of different fixed concentrations of ZnO nanoparticles, as shown in Fig. 6. This plot showed a set of straight lines revealing that the maximum velocity (V′max) values were decreased by the increase in ZnO nanoparticles concentrations, but the apparent Michaelis constant (K′m) values were increased, indicating a mixed type inhibition of ZnO nanoparticles. The values of K′m at any concentration of ZnO nanoparticles were obtained from Fig. 6 and re-plotted versus the concentrations of nanoparticles, namely, a secondary plot in Fig. 7, which gave the inhibition constant (Ki) from the abscissa-intercepts (−Ki). The Ki value for ZnO nanoparticles was 95.07 μM. The small value showed that ZnO nanoparticles were strongly bound to the enzyme.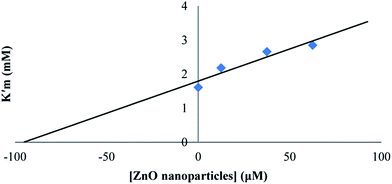 | ||
| Fig. 7 The secondary plot for proteinase K activity, and the K′m at given concentrations of ZnO nanoparticles. | ||
3.3 Thermal stability of proteinase K
Thermal denaturation studies of proteinase K were recorded with 0.1 mg ml−1 concentration of the enzyme at pH = 8 in Tris–HCl buffer and in the absence and presence of different concentrations of ZnO nanoparticles. In fact, denaturation data were analyzed by supposing the two-state mechanism between the folded and unfolded states. The fraction of the denatured protein, FU, was calculated using the eqn (2).46,47
 | (2) |
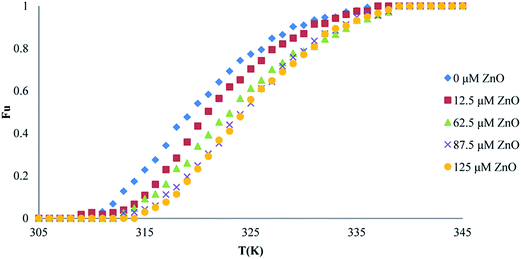 | ||
| Fig. 8 Thermal denaturation of proteinase K activity in the presence of different concentrations of ZnO nanoparticles. | ||
By assuming a two-state mechanism, the difference in Gibbs free energy between the folded and unfolded conformation (ΔG°U) could be given by eqn (3).46,47
 | (3) |
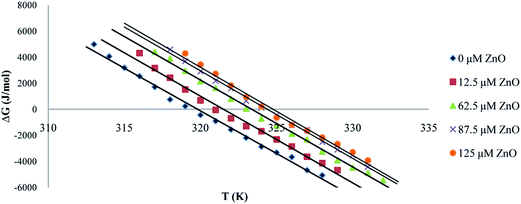 | ||
| Fig. 9 The plot of ΔG°U versus temperature in the presence of different concentrations of ZnO nanoparticles. | ||
These results could be used to determine Tm at which ΔG°U = 0, ΔS°m and ΔH°m. The standard-state entropy of transfer, ΔS°m, was obtained from the slope denaturation curves at Tm. The standard enthalpy was obtained from ΔH°m = TmΔS°m.46,47 Thermodynamic parameters at Tm, ΔS°m and ΔH°m in the presence of different concentration of ZnO nanoparticles have been listed in Table 1. It was obvious that by increasing the concentration of ZnO nanoparticles, the thermal stability of proteinase K was increased.
| [ZnO nanoparticles] (μM) | Tm (K) | ΔH°m (kJ mol−1) | ΔS°m (J mol−1 K−1) |
|---|---|---|---|
| 0 | 319.8 | 209.4 | 654.8 |
| 12.5 | 321.5 | 214.0 | 665.5 |
| 62.5 | 323.3 | 215.9 | 667.5 |
| 87.5 | 324.3 | 217.9 | 671.8 |
3.4 The secondary structure of proteinase K as observed by CD studies
CD spectroscopy has proved to be an ideal technique to monitor conformational changes in proteins which are as a result of changes in the experimental conditions, such as the binding of ligands.47 The far-UV CD spectra could characterize the secondary structure of proteins due to the peptide bond absorption, whereas the molar ellipticities at 222 nm ([θ]222) and 208 nm ([θ]208), or the ratio of [θ]208/[θ]222 have been typically used to show their α-helix content.46 In this work, the structural changes of proteinase K in the absence and presence of different concentrations of ZnO nanoparticles (0, 37.5 and 87.5 μM) are shown in Fig. 10.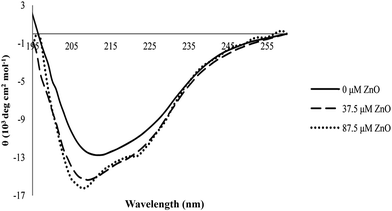 | ||
| Fig. 10 Circular dichroism of proteinase K in the absence and presence of various concentrations of ZnO nanoparticles. | ||
The content of secondary structure elements for proteinase K before and after interaction with various concentrations of ZnO nanoparticles was analyzed. The results are shown in Table 2. The shape of the CD spectra of proteinase K in the far UV range and the data in Table 2 showed that the enzyme contained both α-helix and β-sheet rich regions and the protein belonged to the α/β class, which was in agreement with its crystal structure.25
| [ZnO nanoparticles] (μM) | % α-helix | % β sheet | % random coil |
|---|---|---|---|
| 0 | 16.3 | 47.9 | 35.8 |
| 37.5 | 18.1 | 46.1 | 35.8 |
| 87.5 | 19.1 | 45.2 | 35.7 |
From Table 2, it could be seen that the change in the secondary structure of proteinase K had occurred in the presence of ZnO nanoparticles. For example, the ratio of the α-helix was increased by raising the concentration of ZnO nanoparticles, while the ratio of the β-sheet was decreased by raising the nanoparticles concentration and the ratio of random coils remained (almost) invariable with the increase in the concentration of nanoparticles.
3.5 Fluorescence quenching of proteinase K
Fluorescence of the protein is caused by three intrinsic fluorophores present in the protein structure: tryptophan, tyrosine and phenylalanine residues. Due to the very low quantum yield of phenylalanine and tyrosine, normally, fluorescence of tryptophan residue has been investigated in researches.48,49 Binding of a ligand to a protein may directly affect the fluorescence of a tryptophan residue by acting as a quencher or physically interacting with fluorophore, thereby changing the polarity of its environment and/or its accessibility to solvents. Both direct and generalized effects may result either in the enhancement or quenching of fluorescence and/or red or blue spectra shift.50Quenching can be divided into two broad categories: dynamic and static. Dynamic quenching is caused by diffusive collisions between the fluorophores and the quencher in the excited state and bi molecular quenching constants are increased with the temperature rise. In contrast, the static mechanism results in the formation of a ground-state complex between the fluorophores and the quencher; therefore, the stability and the values of static quenching constants are decreased with increasing the temperature.51,52
In order to reveal the forces responsible for the inactivation of proteinase K by ZnO nanoparticles, the intrinsic fluorescence of enzyme was studied in the presence of different concentrations of ZnO nanoparticles. Fluorescence spectroscopy could supply the information related to the binding between protein and other materials on the molecular level.53
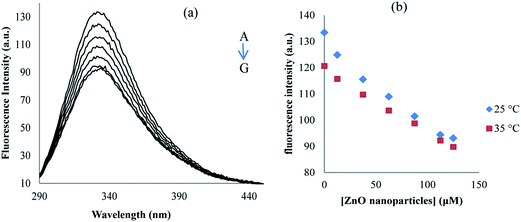
Proteinase K consisted of two tryptophans at positions 8 and 212, contributing the overall fluorescence emission. In this study, proteinase K solution was excited at 278 nm and the emission spectra were recorded between 290 and 450 nm at the temperatures of 25 and 35 °C, and in the absence and presence of different concentrations of ZnO nanoparticles (Fig. 11). As can be seen in Fig. 11, in the fluorescence intensity of proteinase K, the maximum emission was found at 334 nm and it was decreased regularly upon the addition of ZnO nanoparticles. Fig. 11 shows the quenching of proteinase K with increasing ZnO nanoparticles/proteinase K ratio; so, due to the interaction of the ZnO nanoparticles with proteinase K, the microenvironment of tryptophan residues and the proteinase K conformation were also changed.
In order to distinguish the fluorescence quenching mechanism, the fluorescence quenching data of proteinase K was analyzed using the Stern–Volmer equation (eqn (4)).54–56
 | (4) |
| Ksv = kqτ0 | (5) |
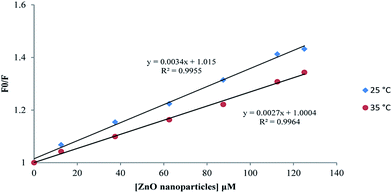 | ||
| Fig. 12 Stern–Volmer plot of proteinase K interaction with ZnO nanoparticles at the temperatures of 25 and 35 °C. | ||
| T (°C) | R2 | Ksv (×109 M−1) |
|---|---|---|
| 25 | 0.995 | 3.4 |
| 35 | 0.996 | 2.7 |
As described, fluorescence measurements showed that Trp fluorescence quenching during ZnO nanoparticles interactions with proteinase K followed a static quenching model. Hence, the following equation was employed to calculate the binding constant (KA) and the number of the binding sites (n).54,55
 | (6) |
According to eqn (6), a plot of  versus [Q] could be used to determine KA as well as n (Fig. 13). The binding data (KA and n) for proteinase K at two temperatures of 25 and 35 °C have been summarized in Table 4. It was found that the values of KA were decreased with the increase of temperature, which was in accordance with the trend of Ksv, as mentioned above. Therefore, the results proved that an unstable complex could be formed in the binding reaction and the complex would be dissociated with the temperature rise. The value of n was approximately 1, indicating that there was just a single binding site in proteinase K for ZnO nanoparticles. The dependence of binding constant on temperature indicated that a thermodynamic process was responsible for the formation of the complex. This dependence was, therefore, analyzed in order to better characterize the forces acting between ligand (ZnO nanoparticles) and protein (proteinase K).57
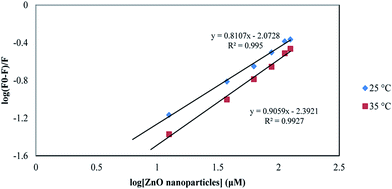 | ||
| Fig. 13 The plot of log[(F0 − F)]/F] vs. log[ZnO nanoparticles] for proteinase K at the temperatures of 25 and 35 °C. | ||
| T (°C) | KA (×109 M−1) | n | R2 | ΔH° (kJ mol−1) | ΔG° (kJ mol−1) | ΔS° (J mol−1 K−1) |
|---|---|---|---|---|---|---|
| 25 | 8.45 | 0.8 | 0.995 | −56.06 | −56.63 | −2.3 |
| 35 | 4.054 | 0.9 | 0.992 | −56.06 | −56.64 | −1.8 |
Essentially, there are four types of nano-covalent interactions stabilizing ligands bound to proteins: hydrogen bonds, electrostatic forces, van der Waals forces and hydrophobic interactions.58 The thermodynamic parameters (ΔG°, ΔH° and ΔS°) are very important for interpreting the binding modes. ΔG° reflects the possibility of reaction; ΔH° and ΔS° represent the main evidence determining the acting forces.36,59 It is assumed that when the change in interaction enthalpy (ΔH°) does not vary significantly over the temperature range studies, its value can be determined from the Van't Hoff equation (eqn (7)).36,59
 | (7) |
KA1 and KA2 are the equilibrium bonding constants at the corresponding temperatures, R is the gas constant, and T is the absolute temperature. The free energy change (ΔG°) for a binding interaction at different temperatures can be determined from the following relationship (eqn (8)).51
ΔG° = −RT![[thin space (1/6-em)]](https://www.rsc.org/images/entities/char_2009.gif) ln ln![[thin space (1/6-em)]](https://www.rsc.org/images/entities/char_2009.gif) K K
| (8) |
The entropy change (ΔS°) can be obtained from eqn (9).51
| ΔS° = (ΔH° − ΔG°)/T | (9) |
Table 4 shows the values of ΔH°, ΔG° and ΔS°. The negative value of ΔG° showed that the interaction process was spontaneous. The negative sign for enthalpy (ΔH°) and the entropy (ΔS°) of the interaction of ZnO nanoparticles and proteinase K indicated that the binding was mainly enthalpy stabilized and entropy destabilized. Hence, from the view point of the previous studies,60 the sign and magnitude of thermodynamic parameters could be associated with various individual kinds of interactions that might take place during protein association process. It could be concluded ΔH° < 0 and ΔS° < 0 indicated van der Waals and hydrogen bonds interactions between proteinase K and ZnO nanoparticles.
4. Conclusion
A completely green synthesis of ZnO nanoparticles using coffee extract was reported without using additional organic solvents and toxic reducing or chelating agents. The coffee ingredients had carboxylic acid (–COOH), phenol (–OH) functional groups. These compounds could act as chelating and capping agents for rapid biosynthesis and stabilization of ZnO nanoparticles. The use of plant extracts for the synthesis of nanoparticles offered the numerous benefits of eco-friendliness, cleanliness, biocompatibility, and large-scale production. Besides, green synthesized nanoparticles could be used in pharmaceutical, environmental, biotechnological, biological and industrial applications.In this research, first, ZnO nanoparticles were synthesized with coffee powder extract at different calcination times. The XRD results showed that with increasing calcination time from 1 to 3 h, the average crystal size was increased from 25.4 nm to 31.3 nm. Then, we demonstrated the effect of ZnO nanoparticles on the stability, activity and structure of proteinase K as a model protein. Our research showed that ZnO nanoparticles decreased the activity of proteinase K. In addition, the effect of ZnO nanoparticles on proteinase K stability was studied. The results also suggested that by increasing ZnO nanoparticles concentrations, the thermal stability of proteinase K could be increased. CD spectra also suggested that the α-helix content of proteinase K was increased, while the β-sheet content of enzyme was decreased with the addition of ZnO nanoparticles. The fluorescence spectroscopy results at two temperatures of 25 and 35 °C indicated that the structure of Trp residue environments was altered. It was also shown that the fluorescence of proteinase K had been quenched for reacting with ZnO nanoparticles. The quenching was a kind of static fluorescence one. The values of binding constant were decreased with increasing temperature, which was in accordance with the trend of Ksv. The thermodynamic parameters agreed with ΔG° < 0, ΔH° < 0 and ΔS° < 0. The negative sign for ΔG° showed that the interaction between ZnO nanoparticles and enzyme was spontaneous. ΔH° < 0 and ΔS° < 0 also revealed that van der Waals and hydrogen bonds predominated in this interaction.
In conclusion, the inhibition of proteinase K activity and the increase in the thermal stability of proteinase K with increasing nanoparticles concentrations were caused by the change of the secondary structure, as induced by the van der Waals and hydrogen bonds between enzyme and ZnO nanoparticles.
Acknowledgements
The financial support from Research Council of ShahreKord University is gratefully acknowledged. Authors highly acknowledge Mr Mohammad Hossein Hosseini (University of Tarbiat Modarres, Tehran, Iran) and Mrs Zahra Enteshari (Isfahan University of Technology, Isfahan, Iran) for help in nano synthesis.References
- S. Hiremath, C. Vidya, M. A. Lourdu Antonyraj, M. N. Chandraprabha, P. Gandhi, A. Jain and K. Anand, International Journal of Current Engineering and Technology, 2013, 1, 176–179 Search PubMed.
- Y. Abboud, T. Saffaj, A. Chagraoui, A. El Bouari, K. Brouzi, O. Tanane and B. Ihssane, Applied Nanosciencs, 2014, 4, 571–576 CrossRef CAS.
- P. Sutradhar, M. Saha and D. Maiti, J. Nanostruct. Chem., 2014, 4, 86–91 CrossRef.
- P. Mohanpuria, N. K. Rana and S. K. Yadav, J. Nanopart. Res., 2008, 10, 507–517 CrossRef CAS.
- M. Pattanayak and P. L. Nayak, Int. J. Plant, Anim. Environ. Sci., 2013, 3, 68–78 CAS.
- A. Iyer, S. Panchal, H. Poudyal and L. I. Brown, J. Biochem. Biophys., 2011, 46, 467–481 Search PubMed.
- G. Hoag, J. Collins, J. Holcomb, J. Hoag, M. Nadagoudab and R. Varma, J. Mater. Chem., 2009, 19, 8671–8677 RSC.
- Q. Sun, X. Cia, J. Li, M. Zheng, Z. Chen and C. P. Yu, Colloids Surf., A, 2014, 444, 226–231 CrossRef CAS.
- N. A. Begum, S. Mondal, S. Basu, R. A. Laskar and D. Mandal, Colloids Surf., B, 2009, 80, 113–118 CrossRef PubMed.
- M. N. Nadagouda and R. S. Varma, Green Chem., 2008, 10, 589–862 RSC.
- V. Smuleac, R. Varma, S. Sikdar and D. Bhattacharyya, J. Membr. Sci., 2011, 379, 131–137 CrossRef CAS PubMed.
- M. N. Nadagouda, A. B. Castle, R. C. Murdock, S. M. Hussain and R. S. Varma, Green Chem., 2009, 12, 114–122 RSC.
- C. D. Montferrand, L. Huc, I. Milosevic, V. Russier, D. Bonnin, L. Motte, A. Brioude and Y. Lalatonne, Acta Biomater., 2013, 9, 6150–6157 CrossRef PubMed.
- N. Ramgir, N. Datta, M. Kaur, S. Kailasaganapathi, A. K. Debnath, D. K. Aswal and S. K. Gupta, Colloids Surf., A, 2013, 439, 101–116 CrossRef CAS.
- S. B. Lovern, J. R. Strickler and R. Klaper, J. Environ. Sci. Tech., 2007, 41, 4465–4470 CrossRef CAS.
- N. Lu, Z. Zhu, X. Zhao, R. Tao, X. Yang and Z. Gao, Biochem. Biophys. Res. Commun., 2008, 370, 675–680 CrossRef CAS PubMed.
- X. Wang, J. Lu, M. Xu and B. Xing, Environ. Sci. Technol., 2008, 42, 7267–7272 CrossRef CAS PubMed.
- C. Y. Hsu, T. F. Ko and Y. M. Huang, J. Eur. Ceram. Soc., 2008, 28, 3065–3070 CrossRef CAS.
- J. M. Yousef and E. N. Danial, J. Health Sci., 2012, 2, 38–42 Search PubMed.
- R. Salehi, M. Arami, N. M. Mahmoodi, H. Bahrami and S. Khorramfar, Colloids Surf., B, 2010, 80, 86–93 CrossRef CAS PubMed.
- N. Bala, S. Saha, M. Chakraborty, M. Maiti, S. Das, R. Basu and P. Nandy, RSC Adv., 2015, 5, 4993–5003 RSC.
- J. Xiao, M. Wu, G. Kai, F. Wang, H. Cao and X. Yu, Nanomedicine: Nanotechnology, Biology and Medicine, 2011, 7, 850–858 CrossRef CAS PubMed.
- K. Ravichandran, K. Karthika, B. Sakthivel, N. JabenaBegum, S. Snega, K. Swaminathan and V. Senthamilselvi, J. Magn. Magn. Mater., 2014, 358–359, 50–55 CrossRef CAS.
- W. Ebeling, N. Hennrich, M. Klockow, H. Metz, H. D. Orth and H. Lang, Eur. J. Biochem., 1974, 47, 91–97 CrossRef CAS PubMed.
- K. D. Jany, G. Lederer and B. Mayer, FEBS Lett., 1986, 199, 139–144 CrossRef CAS.
- L. A. Stone, G. S. Jackson, J. Collinge, J. D. F. Wadsworth and A. R. Clarke, Biochemistry, 2007, 46, 245–252 CrossRef CAS PubMed.
- W. Bangning, H. Buxing and T. Fu, J. Therm. Anal., 1997, 50, 73–80 CrossRef.
- C. Betzel, S. Gourinath, P. Kumar, P. Kaur, M. Perbandt, S. Eschenburg and T. P. Singh, Biochemistry, 2001, 40, 3080–3088 CrossRef CAS PubMed.
- J. J. Panek, R. Mazzarello, M. Novic and A. Jezierska-Mazzarello, Mol. Diversity, 2011, 15, 215–226 CrossRef CAS PubMed.
- H. Hilz, U. Viegers and P. Adamietz, Eur. J. Biochem., 2008, 56, 103–108 CrossRef.
- D. Georgieva, W. Rypniewski, H. Echner, M. Perbandt, M. Koker and J. Clos, Biochem. Biophys. Res. Commun., 2004, 325, 1406–1411 CrossRef CAS PubMed.
- B. Karimi, S. Emadi, A. Asghar Safaria and M. Kermanian, RSC Adv., 2014, 4, 4387–4394 RSC.
- D. Lafitte, P. O. Tsvetkov, R. Devred, F. Barras, C. Briand, A. A. Makarov and J. Haiech, Biochim. Biophys. Acta, 2002, 1600, 105–110 CrossRef CAS.
- S. M. Kelly, T. J. Jess and N. C. Price, Biochim. Biophys. Acta, 2005, 1751, 119–139 CrossRef CAS PubMed.
- J. T. Yang, C. S. C. Wu and H. M. Martinez, Methods Enzymol., 1986, 130, 208–269 CAS.
- B. Ghalandari, A. Divsalar, A. A. Saboury, T. Haertle, K. Parivar, R. Bazl, M. Eslami-Moghadam and M. Amanlou, Spectrochim. Acta, Part A, 2014, 118, 1038–1046 CrossRef CAS PubMed.
- P. Scherrer, Mathematisch-physikalische Klasse, 1918, 2, 98–100 Search PubMed.
- M. J. Iqbal and R. A. Khan, J. Alloys Compd., 2009, 487, 847–852 CrossRef.
- O. Khamman, E. T. Saakonsri, E. A. Rujiwatra, E. Y. Laosiritaworn, E. R. Yimnirum and E. S. Ananta, J. Mater. Sci., 2007, 42, 8438–8446 CrossRef CAS.
- L. Shi, X. J. Fang, Z. L. Zhang, T. Zhu, D. Jiang, H. H. Wu and Z. X. Tang, Int. J. Food Sci. Technol., 2012, 47, 1866–1871 CrossRef CAS.
- X. Zhang, W. Wu and J. Chen, Funct. Mater., 2004, 35, 529–533 CAS.
- P. Sutradhar, N. Debnath and M. Saha, J. Adv. Manuf. Tech., 2013, 1, 357–361 CrossRef CAS.
- S. Iravani, Green Chem., 2011, 13, 2638–2650 RSC.
- M. R. Olthof, P. C. Hollman and M. B. Katan, Journal of Agriculture and Food Chemistry, 2002, 50, 5735–5741 CrossRef.
- A. Majedi, A. Abbasi and F. Davar, J. Sol-Gel Sci. Technol., 2015, 77, 542–552 CrossRef.
- B. Shareghi, S. Farhadian, N. Zamani, M. Salavati-Niasari and H. Moshtaghi, J. Ind. Eng. Chem., 2014, 21, 862–867 CrossRef.
- A. A. Saboury and A. A. Moosavi-Movahedi, Biochem. Educ., 1997, 23, 164–167 CrossRef.
- A. Divsalar, M. Razmi, A. A. Saboury, H. Mansouri-Torshizi and F. Ahmad, Cell Biochem. Biophys., 2015, 71, 1415–1424 CrossRef CAS PubMed.
- A. Divsalar, Z. Izadi, A. A. Saboury, M. Nabiuni, M. Razmi and H. Mansuri-Torshizi, J. Iran. Chem. Soc., 2013, 10, 951–959 CrossRef CAS.
- A. S. Ladokhin, Anal. Chem., 2000, 5762–5779 Search PubMed.
- M. Saeidifar, H. Mansouri-Torshizi and A. A. Saboury, J. Lumin., 2015, 167, 391–398 CrossRef CAS.
- Y. Sun, S. Wei, C. Yin, L. Liu, C. Hu, Y. Zhao, Y. Ye, X. Huc and J. Fan, Bioorg. Med. Chem. Lett., 2011, 21, 3798–3804 CrossRef CAS PubMed.
- W. R. Wang, R. R Zhu, R. Xiao, H. Liu and S. L. Wang, Biol. Trace Elem. Res., 2011, 142, 435–446 CrossRef CAS PubMed.
- B. Ghalandari, A. Divsalar, A. A. Saboury and K. Parivar, J. Iran. Chem. Soc., 2015, 12, 613–619 CrossRef CAS.
- S. Tabassum, W. M. Al-Asbahy, M. Afzal and F. Arjmand, J. Photochem. Photobiol., A, 2012, 114, 132–139 CrossRef CAS PubMed.
- B. Kumar Paul, K. Bhattacharjee, S. Bose and N. Guchhait, Phys. Chem. Chem. Phys., 2012, 14, 15482–15493 RSC.
- D. Divsalar, A. A. Saboury, L. Ahadi, E. Zemanatiyar and M. Mansouri-Torshizi, Biochemistry and Molecular Biology Reports, 2010, 43, 766–771 Search PubMed.
- Y. J. Hu, H. L. Yue, X. L. li, S. S. Zhang, E. Tang and L. P. Zhang, J. Photochem. Photobiol., A, 2012, 112, 16–22 CrossRef CAS PubMed.
- A. Divsalar, M. Razmi, A. A. Saboury and A. Seyedarabi, Anti-Cancer Agents Med. Chem., 2014, 14, 892–900 CrossRef CAS PubMed.
- L. Yang, D. Huo, C. Hou, M. Yang, H. Fa and X. Luo, Spectrochim. Acta, Part A, 2011, 78, 1349–1355 CrossRef PubMed.
| This journal is © The Royal Society of Chemistry 2016 |

