Spectroscopic tracking of mechanochemical reactivity and modification of a hydrothermal char

Michael T. Timko*a, Alex R. Maaga, Juan Mauricio Venegasa, Brendan McKeogha, Zhengyang Yanga, Geoffrey A. Tompsetta, Simón Escapaa, Joseph Totoa, Erin Heckleya and Frederick T. Greenawayb
aDepartment of Chemical Engineering, Worcester Polytechnic Institute, 100 Institute Rd, Worcester, MA 01609, USA. E-mail: mttimko@wpi.edu
bCarlson School of Chemistry and Biochemistry, Clark University, 950 Main St, Worcester, MA 01610, USA

Received 19th November 2015 , Accepted 17th January 2016

First published on 25th January 2016


Abstract

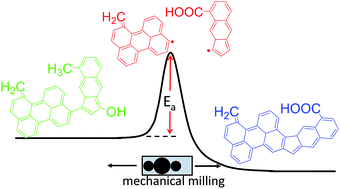
A glucose hydrothermal char (HTC) was synthesized and ball milled to break chemical bonds, generate defects, and form new chemical structures. To follow the chemical transformations, the physical, chemical, and structural characteristics of the milled HTC were studied using a variety of imaging and spectroscopic techniques. Scanning electron microscopy showed that milling initially induced agglomeration of HTC microspheres accompanied by a more gradual shift in particle shape from spherical to plate-like. The elemental composition of the synthesized HTC was comparable to lignite; ball milling converted the material to a more coal-like composition. Infra-red spectroscopy indicated increasing aromatic and carboxylic acid content after milling. Raman microspectroscopy indicated an increase in graphitization during ball milling and a decrease in edge sites. ESR measurements indicated the production of carbon radicals with ball milling that reached a maximum after 90 min. Based on these results, we outline a mechanism of mechanochemical HTC modification whereby weak aliphatic and ether bonds are cleaved to form edge sites bearing carbon radicals, which then recombine to form graphene basal planes. In the transition state, the surface composition of hydrothermal char is readily modified – here, we demonstrate introduction of carboxylic acids as surface oxygen groups.


Introduction

Hydrothermal chars (HTCs) are carbonaceous solids produced from the hydrothermal treatment of saccharides (glucose, sucrose, starch), polysaccharides (cellulose), or other carbonaceous precursor materials at temperatures in the 150 to 350 °C range under autogenous pressures.1 Chemically, HTCs are thought to form via parallel and serial hydrolysis, dehydration, and condensation reactions.2–4 Due to the low cost of feed materials5–9 and general process simplicity,10,11 HTCs have gained increasing interest in the most recent decade, and have been used to produce new materials for use as catalysts,12–16 electrocatalysts and materials for electrochemical devices,17–24 gas storage,23,25,26 water purification,27–30 energy storage,9,11,31,32 and soil amendments.33,34 Hu et al.35 and again more recently Titirici et al.36 reviewed the field, providing in-depth descriptions of the many applications under investigation for HTC. Funke and Ziegler10 reviewed the state of knowledge of hydrothermal carbonization from a chemical and processing engineering perspective. Berge et al.37 reviewed environmental applications of HTC.

The details of the structure remain the subject of some debate. HTC is thought to be composed of a complex supramolecular structure consisting of aromatic, furanic, and aliphatic sub-units.2,38,39 HTC contains approximately 25–30 wt% oxygen (dry mass) as carboxylic acids, furans, phenols, lactones, and similar compounds.40 When synthesized from nitrogen-containing precursors, the char may contain appreciable nitrogen content as well.41–45

Many applications of HTC require specific functionalization to optimize performance. For example, incorporation of surface-bound carboxylic acid groups has been demonstrated as a technique for increasing the metal cation adsorption capacity of hydrothermal char from <10 mg g−1 to as much as 600 mg g−1 – without increasing surface area.46 Likewise, Chen et al.47 reported that co-carbonization of watermelon peel and ammonium hydroxide resulted in a amine-functionalized HTC with 1000 mg g−1 adsorption capacity for the Pb(II) cation. Liu et al.48 showed that Fe(III)-loaded biomass could be pyrolyzed to produce carbon nanofibers with promise for energy storage, a technique with potential application in HTC synthesis. Unfortunately, existing functionalization methods are inefficient, use non-renewable co-reactants, or decorate external and internal surfaces indiscriminately.16,18,49,50 New techniques are required for environmentally benign and cost effective HTC functionalization.

A fundamental challenge in functionalizing HTC is poor understanding of its structure and reactivity that leads to use of excessive temperatures and co-reactant concentrations for its modification. Mechanochemistry51–53 has potential to provide understanding of HTC reactivity and functionalization. By subjecting the HTC particles to extreme yet localized temperatures and sheer rates, mechanochemical techniques should preferentially break the weakest bonds in the material.54 Monitoring bond breaking events would then provide insight into the relative reactivities of HTC bonds. Because mechanochemical methods are typically solvent-free,55,56 they can reduce the environmental burden imposed by the solvent itself and the energy penalty associated with recovering the products.

Mechanochemical modification of graphites, graphenes, and nanotubes has been reported in the literature.57–65 However, the similarities between these carbon types and HTC are minimal; graphitic materials are highly ordered, crystalline carbonaceous solid whereas HTC is an amorphous, defect-rich and dis-ordered material. Thus, while graphitic carbons have only a limited number of bond types that might break during milling, HTC has a wide range of bonds that might break and later re-form. To address this fundamental chemical knowledge gap and advance the field, we performed a series of ball-milling experiments on glucose-derived HTC66–68 and used SEM, elemental analysis, infra-red (IR) spectroscopy, Raman spectroscopy,69–71 and electron spin resonance (ESR)67,72 to track the concomitant physical, chemical, and structural changes. By performing the ball milling under air, we were able to increase the surface concentration of carboxylic acids without the use of expensive or environmentally objectionable co-reactants. This work advances the field by demonstrating a facile modification approach for hydrothermal char, complemented by a comprehensive spectroscopic study to investigate molecular-level details of HTC structure and reactivity.

Experimental

HTC preparation

HTC samples were prepared by mixing 39.6 g of glucose (BDI D+ glucose 99%) in 160 mL of DI water following the procedure described by Guo et al.12 The ESI provides photographs of the various stages of HTC synthesis (Fig. SI-1). The glucose solution (100 mL) was then sealed in a 160 mL PTFE-lined stainless steel autoclave and placed in an oven held at 180 °C for 5 hours. After 5 hours, the vessel was allowed to cool to room temperature overnight. The synthesized HTC was collected by filtration (Whatman #1 filter paper) and washed with three 40 mL aliquots of ethanol and water. Washing was completed after the filtration liquid remained clear. The HTC was then dried overnight in an oven at 80 °C. The dried HTC consisted of a dark brown solid (see ESI). This was then ground into a fine powder using a mortar and pestle and stored in air-tight glass vials until used.

Ball-milling protocol

The dried HTC (0.5 g) was placed in a stainless steel ball-milling vessel (10 mL) under atmospheric environment. Following the loading procedures recommended by the ball mill vendor (Retsch), 1/3 of the vessel was filled with HTC, 1/3 filled with grinding balls, and the last 1/3 left empty. Based on results reported by Immohr et al.,73 two 5 mm diameter stainless steel balls separated by one 10 mm diameter ball were placed in the vessel. The vessel was sealed to prevent leakage using a silicone rubber O-ring and wrapped with insulating tape. The vessel was loaded into a Retsch MM200 mixer mill and the sample was milled for the desired amount of time at an amplitude of 60 (on a scale from 0–100) and a frequency of 18 Hz. At these conditions, we measured a current draw of 1.2 A, corresponding to 130 W at 110 V. HTC materials were milled for 30, 60, 90, 120, 180, and 300 minutes. During this time, the milling vessel became hot to the touch, and we estimate that the external temperature of the vessel reached between 50 and 70 °C.

SEM analysis

SEM analysis was performed on a JSM-7000F SEM instrument using a LaB6 ion source. Samples were gold sputtered prior to imaging to improve their conductivity and mounted to the analysis stage using conductive carbon tape.

Elemental analysis and moisture analysis

Elemental analysis (CHONS) was performed by Leco Corporation using a combination of combustion instruments, both the Leco TruSpec CHNS Micro and the Leco CHNS 628. With the exception of synthesized HTC, the 2 instruments agreed to within their limits of uncertainty: ±0.3% for carbon, ±0.03% for hydrogen, and ±0.04% for nitrogen and sulfur. Mass balance always closed to within 4% or better. In all cases, samples were analyzed multiple times to verify reproducibility; 3 separate synthesized HTC samples (generated on different days using identical protocols) were analyzed along with milled HTC samples. As expected, sulfur concentration was always less than the instrument detection limits (0.04%). Nitrogen was higher than expected, but always less than 0.5%. Here, we report data only for CHO analysis.

Thermogravimetric analysis (TGA) was performed to determine HTC moisture content using a Netzsch (209 F1 Libra) TGA instrument. Argon purge gas (20 mL min−1) was used as the carrier and the linear temperature ramp was 10 °C min−1. Mass losses observed below 120 °C and after the mass loss rate had stabilized to less than 1% min−1 were counted as HTC moisture content.

DRIFTS and ATR-IR

Attenuated Total Reflectance Infrared (ATR-FTIR – Perkin Elmer; equipped with a "golden gate" diamond ATR accessory from Specac) spectroscopy and Diffuse Reflectance Infrared Transmission Spectroscopy (DRIFTS – Thermo Nicolet Magna 560 with a SpectraTech DRIFTS cell) were used to obtain IR spectra of the synthesized and ball milled HTC. Samples were analyzed over the range from 4000 to 400 cm−1, at a resolution of 2 cm−1, and an accumulation of 96 scans. Multiple scans were obtained for each sample and multiple samples were analyzed for the synthesized HTC and for each time point in the milling process. In all cases, we present data for averaged spectra. In practice, both ATR-IR and DRIFTS are appropriate for the entire scan range; in practice, we found that ATR-IR provided higher resolution spectra in the range 2400–600 cm−1 and DRIFTS provided higher resolution in the 4000–2000 cm−1 range; hence, we provide IR data from the appropriate instrument in the range where its spectral resolution is optimized.

X-ray diffraction

X-ray diffraction patterns were obtained using a Bruker X-ray diffractometer using CuKα radiation at 37.5 kV and 25 mA. A step size of 0.05° (2θ) was used with 1 second accumulation time.

Raman microspectroscopy

Raman spectra of synthesized and milled HTC were obtained using a Horiba XploRa Raman microspectrometer operating with a 532 nm laser line at a power of ∼10 mW. Spectra were obtained using a 5 second scan time and accumulations of 50 scans. An 1800-line grating was employed with an aperture of 100 and slit width of 300. Laser light was focused on the sample using a 100× lens (Olympus). All spectra were baseline corrected and normalized to the G peak intensity using LabSpec 6 software provided by Horiba. Magic plot (http://www.magicplot.com), a commercial software package, was used to fit the peaks contained in the spectra and all peaks were assumed to have either Lorentzian or Gaussian shapes. The full width at half maximum, areas and intensity values for the G, D1, D2, D3, and D4 bands were determined by fixing band positions based on work by Sadezky et al.74 and Beyssac et al.75 A similar fitting procedure is described in the ESI and used to examine the more comprehensive assignments recommended by Li et al.76

As noted by Beyssac et al.75 heterogeneous carbonaceous materials pose specific challenges for characterization using Raman microspectroscopy. Accordingly, we devoted substantial effort to error minimization. Each sample milling time was repeated at least three times to obtain representative statistics from multiple batches. Additionally, Raman spectra of each sample were obtained in three separate locations to ensure that the scans were representative (see ESI). Raman measurements were made as soon as possible after the material was removed from the ball mill, approximately 5 minutes afterwards.

ESR spectroscopy

Electron spin resonance (ESR) was used to measure free radical concentrations58 of synthesized and milled HTC using a Bruker EMX ESR spectrometer operating at 9.76 GHz. Spectra of powders in quartz EPR tubes (Norell) were obtained using a magnetic field of 3480 ± 40 Gauss using 100 kHz modulation, a sweep time of 3 min, and a time constant of 81 msec. To minimize instrumentally introduced line broadening, a microwave power of 0.2 mW, at which level the signal was not saturated, and a modulation amplitude of 0.1 Gauss were used. Raw ESR spectra were integrated twice to obtain the area under the absorption peak. The peak areas were normalized using the density of sample placed in the ESR tubes and compared with a standard Illinois #6 coal sample having a radical concentration of 6.8 × 10¹⁸ spins per gram.67 Spectra for 2–5 samples for each milling time were obtained from multiple batches to obtain representative data. All plotted data are the average of these measurements and error bars represent one standard deviation around the mean. Lineshapes were fit using the Bruker Simfonia software.

ESR measurements of radical content are quantitative, yet notoriously subject to errors of at least 10% when non-identical samples are compared.77,78 To reduce experimental uncertainties, spectra of multiple samples were obtained at each time point and the results averaged. Since we found that freshly milled HTC had up to 20% greater ESR signal compared to material that had been stored in an air-tight container for several weeks, the ESR measurements were performed within 10–20 min of milling. Our experimentally determined intensities for similar samples generated on different days show standard deviations ranging from 15–30% of the intensity, with greater errors for the samples with larger milling times. However, each set of daily measurements showed the same intensity maximum after 90 minutes milling. ESR measurements of samples in the absence of oxygen showed no significant differences in lineshape or intensity when compared to measurements performed in air (see ESI).

Results and discussion

We synthesized glucose HTC and ball milled it in air for 30–300 minutes. Samples were analyzed using SEM, elemental analysis, ATR-IR, DRIFTS, Raman microspectroscopy, and XRD. We present these results in this section. The following section provides a plausible mechanism to explain our results.

Particle size and morphology (SEM)

Fig. 1 contains representative micrographs obtained for synthesized and milled HTC. The ESI contains additional SEM micrographs. Consistent with literature reports,2 the synthesized HTC consists of uniform microspheres with an average diameter of approximately 200 nm. After 30 min of milling, the microspheres begin to coalesce into larger structures, with aggregate diameters of approximately 1 to 5 μm. Continued ball milling (60 min and 90 min, not shown) causes the aggregates to increase in size, and the general spherical shape of the initial microspheres begins to be lost. Finally, after 200 min, the morphology becomes more plate-like, with a wide range of characteristic sizes.
image file: c5ra24561c-f1.tif
Fig. 1 SEM images obtained for synthesized HTC and HTC milled for 30, 60 and 200 min. The scale bar is 1 μm in all images.

The initial observation of spherical particles is consistent with carbonization following an “emulsion polymerization” type mechanism (which yield spherical “latex” particles). Microsphere coalescence observed for short milling times makes physical sense as the milling provides sufficient energy to grind the microspheres into close contact, consistent with an annealing effect observed for graphite powders.62 Likewise, the increased particle size distribution is consistent with observations of ball milled graphite.62 On the other hand, literature on ball milling of graphite59 and graphene79 indicates formation of plate-like particles resembling the ones shown for HTC milled for 200 min in Fig. 1.

Bulk composition

Fig. 2 provides CHO composition results for synthesized HTC and milled HTC. The data in Fig. 2 have been corrected for the TGA measured moisture content of synthesized (0.8 ± 0.2 wt%) and ball-milled (1.2 ± 0.3 wt%) HTC. The synthesized HTC composition was measured to be 45.4 ± 0.3 mol% carbon, 15.4 ± 0.1 mol% oxygen, and 39.2 ± 0.7 mol% hydrogen – in good agreement with literature findings for glucose-HTC synthesized at 180 °C.2,80 With ball milling, the carbon content steadily production of plate-like particles resembling the ones shown for HTC milled for 200 min in Fig. 1 increased during the time studied (up to 300 min), whereas oxygen and hydrogen content steadily decreased.
image file: c5ra24561c-f2.tif
Fig. 2 CHO composition analysis of the synthesized HTC and milled HTC, corrected for measured moisture content. Error bars based on multiple analysis runs are smaller than the data points, and hence not visible in the figure.

Fig. 3 shows the elemental analysis data as a van Krevelen81,82 plot where the horizontal axis is the O/C atomic ratio and the vertical axis is the H/C ratio. Following van Krevelen's original methodology,81 we plot the HTC composition data along with ranges for biomass, peat, lignite, coal, and anthracite. Additionally, we show ranges reported in the literature39 for HTC and pyrolysis biochar synthesized from different biomass feedstocks. The synthesized HTC composition falls in the middle of the literature range for HTC and has a composition most comparable to lignite. With ball milling, the composition tends to lower H/C and O/C ratios, paralleling a transition from low-rank coals (lignite) to higher rank coal. At the same time, milling takes the initial HTC composition into the outer range associated in the literature with pyrolysis biochar.39 Taken together, Fig. 2 and 3 suggest that ball milling promotes a series of condensation reactions that act to reduce H/C and O/C, transforming the HTC into a more highly carbonaceous material that more closely approximates pyrolysis biochar or coal. Motivated by this observation, we sought to understand the molecular and structure basis of the elemental changes we observed.


image file: c5ra24561c-f3.tif
Fig. 3 van Krevelen plot for the synthesized and milled HTC materials. Ranges for various types of biomass, coal, and pre-coal materials are shown for ref. 81 ranges for HTC and pyrolysis biochars are shown.39

Functional group analysis (DRIFTS and ATR-IR)

The synthesized and milled HTC were characterized for functional group composition using ATR-IR and DRIFTS. Fig. 4 provides the ATR-IR results. Consistent with the literature,22,35,83,84 the initial HTC material contained C[double bond, length as m-dash]O, aliphatic C–H (2900–3000 cm−1), C–O (1030 cm−1), furanic (1520 cm−1), and C[double bond, length as m-dash]C (1600 cm−1) functional groups. With milling, the C[double bond, length as m-dash]O stretch at 1720 cm−1 becomes broader and begins to increase in magnitude within the first 30 min. At slightly delayed time scales compared to C[double bond, length as m-dash]O, the C[double bond, length as m-dash]C stretch present at 1600 cm−1 increases in magnitude; after 120 minutes, the aromatic C[double bond, length as m-dash]C stretch is a dominant feature in the ATR-IR spectra in Fig. 4. With milling, the furanic absorption band originally present in HTC decreases in magnitude, with the decreasing intensity starting at approximately 60 min. The C–O ether stretch starts as a minor peak in the HTC and either decreases in intensity or becomes buried by the more prominent nearby features with increasing milling time (vide infra).
image file: c5ra24561c-f4.tif
Fig. 4 ATR-IR spectra for synthesized and milled HTC.

Due to its complexity, the spectral region from 1300–1100 cm−1 merits separate discussion. Russo et al.83 reviewed the interpretation of the complex peaks present in the 1300–1100 cm−1 range for disordered carbonaceous materials, noting that the entire region can be assessed based on π electron density and their corresponding delocalization or mobility. In particular, Carpentier et al.85 attributed the peak present at 1300 cm−1 to defects at aromatic edges, such as aliphatic cross-linking and within the aromatic sp2 sheet as non-hexagonal rings. Fig. 4 shows that the 1300 cm−1 peak is initially present in the HTC; however, a broad new peak appears in the milled HTC samples at ca. 1200 cm−1 and this peak becomes the dominate feature in the 1300–1100 cm−1 region with increasing milling time. The peak at 1200 cm−1 obscures the aforementioned C–O ether stretch and may be attributed to aromatic C–H group modes,84 the presence of odd-carbon numbered rings,86 or the dehydrogenation/annealing of carbonaceous structures.83 Of these, the influence of odd-carbon numbered rings is to introduce buckling in extended fullerenic structures with hydrogen content less than about 0.1.87 Given that even the most highly ball-milled HTC samples studied here had H/C ∼ 0.5, we discount the attribution of the 1200 cm−1 peak to fullerene buckling and instead favor the aromatic C–H and dehydrogenation/annealing interpretations. Given that ball milling introduces localized extreme temperatures and strains, the dehydrogenation/annealing interpretation seems physically reasonable.

Fig. 5 contains DRIFTS data for synthesized and milled HTC. Additional spectra, focused specifically on the 3200–2800 cm−1 region, are provided in the ESI. Focusing first on the range from 3600–3100 cm−1, the broad absorption peak which we attribute to the OH stretch84 initially dominates the HTC DRIFTS spectrum. With milling, this peak diminishes in magnitude and is only a minor, albeit broad, peak after 120 min of milling. Our attribution of the 3600–3100 cm−1 peak to the OH stretch necessarily includes both organic hydroxyl groups as well as moisture; however, TGA moisture analysis actually found that the synthesized HTC had lower moisture content than milled HTC (0.8 ± 0.2 wt% compared to 1.2 ± 0.3 wt%). Therefore, the observed decrease in the 3600–3100 cm−1 band indicates that bound hydroxyl content of the HTC decreases with milling, consistent with the elemental composition data shown previously in Fig. 2 and 3.


image file: c5ra24561c-f5.tif
Fig. 5 DRIFTS spectra for synthesized and milled HTC.

The set of peaks present between 3000 and 2800 cm−1 is due to C–H stretches.83,84 We fitted these peaks to 3 Gaussian curves, using the fitting procedure recommended by Russo et al.83 as a starting point. The 3 peaks we used are centered at: 2870 cm−1 (symmetric CH3 stretch); 2930 cm−1 (asymmetric CH2 stretch); and 2960 cm−1 (asymmetric CH3 stretch). We take the DRIFTS data of the C–H stretch as further evidence of mechanochemical modification of HTC during ball milling and provide complete details in the ESI.

Carbon disorder (Raman microspectroscopy)

Raman spectra were obtained for the synthesized and milled HTC. Fig. 6 shows representative Raman spectra obtained for HTC, both for the synthesized material and for a sample ball milled for 2 hours. Fig. SI-4 provides Raman spectra obtained after 30, 60, 90, 120, and 300 min of ball milling. Consistent with Fig. 6, all HTC spectra obtained in this study show two broad maxima, one occurring at approximately 1580 cm−1, the other at approximately 1350 cm−1. Typical Raman studies of graphitic materials, have characterized the two primary bands at ca. 1350 and 1580 cm−1, as the “D” and “G” bands, respectively.69,88–96 Specifically, the G band is thought to originate from the E2g breathing mode associated with sp2 carbon bonds within the graphite domains,92 whereas the D band has been associated with modes with A1g symmetry70 and may arise from hexagonal ring structures.57,59,69,70,97 Reich and Thomsen98 consider the D band to indicate the presence of defects in the carbon structure. Milev et al.57 further developed this description by suggesting that the D band intensity should be proportional to the presence of hexagonal ring structures within the graphite and its broadness should reflect the overall cluster size containing hexagonal ring structures.
image file: c5ra24561c-f6.tif
Fig. 6 Raw Raman spectra, best fits, and residuals for (a) synthesized HTC and (b) HTC milled for 200 min.

Two bands (G and D) provided an insufficient description of the Raman spectra shown in Fig. 6. Instead, we elected to use the Raman assignments described by Sadezky et al.74 based on simulated spectra and comparison with earlier work75,99 on disordered natural and synthetic carbonaceous materials. More recently, Foo and Sievers100 successfully applied the assignments to activated carbon and Bernarda et al.101 used a similar scheme for pyrolysis chars, demonstrating the wide applicability of the Sadezky et al.74 assignment scheme. The disordered carbon Raman assignments consist of 5 peaks, described in Table 1, termed G, which retains its usual interpretation, and D1, D2, D3, and D4, which represent various types of disorder. Fig. 6 shows the best fit Raman data and the residual (%); the residual is less than 1% in all cases except at the periphery (<1050 and >1700 cm−1), indicative of a good fit.

Table 1 Summary of the Sadezky et al.74 Raman assignments for disordered carbon
Peak name Shape Approximate location (cm−1) Attribution
D1 Lorentzian 1350 Graphene edges
D2 Lorentzian 1600 Graphene sheets
D3 Gaussian 1529 Amorphous carbon
D4 Lorentzian 1210 Polyenes
G Lorentzian 1575 Graphitic carbon


Fig. 7 contains plots of two ratios, one recommended by Beyssac et al.75 as a measure of graphitization and sometimes termed the “R2” metric, D1/(G + D1 + D2) the other the ratio of edges (D1) to basal planes (D2). The R2 metric varies inversely with graphitic content and was recommended as a more precise metric than the D1/G ratio on its own.75 Here, Fig. 7 shows that the graphitic content of the HTC decreases in the first 30 min of milling, levels off, and then decreases strongly to a more graphitic state (R2 < 0.5) after 300 min. The D1/D2 ratio, on the other hand, is relatively constant for the initial 60 min of milling before increasing dramatically at 90 min and then ultimately decreasing to its lowest values after 120 min. Taken together, these two metrics are consistent with a net increase in HTC graphitization, which proceeds via a path that first generates new edge sites before recombination to form larger basal planes. To pursue further, we analyzed the HTC using XRD. XRD spectra indicate no change in HTC crystallinity with milling, which suggests that milling leads to increased localized order that does not extend beyond a handful of aromatic rings (see ESI for full details).


image file: c5ra24561c-f7.tif
Fig. 7 Characteristic ratios obtained from fitting the Raman spectra contained in Fig. 6. The top panel shows the D1/(G1 + D1 + D2) ratio recommended as an inverse measure of graphitization. The bottom panel shows the ratio of edges (D1) to basal planes (D2).

In addition to the Sadezky et al.74 assignment scheme, we considered a more molecularly detailed attribution recommended by Li et al.76 and based on their investigation of brown coal. The Li et al.76 assignments specify 9 bands, resulting in lower signal to noise in the fitting parameters. Complete details of the Li et al.76 fitting procedure are contained in the ESI.

Proposed mechanism

SEM, elemental analysis, ATR-IR, DRIFTS, and Raman microscopy describe a self-consistent picture of mechanochemical modification of HTC during ball milling. Fig. 8 presents a potential reaction mechanism that is consistent with the data. HTC begins as an aromatic–aliphatic–furanic structure, consisting of small aromatic and furanic domains cross-linked by short aliphatic and ether chains.2–4,102 Consistent with our elemental analysis, DRIFTS, and ATR-IR results, the HTC structure contains numerous oxygen bearing groups, notably ether, carboxylate, furan, and phenol structures.39
image file: c5ra24561c-f8.tif
Fig. 8 Proposed mechanochemical reaction mechanism during ball milling of HTC.

During the initial 60 min of ball-milling, mechanochemically induced stresses and heat can break the aliphatic C–C and C–O bonds that connect these aromatic domains, resulting in a greater percentage of edge sites. If the reaction occurs primarily via a thermal rather than stress accelerated route, we would expect preferential breaking of aliphatic–aliphatic C–C and C–O bonds as these are weaker than the aromatic-aliphatic C–C and C–O bonds thought to be present in HTC. Characteristic bond energies of the aliphatic–aliphatic bonds are on the order of 350 kJ mol−1,103 whereas the strengths of likely aromatic-aliphatic bonds thought to be present in HTC are greater than 400 kJ mol−1.104 A potential exception to this observation is the relatively weak C–O–C bond between aromatic rings; the energy of this bond is only 330 kJ mol−1,104 making it among the most thermally labile bonds present in HTC. More information, including a bond energy summary table, is provided in the ESI.

In parallel with C–C and C–O bond breaking, elemental analysis and DRIFTS spectra indicate that HTC dehydration occurs. Mechanochemical dehydration has been observed previously for inorganic materials105,106 and – in the presence of catalyst – for carbohydrates.107 In terms of which hydroxyl groups are lost, we infer from bond energies that aliphatic alcohols are the most thermally labile as the phenolic OH bond energy is 430 kJ mol−1.104 On the other hand, ATR-IR shows that the HTC carbonyl peak increases with milling, which we interpret as reaction of carbon species (presumably aliphatic side chains since aromatic carbons themselves should be more thermodynamically stable to oxidation108–111) with oxygen contained in the milling vessel.

Following the initial period of C–C and C–O bond breaking comes a period of recombination to form larger aromatic domains. As the oxygen becomes depleted in the reactor, graphite is the stable form of carbon under milling conditions, and so the thermodynamic driving forces will tend to push the HTC toward a more highly graphitized form. Indeed, this is observed. ATR-IR shows an increase in the ca. 1600 cm−1 band associated with aromatic structures, beginning after approximately 60 minutes of milling. Furthermore, ATR-IR shows a strong increase in the 1200 cm−1 band, which has previously been attributed83 to dehydrogenation/annealing. Likewise, Raman microscopy shows an increase in graphitic character of the HTC and a decrease in the ratio of edge sites to basal planes at the same time.

A key step in the mechanism proposed in Fig. 8 is the transient formation of carbon radicals. To investigate further, we analyzed the synthesized and milled HTC using ESR. ESR peak positions, line shapes and line widths can be used to deduce the nature of radicals present in a sample while ESR peak intensities directly relate to the concentration of radicals present.58,112–116 Fig. 9 shows that all HTC ESR spectra consisted of a single unresolved peak with dominant Lorentzian character. The g-value corresponding to the center of the peak was 2.003 ± 0.001 and did not change significantly with milling time or upon removal of air from the sample tube. The observed g-value is close to the free electron value of 2.0023 and indicates the presence of primarily carbon-centered radicals, since interactions of an unpaired electron with heteroatoms leads to higher g-values.115,117


image file: c5ra24561c-f9.tif
Fig. 9 ESR spectra of HTC as prepared and ball milled for 30, 60 and 90 minutes.

ESR spectra shown in Fig. 9 of synthesized and milled HTC were broad and featureless. A similar lack of hyperfine structure was reported by Cheng et al.67 for the Illinois #6 Coal standard (obtained at a frequency of 3.3 MHz); by Manivannan et al.118 for activated PICA carbons; by Gutsze and Orzeszko119 for sugar chars; and by Saab and Martin-Neto120 for soil samples. The lack of hyperfine structure is consistent with the presence of overlapping spectra of many different organic radicals. In addition to the overlapping effect, the dominant Lorentzian lineshape suggests that the radicals are interacting with one another via dipole–dipole or exchange interactions and that the intrinsic line width is not solely due to unresolved g or hyperfine structure, which would lead to a Gaussian lineshape.121 A more detailed discussion of ESR lineshapes and attempts to resolve them by operating at cryogenic temperatures is provided in the ESI.

Fig. 10 (bottom panel) shows that the peak-to-peak ESR linewidths increased with increasing milling times greater than 90 minutes. The lack of spectral resolution prevents quantitative line shape analysis, but the evolution of the linewidth with increasing milling time indicates differences in the radical species that are present in the milled samples, with a significant change occurring after about 90 minutes of milling. Likewise, free radical concentrations were determined by double integration of the acquired first derivative curve ESR spectra (shown in Fig. 9) and by comparison with a standard Illinois #6 coal sample after correcting for density and packing differences. Fig. 10 (bottom) shows that the radical density increases with milling time up to a maximum at 90 minutes followed by a levelling off or gradual decline. The initial increase is consistent with the radical formation step shown in Fig. 8, and the levelling off or decline is consistent with the recombination of these radicals or attainment of a steady state between radical formation and recombination. The formation/recombination interpretation is consistent with previous literature reports. Specifically, Kondo et al.122 studied the kinetics of mechanolysis of polymethylmethacrylate, reporting a rapid increase in radical concentration to a maximum reached after 60 min of milling followed by a more gradual decrease attributed to radical recombination. We take the literature data as setting a precedent for a simple model substance that we now extend to HTC as a far more chemically diverse and complex material. In summary, the dynamic response of radical concentrations and ESR linewidth to increasing milling are all consistent with the functional group and carbon structure results obtained from ATR-IR, DRIFTS, and Raman and articulated in Fig. 8.


image file: c5ra24561c-f10.tif
Fig. 10 ESR peak-to-peak linewidths (top) and normalized radical content (bottom) of HTC ball milled for varying times.

We next considered the question of how ball milling supplied the energy required for radical formation. Despite having been known for more than 100 years,53 the physical/chemical processes underlying mechanochemical transformations are not yet agreed science.123 In fact, even the use of the term “mechanochemistry” is debated.54 Most theories involve formation of localized “hot spots” or possibly even plasmonic states due to the effects of impacts and crack formation/propagation.123 Highly localized and transient temperatures as great as 1000 K can be reached,124 certainly high enough to break the more labile bonds C–C and C–O present in HTC. So, the chemistry observed for HTC may be a straight forward consequence of localized heating. On the other hand, Konôpka et al.125 reported direct comparison of thermochemical and mechanochemical reactivity of model gold-thiolate surfaces. Interestingly, Konôpka et al.125 found that, under mechanical stress, the C–S bond strength increases to the point that it is one of the strongest bonds in the system, rather than the weakest bond as it would be in the absence of stress. Likewise, Zhu et al.65 reviewed the literature on mechanochemical modification of fullerenic materials, finding that mechanochemical products obtained under solvent-free conditions can be completely different from those obtained by thermochemical reactions in a solvent. For this reason, we cannot rule out a potential role for mechanical stress activation or even de-activation of selective bonds present in HTC, thereby influencing the observed reactivity.

Conclusions

Glucose was used as a feedstock to synthesize HTC at 180 °C. Subsequent to synthesis, the HTC was subjected to ball milling for up to 300 min. Physical structure (SEM), composition (elemental analysis), functional group (DRIFTS and ATR-IR), carbon structure (Raman), crystallinity (XRD), and radical content (ESR) were monitored to track changes to the HTC that occurred during milling. Elemental analysis found that HTC carbon–hydrogen–oxygen composition initially resembles lignite. Milling for more than 2 hours converts the HTC elemental composition to resemble low-grade coal or a pyrolysis biochar. SEM indicated that the HTC initially consisted of microspheres with average diameters of approximately 200 nm. Milling for 30 min caused these microspheres to agglomerate and continued milling caused a shift from spherical to plate-like particles. ATR-IR indicates an increase in carbonyl content that begins after 30 min of milling, likely due to reaction of HTC with the oxygen contained inside the reactor vessel. At longer times scales >60 min, ATR-IR shows an increase in aromatic content of the HTC, decrease in either content, and a strong increase in a broad peak at 1200 cm−1 that has been attributed in the literature to dehydrogenation/annealing. DRIFTS revealed a decrease in the OH stretch, consistent with loss of organic hydroxyl groups. Raman microscopy showed that the degree of graphitization decreased as the HTC transitioned from highly disordered to weakly ordered after 300 min of milling. Similarly, Raman bands associated with edge sites first increased after 60 min of milling and then decreased strongly with longer milling times. XRD indicated that neither synthesized nor milled HTC were highly crystalline. Based on these observations, we forward a mechanism that involves breakage of aliphatic C–C and C–O bonds during the first 30–60 min of milling, followed by their recombination to increase the aromatic content and basal plane domain at longer milling times. Consistent with this mechanism, ESR confirmed that the milling chemistry occurred in parallel with carbon radical formation. The study showed that ball-milling HTC for times on the order of minutes or hours may be suitable for catalyst functionalization, as milling generates a radical pool to allow facile attachment of desirable functional groups. The exact nature of the effect – mechanothermal or strain-related – remains an open question.

Acknowledgements

NSF provided partial support for this work (EEC-1342320). JV, JT, EH, BJM, and MTT thank the WPI Major Qualifying Project program for financial assistance. Richard Sisson and Boaquan Li (both at WPI) obtained SEM images of HTC samples; Alex Maag coordinated the SEM analysis. Avery Brown and Brad Durkin provided supporting measurements of HTC. Andrew Butler (ATR-IR) and Doug White (XRD) provided instrument training and support. Leco Corp. kindly performed elemental analysis of the HTC materials, a service which Bernie Lee graciously coordinated.

References

  1. M. Sevilla and A. B. Fuertes, Chem.–Eur. J., 2009, 15, 4195–4203 CrossRef CAS PubMed.
  2. C. Falco, N. Baccile and M.-M. Titirici, Green Chem., 2011, 13, 3273–3281 RSC.
  3. N. Baccile, G. Laurent, F. Babonneau, F. Fayon, M.-M. Titirici and M. Antonietti, J. Phys. Chem. C, 2009, 113, 9644–9654 CAS.
  4. C. Falco, F. P. Caballero, F. Babonneau, C. Gervais, G. Laurent, M.-M. Titirici and N. Baccile, Langmuir, 2011, 27, 14460–14471 CrossRef CAS PubMed.
  5. K. Aydıncak, T. Yumak, A. Sınağ and B. Esen, Ind. Eng. Chem. Res., 2012, 51, 9145–9152 CrossRef.
  6. A. T. Quitain, N. Sato, H. Daimon and K. Fujie, Ind. Eng. Chem. Res., 2001, 40, 5885–5888 CrossRef CAS.
  7. N. D. Berge, K. S. Ro, J. D. Mao, J. R. V. Flora, M. A. Chappell and S. Y. Bae, Environ. Sci. Technol., 2011, 45, 5696–5703 CrossRef CAS PubMed.
  8. Z. G. Liu, A. Quek, S. K. Hoekman and R. Balasubramanian, Fuel, 2013, 103, 943–949 CrossRef CAS.
  9. M. T. Reza, J. G. Lynam, V. R. Vasquez and C. J. Coronella, Environ. Prog. Sustainable Energy, 2012, 31, 225–234 CrossRef CAS.
  10. A. Funke and F. Ziegler, Biofuels, Bioprod. Biorefin., 2010, 4, 160–177 CrossRef CAS.
  11. M. T. Reza, W. Yan, M. H. Uddin, J. G. Lynam, S. K. Hoekman, C. J. Coronella and V. R. Vásquez, Bioresour. Technol., 2013, 139, 161–169 CrossRef CAS PubMed.
  12. H. Guo, X. Qi, L. Li and R. L. Smith Jr, Bioresour. Technol., 2012, 116, 355–359 CrossRef CAS PubMed.
  13. E. Sairanen, K. Vilonen, R. Karinen and J. Lehtonen, Top. Catal., 2013, 56, 512–521 CrossRef CAS.
  14. R. Demir-Cakan, P. Makowski, M. Antonietti, F. Goettmann and M.-M. Titirici, Catal. Today, 2010, 150, 115–118 CrossRef CAS.
  15. B. Zhang, J. Ren, X. Liu, Y. Guo, Y. Guo, G. Lu and Y. Wang, Catal. Commun., 2010, 11, 629–632 CrossRef CAS.
  16. W. L. Zhang, H. X. Tao, B. H. Zhang, J. W. Ren, G. Z. Lu and Y. Q. Wang, Carbon, 2011, 49, 1811–1820 CrossRef CAS.
  17. N. Brun, K. Sakaushi, L. Yu, L. Giebeler, J. Eckert and M. M. Titirici, Phys. Chem. Chem. Phys., 2013, 15, 6080–6087 RSC.
  18. N. Brun, S. A. Wohlgemuth, P. Osiceanu and M. M. Titirici, Green Chem., 2013, 15, 2514–2524 RSC.
  19. M. Sevilla, L. Yu, C. O. Ania and M.-M. Titirici, ChemElectroChem, 2014, 1, 2138–2145 CrossRef CAS.
  20. M. Sevilla, W. Gu, C. Falco, M. M. Titirici, A. B. Fuertes and G. Yushin, J. Power Sources, 2014, 267, 26–32 CrossRef CAS.
  21. Y. Fan, P. F. Liu, Z. J. Yang, T. W. Jiang, K. L. Yao, R. Han, X. X. Huo and Y. Y. Xiong, Electrochim. Acta, 2015, 163, 140–148 CrossRef CAS.
  22. R. B. Qiang, Z. G. Hu, Y. Y. Yang, Z. M. Li, N. An, X. Y. Ren, H. X. Hu and H. Y. Wu, Electrochim. Acta, 2015, 167, 303–310 CrossRef CAS.
  23. N. P. Wickramaratne, J. T. Xu, M. Wang, L. Zhu, L. M. Dai and M. Jaroniec, Chem. Mater., 2014, 26, 2820–2828 CrossRef CAS.
  24. L. Zhao, L.-Z. Fan, M.-Q. Zhou, H. Guan, S. Qiao, M. Antonietti and M.-M. Titirici, Adv. Mater., 2010, 22, 5202–5206 CrossRef CAS PubMed.
  25. M. Sevilla and A. B. Fuertes, Energy Environ. Sci., 2011, 4, 1765–1771 CAS.
  26. M. Sevilla, A. B. Fuertes and R. Mokaya, Energy Environ. Sci., 2011, 4, 1400–1410 CAS.
  27. E. Unur, Microporous Mesoporous Mater., 2013, 168, 92–101 CrossRef CAS.
  28. S. Kumar, V. A. Loganathan, R. B. Gupta and M. O. Barnett, J. Environ. Manage., 2011, 92, 2504–2512 CrossRef CAS PubMed.
  29. S. Roman, J. M. Valente Nabais, B. Ledesma, J. F. Gonzalez, C. Laginhas and M. M. Titirici, Microporous Mesoporous Mater., 2013, 165, 127–133 CrossRef CAS.
  30. Y. Xue, B. Gao, Y. Yao, M. Inyang, M. Zhang, A. R. Zimmerman and K. S. Ro, Chem. Eng. J., 2012, 200, 673–680 CrossRef.
  31. J. G. Lynam, C. J. Coronella, W. Yan, M. T. Reza and V. R. Vasquez, Bioresour. Technol., 2011, 102, 6192–6199 CrossRef CAS PubMed.
  32. M. T. Reza, J. G. Lynam, M. H. Uddin and C. J. Coronella, Biomass Bioenergy, 2013, 49, 86–94 CrossRef CAS.
  33. M. Keiluweit, P. Nico, M. Johnson and M. Kleber, Environ. Sci. Technol., 2010, 44, 1247–1253 CrossRef CAS PubMed.
  34. M. C. Rillig, M. Wagner, M. Salem, P. M. Antunes, C. George, H.-G. Ramke, M.-M. Titirici and M. Antonietti, Appl. Soil Ecol., 2010, 45, 238–242 CrossRef.
  35. B. Hu, K. Wang, L. Wu, S.-H. Yu, M. Antonietti and M.-M. Titirici, Adv. Mater., 2010, 22, 813–828 CrossRef CAS PubMed.
  36. M.-M. Titirici, R. J. White, C. Falco and M. Sevilla, Energy Environ. Sci., 2012, 5, 6796–6822 Search PubMed.
  37. N. D. Berge, C. Kammann, K. Ro and J. Libra, in Sustainable Carbon Materials from Hydrothermal Processes, John Wiley & Sons, Ltd, 2013, pp. 295–340,  DOI:10.1002/9781118622179.ch8.
  38. H. S. Kambo and A. Dutta, Renewable Sustainable Energy Rev., 2015, 45, 359–378 CrossRef CAS.
  39. K. Wiedner, C. Rumpel, C. Steiner, A. Pozzi, R. Maas and B. Glaser, Biomass Bioenergy, 2013, 59, 264–278 CrossRef CAS.
  40. N. Baccile, G. Laurent, F. Babonneau, F. Fayon, M. M. Titirici and M. Antonietti, J. Phys. Chem. C, 2009, 113, 9644–9654 CAS.
  41. H. Jeong, H. J. Kim, Y. J. Lee, J. Y. Hwang, O. K. Park, J. H. Wee, C. M. Yang, B. C. Ku and J. K. Lee, Mater. Lett., 2015, 145, 273–278 CrossRef CAS.
  42. W. Li, Z. H. Zhang, B. A. Kong, S. S. Feng, J. X. Wang, L. Z. Wang, J. P. Yang, F. Zhang, P. Y. Wu and D. Y. Zhao, Angew. Chem., Int. Ed., 2013, 52, 8151–8155 CrossRef CAS PubMed.
  43. S. A. Wohlgemuth, F. Vilela, M. M. Titirici and M. Antonietti, Green Chem., 2012, 14, 741–749 RSC.
  44. R. J. White, N. Yoshizawa, M. Antonietti and M. M. Titirici, Green Chem., 2011, 13, 2428–2434 RSC.
  45. L. Zhao, L. Z. Fan, M. Q. Zhou, H. Guan, S. Y. Qiao, M. Antonietti and M. M. Titirici, Adv. Mater., 2010, 22, 5202–5206 CrossRef CAS PubMed.
  46. R. Demir-Cakan, N. Baccile, M. Antonietti and M.-M. Titirici, Chem. Mater., 2009, 21, 484–490 CrossRef CAS.
  47. Y. L. Chen, J. J. Chen, S. Q. Chen, K. Tian and H. Jiang, J. Mater. Chem. A, 2015, 3, 9843–9850 CAS.
  48. W.-J. Liu, K. Tian, Y.-R. He, H. Jiang and H.-Q. Yu, Environ. Sci. Technol., 2014, 48, 13951–13959 CrossRef CAS PubMed.
  49. B. Zhang, J. Ren, X. Liu, Y. Guo, Y. Guo, G. Lu and Y. Wang, Catal. Commun., 2010, 11, 629–632 CrossRef CAS.
  50. Z. C. Yang, X. Li and J. Wang, Carbon, 2011, 49, 5207–5212 CrossRef CAS.
  51. J. Huot, D. B. Ravnsbaek, J. Zhang, F. Cuevas, M. Latroche and T. R. Jensen, Prog. Mater. Sci., 2013, 58, 30–75 CrossRef CAS.
  52. T. Xing, J. Sunarso, W. Yang, Y. Yin, A. M. Glushenkov, L. H. Li, P. C. Howlett and Y. Chen, Nanoscale, 2013, 5, 7970–7976 RSC.
  53. E. Boldyreva, Chem. Soc. Rev., 2013, 42, 7719–7738 RSC.
  54. G. Kaupp, CrystEngComm, 2009, 11, 388–403 RSC.
  55. D. Braga, D. D'Addario, S. L. Giaffreda, L. Maini, M. Polito and F. Grepioni, in Organic Solid State Reactions, ed. F. Toda, 2005, vol. 254, pp. 71–94 Search PubMed.
  56. B. Rodriguez, A. Bruckmann, T. Rantanen and C. Bolm, Adv. Synth. Catal., 2007, 349, 2213–2233 CrossRef CAS.
  57. A. S. Milev, N. H. Tran, G. S. K. Kannangara and M. A. Wilson, Phys. Chem. Chem. Phys., 2010, 12, 6685–6691 RSC.
  58. C. I. Smith, H. Miyaoka, T. Ichikawa, M. O. Jones, J. Harmer, W. Ishida, P. P. Edwards, Y. Kojima and H. Fuji, J. Phys. Chem. C, 2009, 113, 5409–5416 CAS.
  59. M. Tommasini, C. Castiglioni, G. Zerbi, A. Barbon and M. Brustolon, Chem. Phys. Lett., 2011, 516, 220–224 CrossRef CAS.
  60. C. S. Wang, G. T. Wu and W. Z. Li, J. Power Sources, 1998, 76, 1–10 CrossRef CAS.
  61. L. Yan, M. Lin, C. Zeng, Z. Chen, S. Zhang, X. Zhao, A. Wu, Y. Wang, L. Dai, J. Qu, M. Guo and Y. Liu, J. Mater. Chem., 2012, 22, 8367–8371 RSC.
  62. Y. Zhang, J. Wedderburn, R. Harris and D. Book, Mater. Res. Bull., 2014, 60, 648–651 CrossRef CAS.
  63. Y. Li, B. Wei, J. Liang, Q. Yu and D. Wu, Carbon, 1999, 37, 493–497 CrossRef CAS.
  64. I. Y. Jeon, S. Y. Bae, J. M. Seo and J. B. Baek, Adv. Funct. Mater., 2015, 25, 6961–6975 CrossRef CAS.
  65. S. E. Zhu, F. Li and G. W. Wang, Chem. Soc. Rev., 2013, 42, 7535–7570 RSC.
  66. M. Sevilla and A. B. Fuertes, Carbon, 2009, 47, 2281–2289 CrossRef CAS.
  67. H. N. Cheng, L. H. Wartelle, K. T. Klasson and J. C. Edwards, Carbon, 2010, 48, 2455–2469 CrossRef CAS.
  68. A. M. Dehkhoda, A. H. West and N. Ellis, Appl. Catal., A, 2010, 382, 197–204 CrossRef CAS.
  69. F. Tuinstra and J. L. Koenig, J. Chem. Phys., 1970, 53, 1126–1130 CrossRef CAS.
  70. A. C. Ferrari and J. Robertson, Phys. Rev. B: Condens. Matter Mater. Phys., 2000, 61, 14095–14107 CrossRef CAS.
  71. P. R. Griffiths, Vib. Spectrosc., 1992, 4, 121 CrossRef.
  72. M. Kuzuya, Y. Yamauchi and S.-i. Kondo, J. Phys. Chem. B, 1999, 103, 8051–8059 CrossRef CAS.
  73. S. Immohr, M. Felderhoff, C. Weidenthaler and F. Schüth, Angew. Chem., Int. Ed., 2013, 52, 12688–12691 CrossRef CAS PubMed.
  74. A. Sadezky, H. Muckenhuber, H. Grothe, R. Niessner and U. Pöschl, Carbon, 2005, 43, 1731–1742 CrossRef CAS.
  75. O. Beyssac, B. Goffe, J. P. Petitet, E. Froigneux, M. Moreau and J. N. Rouzaud, Spectrochim. Acta, Part A, 2003, 59, 2267–2276 CrossRef.
  76. X. Li, J.-I. Hayashi and C.-Z. Li, Fuel, 2006, 85, 1700–1707 CrossRef CAS.
  77. B. Ranby and J. F. Rabek, ESR spectroscopy in polymer research, Springer Science & Business Media, 2012 Search PubMed.
  78. S. S. Eaton and G. R. Eaton, Bull. Magn. Reson., 1980, 1, 130–138 CAS.
  79. J. Fu, C. Wei, W. Wang, J. L. Wei and J. Lv, Mater. Res. Innovations, 2015, 19, 277–280 Search PubMed.
  80. L. Yu, C. Falco, J. Weber, R. J. White, J. Y. Howe and M.-M. Titirici, Langmuir, 2012, 28, 12373–12383 CrossRef CAS PubMed.
  81. D. van Krevelen, Coal: Typology-Physics-Chemistry-Constitution, Elsevier, New York, 3rd edn, 1993 Search PubMed.
  82. M. J. Prins, M.S., Technische Universiteit Eindhoven, 2005.
  83. C. Russo, F. Stanzione, A. Tregrossi and A. Ciajolo, Carbon, 2014, 74, 127–138 CrossRef CAS.
  84. R. M. Silverstein, G. C. Bassler and T. C. Morrill, Spectrometric Identification of Organic Compounds, John Wiley & Sons, Inc., New York, 5th edn, 1991 Search PubMed.
  85. Y. Carpentier, G. Féraud, E. Dartois, R. Brunetto, E. Charon, A.-T. Cao, L. d'Hendecourt, P. Bréchignac, J.-N. Rouzaud and T. Pino, Astron. Astrophys., 2012, 548, A40 CrossRef.
  86. C. Russo, F. Stanzione, A. Tregrossi, M. Alfè and A. Ciajolo, Combust. Flame, 2012, 159, 2233–2242 CrossRef CAS.
  87. W. J. Grieco, J. B. Howard, L. C. Rainey and J. B. Vander Sande, Carbon, 2000, 38, 597–614 CrossRef CAS.
  88. C. Mapelli, C. Castiglioni, E. Meroni and G. Zerbi, J. Mol. Struct., 1999, 481, 615–620 CrossRef.
  89. F. Negri, C. Castiglioni, M. Tommasini and G. Zerbi, J. Phys. Chem. A, 2002, 106, 3306–3317 CrossRef CAS.
  90. A. C. Ferrari, Solid State Commun., 2007, 143, 47–57 CrossRef CAS.
  91. A. C. Ferrari, J. C. Meyer, V. Scardaci, C. Casiraghi, M. Lazzeri, F. Mauri, S. Piscanec, D. Jiang, K. S. Novoselov, S. Roth and A. K. Geim, Phys. Rev. Lett., 2006, 97, 187401 CrossRef CAS PubMed.
  92. A. C. Ferrari and J. Robertson, Phys. Rev. B: Condens. Matter Mater. Phys., 2000, 61, 14095–14107 CrossRef CAS.
  93. A. C. Ferrari and J. Robertson, Philos. Trans. R. Soc., A, 2004, 362, 2477–2512 CrossRef CAS PubMed.
  94. M. S. Dresselhaus, G. Dresselhaus, R. Saito and A. Jorio, Phys. Rep., 2005, 409, 47–99 CrossRef.
  95. M. S. Dresselhaus, A. Jorio, M. Hofmann, G. Dresselhaus and R. Saito, Nano Lett., 2010, 10, 751–758 CrossRef CAS PubMed.
  96. L. M. Malard, M. A. Pimenta, G. Dresselhaus and M. S. Dresselhaus, Phys. Rep., 2009, 473, 51–87 CrossRef CAS.
  97. C. Castiglioni, C. Mapelli, F. Negri and G. Zerbi, J. Chem. Phys., 2001, 114, 963–974 CrossRef CAS.
  98. S. Reich and C. Thomsen, Philos. Trans.: Math., Phys. Eng. Sci., 2004, 362, 2271–2288 CrossRef CAS PubMed.
  99. C. Beny-Bassez and J. Rouzaud, Scanning Electron Microsc., 1985, 1, 119–132 Search PubMed.
  100. G. S. Foo and C. Sievers, ChemSusChem, 2015, 8, 534–543 CrossRef CAS PubMed.
  101. S. Bernarda, O. Beyssac, K. Benzerara, N. Findling, G. Tzvetkov and G. E. Brown Jr, Carbon, 2010, 48, 2506–2516 CrossRef.
  102. C. Falco, J. P. Marco-Lozar, D. Salinas-Torres, E. Morallon, D. Cazorla-Amoros, M. M. Titirici and D. Lozano-Castello, Carbon, 2013, 62, 346–355 CrossRef CAS.
  103. G. Carruth and E. Ehrlich, Bond Energies, Volume Library, ed. G. Carruth, Southwestern, Tennessee, 2002, vol. 1 Search PubMed.
  104. CRC Handbook of Chemistry and Physics, ed. W. M. Haynes, CRC Press, Boca Raton, FL, 96th edn, 2015, section 9, pp. 71–79 Search PubMed.
  105. J. F. Liao and M. Senna, Solid State Ionics, 1993, 66, 313–319 CrossRef CAS.
  106. J. F. Liao and M. Senna, Thermochim. Acta, 1992, 210, 89–102 CrossRef CAS.
  107. S. M. Hick, C. Griebel, D. T. Restrepo, J. H. Truitt, E. J. Buker, C. Bylda and R. G. Blair, Green Chem., 2010, 12, 468–474 RSC.
  108. M. J. DeWitt, Z. West, S. Zabarnick, L. Shafer, R. Striebich, A. Higgins and T. Edwards, Energy Fuels, 2014, 28, 3696–3703 CrossRef CAS.
  109. L. M. Balster, S. Zabarnick, R. C. Striebich, L. M. Shafer and Z. J. West, Energy Fuels, 2006, 20, 2564–2571 CrossRef CAS.
  110. K. Hemelsoet, V. Van Speybroeck and M. Waroquier, ChemPhysChem, 2008, 9, 2349–2358 CrossRef CAS PubMed.
  111. B. Lefort and W. Tsang, Combust. Flame, 2011, 158, 657–665 CrossRef CAS.
  112. A. Centrone, J. Raman Spectrosc., 2011, 42, 2165–2167 CrossRef CAS.
  113. D. Dasgupta, F. Demichelis, C. F. Pirri and A. Tagliaferro, Phys. Rev. B: Condens. Matter Mater. Phys., 1991, 43, 2131–2135 CrossRef CAS.
  114. T. G. Fowler, K. D. Bartle and R. Kandiyoti, Fuel, 1987, 66, 1407–1412 CrossRef CAS.
  115. O. Ito, H. Seki and M. Iino, Bull. Chem. Soc. Jpn., 1987, 60, 2967–2975 CrossRef CAS.
  116. B. G. Silbernagel, L. A. Gebhard, G. R. Dyrkacz and C. A. A. Bloomquist, Fuel, 1986, 65, 558–565 CrossRef CAS.
  117. H. Retcofsky, Coal Sci., 1982, 1, 43–82 CAS.
  118. A. Manivannan, M. Chirila, N. C. Giles and M. S. Seehra, Carbon, 1999, 37, 1741–1747 CrossRef CAS.
  119. A. Gutsze and S. Orzeszko, Adv. Colloid Interface Sci., 1985, 23, 215–233 CrossRef CAS.
  120. S. C. Saab and L. Martin-Neto, J. Braz. Chem. Soc., 2004, 15, 34–37 CrossRef CAS.
  121. H. Seidel and H. Wolf, Phys. Color Cent., 1968, 537 CAS.
  122. S.-i. Kondo, Y. Sasai, S. Hosaka, T. Ishikawa and M. Kuzuya, J. Polym. Sci., Part A: Polym. Chem., 2004, 42, 4161–4167 CrossRef CAS.
  123. P. Balaz, M. Achimovicova, M. Balaz, P. Billik, Z. Cherkezova-Zheleva, J. M. Criado, F. Delogu, E. Dutkova, E. Gaffet, F. J. Gotor, R. Kumar, I. Mitov, T. Rojac, M. Senna, A. Streletskii and K. Wieczorek-Ciurowa, Chem. Soc. Rev., 2013, 42, 7571–7637 RSC.
  124. F. P. Bowden and D. Tabor, The friction and lubrication of solids, Wiley Online Library, 1964 Search PubMed.
  125. M. Konôpka, R. Turanský, J. Reichert, H. Fuchs, D. Marx and I. Štich, Phys. Rev. Lett., 2008, 100, 115503 CrossRef PubMed.

Footnote

Electronic supplementary information (ESI) available. See DOI: 10.1039/c5ra24561c

This journal is © The Royal Society of Chemistry 2016
Click here to see how this site uses Cookies. View our privacy policy here.