Phase diagram for a nano-yttria-stabilized zirconia system

Mohammad Asadikiya*ab, Hooman Sabarouab, Ming Chenc and Yu Zhongab
aDepartment of Mechanical and Materials Engineering, Florida International University, Miami, Florida 33174, USA. E-mail: masad005@fiu.edu
bCenter for the Study of Matter at Extreme Conditions (CeSMEC), Florida International University, Miami, Florida 33199, USA
cDepartment of Energy Conversion and Storage, Technical University of Denmark, DK-4000 Roskilde, Denmark

Received 17th November 2015 , Accepted 13th January 2016

First published on 18th January 2016


Abstract

Due to the attractive properties of nanoparticles because of their effective surface area, they have been studied widely. Nano-yttria-stabilized zirconia (n-YSZ) is a ceramic which has been scrutinized extensively in past years. Because of the different stability behavior of n-YSZ in comparison with bulk YSZ, a new phase diagram is needed for the n-YSZ system in order to identify stable phases under various conditions. In this study, a phase diagram for the n-YSZ system was provided to determine phase stability ranges at room temperature with respect to particle size and composition. The calculation of phase diagrams (CALPHAD) approach was applied to calculate the Gibbs energy of bulk YSZ. It was combined with the surface energy of each phase in the n-YSZ system, i.e. monoclinic, tetragonal, cubic, and amorphous, to produce the total Gibbs energy of each individual phase of the n-YSZ system. By applying the CALPHAD approach, a 3-D phase diagram for the n-YSZ system was established in which the stability range of each individual phase can be predicted based on the particle size, composition, and temperature.

1. Introduction

Yttria-stabilized zirconia (YSZ) is one of the most interesting ceramic systems which has been studied extensively because of its critical applications. The tetragonal polymorph is used as an advanced structural ceramic in, for example, tooth crowns and jet engines since it has high toughness.1–3 The cubic polymorph has the ability to conduct oxygen ions due to the high oxygen vacancy concentration, which increases when temperature rises.3 This characteristic of the cubic polymorph is the reason for its applicability in solid oxide fuel cells (SOFCs) and oxygen sensors.4–6 Fig. 1 shows the crystal structure of YSZ polymorphs.
image file: c5ra24330k-f1.tif
Fig. 1 Crystal structures of YSZ polymorphs.7,8

Nanocrystalline YSZ (n-YSZ) has been investigated recently because of its different properties with respect to the bulk. For example, one important factor in gas sensors is response time which is related to the electrode microstructure because of the effect of surface diffusion. Particles with smaller grain size and higher specific surface help to reduce the response time. The larger surface area also causes higher catalytic activity.9 n-YSZ properties are attributed to the large fraction of atoms within the interface region.10 In fact, in systems with nanosized particles, the effect of surface area becomes significant and affects the Gibbs energy of each phase.11,12 Therefore, the n-YSZ system shows different behavior in comparison with bulk YSZ. In other words, the stability regions in an n-YSZ system can be significantly different from those in bulk YSZ.

For bulk YSZ systems, different groups have conducted extensive studies to understand the phase regions at different temperatures and compositions.13–16 However, for the n-YSZ system, there is no applicable accurate phase diagram especially at elevated temperatures.

In this study, the CALPHAD (calculation of phase diagrams) approach was applied to predict the Gibbs energy of bulk YSZ systems. By considering the effect of surface energy, the total Gibbs energy of the n-YSZ system was developed. Therefore, by predicting the total Gibbs energy of each polymorph in a range of temperatures, a 3-D phase diagram for the n-YSZ system was established in which the stability range of each crystal structure can be determined based on the particle size, composition, and temperature.

2. Background review

Several groups have attempted to observe the changes in the transformation temperatures as a function of grain size for n-YSZ systems.2,3,17,18 The total surface energy depends on surface area and specific surface energy. Hence, to have a Gibbs energy definition for an n-YSZ system, the specific surface energy has to be measured. Based on the recent advancements in microcalorimetry for measuring the specific surface energy of nanoparticles, Drazin and Castro have measured multiple specific surface energies in an n-YSZ system for yttria mole fractions of 0 to 0.2 at room temperature.19 Water adsorption microcalorimetry theory was applied to collect the specific surface energy data.20 The experiments were done for m-ZrO2 (monoclinic YSZ phase), t-ZrO2 (tetragonal YSZ phase), c-ZrO2 (cubic YSZ phase), and amorphous phase with particle sizes of 32.4 to 39.8 nm, 14.2 to 17.7 nm, 4 to 6.3 nm, and 1 to 1.1 nm respectively.

3. Thermodynamic modeling

3.1. Gibbs energy calculation for the bulk materials

The CALPHAD approach relies on modeling the Gibbs energies of each individual phase in the system. This characteristic state function is of particular interest because the Gibbs energy is minimized at equilibrium under constant temperature and pressure. Temperature and pressure are the variables that are typically controlled experimentally. The thermodynamic databases based on the Gibbs energies are then constructed using experimental data and programs like Thermo-Calc.21

The thermodynamic database for the ZrO2–Y2O3 system was provided by Chen et al.15 It was applied in the current study to calculate the Gibbs energy of each phase for bulk YSZ at different temperatures. The equation below is for the Gibbs free energy of bulk materials:

 
ΔGbulk = ΔHTΔS (1)
in which H is enthalpy, T is temperature and S is entropy.

The model used for m-ZrO2 (monoclinic YSZ phase) and t-ZrO2 (tetragonal YSZ phase) in the database of Chen et al. is (Y3+,Zr4+)1(O2−,Va)2.15 In this model, the first sublattice is occupied by Y3+ and Zr4+ ions and the second one is occupied by an O2− ion and a vacancy. The model used for c-ZrO2 (cubic YSZ phase) is (Y,Y3+,Zr,Zr4+)1(O2−,Va)2. Thus, the Gibbs energy of the m-ZrO2 and t-ZrO2 phases is given by:

Gm = yY3+yO2−°GY3+:O2− + yZr4+yO2−°GZr4+:O2− + yY3+yVa°GY3+:Va + yZr4+yVa°GZr4+:Va + RT[yY3+[thin space (1/6-em)]ln[thin space (1/6-em)]yY3+ + yZr4+[thin space (1/6-em)]ln[thin space (1/6-em)]yZr4+ + 2(yO2−[thin space (1/6-em)]ln[thin space (1/6-em)]yO2− + yVa[thin space (1/6-em)]ln[thin space (1/6-em)]yVa)] + EGm

And the Gibbs energy of the c-ZrO2 phase is given by:

Gm = yY3+yO2−°GY3+:O2− + yZr4+yO2−°GZr4+:O2− + yY3+yVa°GY3+:Va + yZr4+yVa°GZr4+:Va + yYyO2−°GY:O2− + yZryO2−°GZr:O2− + yYyVa°GY:Va + yZryVa°GZr:Va + RT[yY[thin space (1/6-em)]ln[thin space (1/6-em)]yY + yY3+[thin space (1/6-em)]ln[thin space (1/6-em)]yY3+ + yZr[thin space (1/6-em)]ln[thin space (1/6-em)]yZr + yZr4+[thin space (1/6-em)]ln[thin space (1/6-em)]yZr4+ + 2(yO2−[thin space (1/6-em)]ln[thin space (1/6-em)]yO2− + yVa[thin space (1/6-em)]ln[thin space (1/6-em)]yVa)] + EGm
where yj is the site fraction of species j in a particular sublattice. The excess Gibbs energy EGm is defined as below:
image file: c5ra24330k-t1.tif

And the excess Gibbs energy EGm is defined as below:

image file: c5ra24330k-t2.tif
where iL is the interaction parameter with the form of A + BT. If i = 0, the solution is regular, if i = 1, the solution is sub-regular, and if i = 2, the solution is sub-sub-regular.

The interaction parameter for the m-ZrO2 phase was considered to be zero since the yttria concentration in m-ZrO2 is extremely low and it is suitable to be treated as an ideal solution. The t-ZrO2 phase was considered as a regular solution and c-ZrO2 was treated as a sub-regular solution in the database of Chen et al.13

3.2. T-zero temperature method to determine phase boundaries

In order to calculate the Gibbs energy for bulk YSZ, the partial equilibria simulation has been applied. Since the kinetics is very slow in the YSZ system, phase transitions are observed with a considerable delay. The m-ZrO2 ↔ t-ZrO2 transition occurs as a martensitic transformation.15 In order to determine the phase boundaries under such conditions, Kaufman and Cohen suggested a T-zero temperature approach,22 which is one type of partial equilibrium method. In this method, the starting transition temperature of tetragonal to monoclinic phases during cooling and also the starting transition temperature of monoclinic to tetragonal phases during heating are captured. Based on these two transition temperatures, an average temperature is calculated as the equilibrium temperature. In other words, T0 is a temperature at which the Gibbs energies of two adjacent phases are equal in a determined composition. The T0 temperature is located in the two-phase region and it is a theoretical limit for a diffusionless transformation as illustrated in Fig. 2. In this figure, uj is defined as the site fraction of element j with reference to the substitutional sublattices only.
image file: c5ra24330k-f2.tif
Fig. 2 T-zero temperature method. (A) T0 temperature as a point at a defined composition, (B) T0 temperature as a line when the composition changes.

3.3. Amorphous phase modeling

The model for ionic liquid was used to calculate the amorphous phase. In the thermodynamic database of Chen et al., the liquid phase was modeled as (Y3+,Zr4+)p(O2−)q in which p = 2yO2− and q = 3yY3+ + 4yZr4+.15 The Gibbs energy description of a liquid is given by:
GLm = yY3+yO2−°GLY3+:O2− + yZr4+yO2−°GLZr4+:O2− + pRT[yY3+[thin space (1/6-em)]ln[thin space (1/6-em)]yY3+ + yZr4+[thin space (1/6-em)]ln[thin space (1/6-em)]yZr4+] + EGLm

The excess Gibbs energy EGLm is defined as below:

image file: c5ra24330k-t3.tif

The ionic liquid was considered as a sub-sub-regular solution (i = 2) in the database of Chen et al.15

Generally, the liquid phase is stable at high temperatures. In order to model an amorphous phase in the CALPHAD approach, one method is to extrapolate the liquid model to lower temperatures. In fact, the amorphous phase is considered as a supercooled liquid. Although the structure and physical state of a supercooled liquid are different from the amorphous phase and some minor errors are expected in this simulation, they are still very similar and the results are close to reality.

3.4. Gibbs energy calculation for nanoparticles

The surface area becomes significant and plays an important role in the Gibbs energy in nanoparticles. Consequently, the Gibbs energy equation will be as shown below for nanoparticles:
 
ΔGtotal = ΔGbulk + γA = ΔHbulkTΔSbulk + γA (2)
in which γ is the specific surface energy and A is the surface area of the nanoparticles. Therefore, in order to calculate the total Gibbs energy for nanoparticles, the specific surface energy of each phase and the surface area are needed. The experimental data for the specific surface energy of n-YSZ polymorphs provided by Drazin and Castro19 at room temperature were applied in this study to calculate the surface energy. The particles were also assumed to be spherical to enhance the surface area calculation.

4. Results and discussion

Fig. 3 shows the calculated Gibbs energy of bulk YSZ vs. composition (mole fraction of Y2O3) for the four phases i.e. monoclinic, tetragonal, cubic, and amorphous (supercooled liquid), at room temperature. The yttria mole fraction is between 0 and 0.2 since the zirconia rich side has important applications as mentioned in Section 1.
image file: c5ra24330k-f3.tif
Fig. 3 The Gibbs energy of monoclinic, tetragonal, cubic, and amorphous (supercooled liquid) phases vs. yttria mole fraction at room temperature for the bulk YSZ.

Based on the experimental results followed by statistical analyses, the equations below from Drazin and Castro represent the specific surface energy of each n-YSZ polymorph:19

 
γm = (1.9278) − (9.68)x (3)
 
γt = (1.565) − (4.61)x (4)
 
γc = (1.1756) − (3.36)x + (7.77)x2 (5)
 
γa = (0.8174) − (0.11)x (6)

In all these equations, x is the yttria mole fraction and γm, γt, γc, and γa are specific surface energies of monoclinic, tetragonal, cubic, and amorphous phases respectively.

For solids, the specific surface energy depends on the particle size (dγ/dA ≠ 0)23 in addition to the composition. However, for particles with radii greater than the critical radius (RRc), the specific surface energy is constant at a determined temperature and does not change with particle size.24 Based on the results of previous studies on the molecular systems, Rc is between 0.5 and 1 nm,24 which is less than almost the whole particle size range studied in the current paper. Therefore, the specific surface energies are dependent only on the yttria mole fraction in this study as it is indicated in eqn (3)–(6).

The total Gibbs energy of the n-YSZ system is predicted as shown in Fig. 4 for particle sizes (the spherical particle diameter) of 0.1 nm, 1 nm, 10 nm, and 100 nm at room temperature.


image file: c5ra24330k-f4.tif
Fig. 4 The Gibbs energy vs. yttria mole fraction at room temperature for n-YSZ with different particle sizes.

As is shown in Fig. 4, the intersection between the Gibbs energy of different phases changes with particle size. When the particle size is 10 or 100 nm, the amorphous phase is not stable. If the particle size decreases to 1 nm, the amorphous phase starts to be stable and its stability composition range increases by decreasing the particle size (Fig. 4). As the stability of each phase is determined by the Gibbs energy of that phase, for a specific phase to be stable, its Gibbs energy needs to be less than that of the other involved phases. The Gibbs energy of the amorphous phase is less than those of the cubic, tetragonal, and monoclinic phases only when the size of the particles is very small. When the particle size decreases, the effect of surface energy increases which causes the Gibbs energy of all involved phases to be changed and leads to stability of the amorphous phase rather than the cubic, tetragonal and monoclinic phases.

The intersection points indicate that the Gibbs energies of the two phases related to each intersecting curve are equal at a certain composition. These intersection points for each two adjacent phases represent the T0 temperature line which was discussed in Section 3.2. Using the T-zero method, the n-YSZ phase diagram at room temperature was plotted as indicated in Fig. 5. In this figure, each curve indicates the boundary between phases by which the stability range of each polymorph vs. particle size and composition (mole fraction of Y2O3) is detected at room temperature. The Y axis in Fig. 5 is in logarithmic scale.


image file: c5ra24330k-f5.tif
Fig. 5 The phase diagram for the n-YSZ system at room temperature in comparison with the experimental data which represent experimentally measured crystal structures by Drazin and Castro.19 image file: c5ra24330k-u1.tif sign indicates the largest tetragonal pure zirconia particle size experimentally observed19 (M: monoclinic, T: tetragonal, C: cubic, A: amorphous).

The largest tetragonal pure zirconia particle size experimentally observed was around 9 nm19 which is compatible with the diagram in Fig. 5. Due to simplification as discussed in Section 3.3, errors are expected for the amorphous phase in the current study. However, the results for the amorphous phase clearly indicate the ability to predict the amorphous stability range by the CALPHAD approach along with its critical role in predicting the Gibbs energy of other phases. The discrepancy between the tetragonal phase region and the related superimposed experimental data shown in Fig. 5 can be an indication that the thermodynamic database for bulk YSZ provided by Chen et al.15 needs to be improved for the tetragonal + cubic/cubic phase boundary. It was found that there were no experimental data for the T0 line shown in Fig. 6 at the time of the thermodynamic database assessment, while enough experimental data were available for the T0 temperature line.15 Thus, it is highly possible that the T0 line is not accurate and needs to be shifted toward the right side of the graph which will then provide better agreement between the tetragonal/cubic (T/C) curve and the related experimental data.


image file: c5ra24330k-f6.tif
Fig. 6 T0 and T0 temperature lines related to bulk YSZ (T0 is the M/T T-zero temperature line and T0 is the T/C T-zero temperature line).

It is worth noting that in Fig. 5, the role of bulk Gibbs energy is of great importance. The phase stability regions will greatly change if the bulk Gibbs energy is not calculated correctly. For example, the ΔHM/T and ΔHT/C calculated with the oxide melt drop solution calorimetry method by Drazin and Castro are 10.304 and 13.351 kJ mol−1 respectively,19 while ΔHM/T and ΔHT/C are 6 and 7.5 kJ mol−1 respectively, based on the thermodynamic database from Chen et al. using the CALPHAD approach.15 It is highly possible that these large differences are due to the stability state of the samples which were experimentally investigated. If the examined sample does not reach a final equilibrium, which is highly possible in a YSZ system due to its extremely slow kinetics, the measured enthalpy of this sample will be different to that of the same sample in its final equilibrium state.

Since the CALPHAD approach was applied in this study, the Gibbs energy of bulk YSZ is predictable in a wide range of temperatures. Therefore, the Gibbs energy of bulk YSZ for each phase was predicted with the CALPHAD approach at different temperatures between 25 and 500 °C. By considering the effect of surface energy, the n-YSZ phase diagram at various temperatures is predicted as shown in Fig. 7. The specific surface energy of a crystal structure depends on the temperature.25 Accordingly, the specific surface energy at a determined particle size and composition will change with temperature. In this study, the changes in specific surface energy by increasing the temperature up to 500 °C were assumed to be small and negligible.


image file: c5ra24330k-f7.tif
Fig. 7 Phase diagrams for the n-YSZ system at 25, 100, 250, and 500 °C (M: monoclinic, T: tetragonal, C: cubic, A: amorphous).

Comparing the four diagrams in Fig. 7, the c-ZrO2 region is enlarged with the increase in temperature. The stability range of m-ZrO2 shrinks and the T/C curve shifts toward the left side of the graph and also moves up when the temperature increases. The changes in the stability range of phases with temperature clearly show how the crystal structure and as a result, material properties, change. For example, based on Fig. 7, a 10n-0.01YSZ system (YSZ with yttria mole fraction of 0.01 and particle size of 10 nm) is tetragonal at room temperature which changes to cubic at temperatures of around 500 °C. This phase transition can affect the material properties which are directly linked to the crystal structure.

One may argue that a phase diagram for nanoparticles at high temperatures is not applicable because nanoparticles will encounter coarsening at high temperatures. However, the phase diagram for nanoparticles can clearly reveal the effect of temperature increase and coarsening on the phase transition.

Interestingly, according to Fig. 7, the cubic/amorphous (C/A) curve is predicted not to change considerably with increasing temperature. This prediction is due to the effect of surface energy which is greatly dominant rather than the bulk Gibbs energy since the particle size in the amorphous region is extremely small (eqn (2)). Since the specific surface energy was assumed to be constant with temperature changes, the surface energy does not change with temperature and this causes the C/A curve to be approximately fixed with respect to temperature changes.

The shift of the T/C curve vs. temperature is less than that of the monoclinic/tetragonal (M/T) curve as can be seen in Fig. 7. According to Fig. 6, in the temperature range of 25 to 500 °C, the slope of the T0 line is sharper than that of the T0 temperature line. This slope difference is the reason for the milder shift of the T/C curve compared with the M/T curve vs. temperature change. As an example of the shifting amount of each curve vs. temperature, Fig. 8 shows the shifting behavior of M/T, T/C, and C/A curves when temperature increases for n-0.01YSZ.


image file: c5ra24330k-f8.tif
Fig. 8 The changes of particle size vs. temperature for each boundary curve of n-0.01YSZ (nano-YSZ with 0.01 mole fraction of Y2O3).

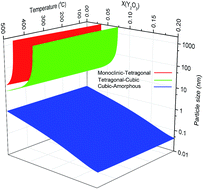
By combining the phase diagrams at different temperatures, a 3-D phase diagram was achieved in which the phase regions are predicted based on the particle size, mole fraction of yttria and temperature. Fig. 9 indicates the 3-D phase diagram for an n-YSZ system from different angles.


image file: c5ra24330k-f9.tif
Fig. 9 The 3-D phase diagram for an n-YSZ system from different angles.

5. Conclusion

The phase diagram for an n-YSZ system at room temperature was developed using the bulk Gibbs energies from the CALPHAD approach and specific surface energies of each crystal structure. With the advantage of the CALPHAD approach characteristics, the total Gibbs energy of an n-YSZ system at higher temperatures was predicted and the 3-D diagram for the zirconia rich side was developed at temperatures up to 500 °C for the first time, by which the stability range of each phase in the n-YSZ system is predicted based on particle size, composition, and temperature. Based on the 3-D diagram, the c-ZrO2 and t-ZrO2 regions become more stable and wider when temperature increases while the m-ZrO2 region shrinks. It was shown that the CALPHAD approach plays a pivotal role in designing a predictive phase diagram for nanoparticles. It was indicated that the CALPHAD approach is capable to be used for predicting the Gibbs energy of amorphous phases by considering few assumptions.

Acknowledgements

This work was supported by the Florida International University startup funding and also the American Chemical Society Petroleum Research Fund (PRF#54190-DNI10). Professor Ricardo Castro from UC Davis and professor Surendra K. Saxena from FIU are greatly acknowledged for technical discussions.

References

  1. C. H. Wang, M. C. Wang, J. K. Du, Y. Y. Sie, C. S. Hsi and H. E. Lee, Phase transformation and nanocrystallite growth behavior of 2 mol% yttria-partially stabilized zirconia (2Y-PSZ) powders, Ceram. Int., 2013, 39, 5165–5174 CrossRef CAS .
  2. J. Chevalier, L. Gremillard, A. V. Virkar and D. R. Clarke, The tetragonal-monoclinic transformation in zirconia: Lessons learned and future trends, J. Am. Ceram. Soc., 2009, 92, 1901–1920 CrossRef CAS .
  3. J. R. Kelly and I. Denry, Stabilized zirconia as a structural ceramic: An overview, Dent. Mater., 2008, 24, 289–298 CrossRef CAS PubMed .
  4. A. Nakamura and J. B. Wagner, Defect structure, ionic conductivity, and diffusion in yttria stabilized zirconia and related oxide electrolytes with fluorite structure, J. Electrochem. Soc., 1986, 133, 1542–1548 CrossRef CAS .
  5. D. W. Strickler and W. G. Carlson, Ionic Conductivity of Cubic Solid Solutions in the System CaO-Y2O3-ZrO2, J. Am. Ceram. Soc., 1964, 47, 122–127 CrossRef CAS .
  6. Y. Li, Z. Tang, Z. Zhang and J. Gong, Electrical conductivity of zirconia stabilized with yttria and calcia, J. Mater. Sci. Lett., 1999, 18, 443–444 CrossRef CAS .
  7. J.-P. Brog, C.-L. Chanez, A. Crochet and K. M. Fromm, Polymorphism, what it is and how to identify it: a systematic review, RSC Adv., 2013, 3(38), 16905–16931 RSC .
  8. R. Grossand A. Marx, Festkörperphysik, De Gruyter, 2014, ch. 5.2.3 Search PubMed .
  9. C. Lpez-Gándara, F. M. Ramos and A. Cirera, YSZ-based oxygen sensors and the use of nanomaterials: A review from classical models to current trends, J. Sens., 2009, 2009 DOI:10.1155/2009/258489 .
  10. R. H. R. Castro, On the thermodynamic stability of nanocrystalline ceramics, Mater. Lett., 2013, 96, 45–56 CrossRef CAS .
  11. R. C. Garvie, The occurrence of metastable tetragonal zirconia as a crystallite size effect, J. Phys. Chem., 1965, 69, 1238–1243 CrossRef CAS .
  12. R. C. Garvie and P. S. Nicholson, Phase analysis in zirconia systems, J. Am. Ceram. Soc., 1972, 55, 303–305 CrossRef CAS .
  13. N. S. Jacobson, L. Kaufman, F. Zhang and C. Llc, Thermodynamic Modeling of the YO1.5–ZrO2 System, J. Am. Ceram. Soc., 2004, 87, 1559–1566 CrossRef CAS .
  14. Y. Du, Z. Jin and P. Huang, Thermodynamic Assessment of the ZrO1–YO1.5 System, J. Am. Ceram. Soc., 1991, 74, 1569–1577 CrossRef CAS .
  15. M. Chen, B. Hallstedt and L. J. Gauckler, Thermodynamic modeling of the ZrO2–YO1.5 system, Solid State Ionics, 2004, 170, 255–274 CrossRef CAS .
  16. H. Ding, A. V. Virkar and F. Liu, Defect configuration and phase stability of cubic versus tetragonal yttria-stabilized zirconia, Solid State Ionics, 2012, 215, 16–23 CrossRef CAS .
  17. M. J. Mayo, A. Suresh and W. D. Porter, Thermodynamics For Nanosystems: Grain And Particle-Size Dependent Phase Diagrams, Rev. Adv. Mater. Sci., 2003, 5, 100–109 CAS .
  18. J. a. Krogstad, M. Lepple, Y. Gao, D. M. Lipkin and C. G. Levi, Effect of yttria content on the zirconia unit cell parameters, J. Am. Ceram. Soc., 2011, 94, 4548–4555 CrossRef CAS .
  19. J. W. Drazin and R. H. R. Castro, Phase Stability in Nanocrystals: A Predictive Diagram for Yttria-Zirconia, J. Am. Ceram. Soc., 2015, 98, 1377–1384 CrossRef CAS .
  20. J. W. Drazin and R. H. R. Castro, Water adsorption microcalorimetry model: Deciphering surface energies and water chemical potentials of nanocrystalline oxides, J. Phys. Chem. C, 2014, 118, 10131–10142 CAS .
  21. B. Jansson, Trita-Mac-0234, R. Inst. Technol., Stock., Sweden, 1984.
  22. L. Kaufman and M. Cohen, Thermodynamics and kinetics of martensitic transformations, Prog. Met. Phys., 1958, 7, 165–246 CrossRef CAS .
  23. D. A. Porter, K. E. Easterling and M. Sherif, Phase Transformations in Metals and Alloys, (Revised Reprint), CRC Press, 2009 Search PubMed .
  24. V. M. Samsonov, A. N. Bazulev and N. Y. Sdobnyakov, On applicability of Gibbs thermodynamics to nanoparticles, Cent. Eur. J. Phys., 2003, 3, 474–484 Search PubMed .
  25. T. Frolov and Y. Mishin, Temperature dependence of the surface free energy and surface stress: An atomistic calculation for Cu(110), Phys. Rev. B: Condens. Matter Mater. Phys., 2009, 79, 4–15 Search PubMed .

This journal is © The Royal Society of Chemistry 2016
Click here to see how this site uses Cookies. View our privacy policy here.