DOI:
10.1039/C5RA24169C
(Paper)
RSC Adv., 2016,
6, 7838-7845
Highly sensitive and selective ethanol and acetone gas sensors by adding some dopants (Mn, Fe, Co, Ni) onto hexagonal ZnO plates
Received
16th November 2015
, Accepted 6th January 2016
First published on 11th January 2016
Abstract
1 mol% Mn-, Fe-, Co- and Ni-doped and single phase hexagonal ZnO plates have been synthesized via a simple low temperature hydrothermal method using D-ribose as a template. The influence of the dopant species on the structural, optical and sensing properties was studied using X-ray diffraction (XRD), scanning electron microscopy (SEM), UV-vis spectroscopy, photoluminescence (PL) and a gas sensor characterization system. The results show that the dopant species have a significant effect on the morphology, crystallite size, photoluminescence and sensing properties. Co-doped ZnO shows the highest response, of 570, and selectivity to 300 ppm ethanol, compared to the other sensors. In addition, the Mn- and Ni-doped ZnO sensors show a selective response to acetone in the presence of CO and ethanol, while Fe-doped ZnO shows no considerable response to CO, ethanol and acetone gases.
1. Introduction
Many industrial and commercial activities involve the monitoring and control of the environment, with applications ranging from domestic gas alarms and medical diagnostic systems to safety, environmental and chemical plant instrumentation. The largest barrier to achieving an improved process or environmental control often lies at the interface between the system and the environment to be monitored, i.e. the sensor. Without sensors, significant advances in control and instrumentation will not be possible.1 Semiconductor sensors detect gases via a chemical reaction that takes place when the gas comes into direct contact with the sensor. Among these semiconductors, zinc oxide is an interesting compound with a wide band gap of ∼3.37 eV, which is suitable in many fields, such as solar cells, piezoelectric devices, electromagnetic shielding and gas sensors.2 ZnO, as one of the most important materials for gas sensors, has already shown good responses to pollutant gases such as H2S, SO2, CO2, and benzene,3,4 and explosive gases such as H2, CH4, CO, ethanol and acetone.5–7 In addition, doping of ZnO with different elements, such as noble metals, transition metals, or metal oxides, has been reported to be beneficial in order to ameliorate the electrical conductivity when it is used in gas sensing devices. For example, Navale et al. observed that undoped ZnO responds tangibly to LPG while a Ru doped ZnO sample is highly sensitive to ethanol vapors.8 Niu et al. used Fe, Co, and Cr as dopants to improve the gas sensing properties of pure ZnO, and the results demonstrated that ZnFe2O4 had a high sensitivity and good selectivity to Cl2.9 Zhang et al. found that a TiO2-doped ZnO sensor exhibited a remarkably enhanced response to 100 ppm toluene, even at a lower temperature of 290 °C.10 Ning et al. found that Sn and Fe dopants increased the gas response of ZnO to formaldehyde at 300 °C, while a Ti dopant decreased the gas sensing properties of ZnO.11 In this investigation, we studied the effect of doping on the morphology, crystal structure, band gap, crystal defect and gas sensing properties of ZnO. We used four typical dopants, Mn, Fe, Co and Ni, to study their effects on gas sensing response and selectivity.
2. Experimental
2.1. Preparation of ZnO and Mn-, Fe-, Co- and Ni-doped ZnO
All chemicals were prepared using a hydrothermal method and the concentration of the dopants was 1.0 mol% (mole ratio of dopant to Zn was 0.01). 5 mmol of Zn(Ac)2·2H2O and 10 mmol of ribose were dissolved in 50 mL of distilled water, were mixed and the stirring was continued for 30 min at room temperature. After stirring, 0.05 mmol of Mn, Fe, Co or Ni acetate was added to the solution, which was again stirred for 30 min. After that time, 10 mmol of NaOH was added to the solution. The achieved solution was then transferred to a Teflon lined autoclave, which was sealed and heated to 90 °C for 2 h. After completion of the reaction, the autoclave was allowed to cool at room temperature, then the sample was washed with water serially and dried at room temperature. The samples, after doping with Mn, Fe, Co and Ni, will be named Mn–ZnO, Fe–ZnO, Co–ZnO and Ni–ZnO, respectively.
2.2. Characterization
The morphology and size of the products were characterized using scanning electron microscopy (SEM Holland Philips XL30). The crystalline phase was determined using powder X-ray diffraction (XRD using λ (Cu Kα) = 1.5418 Å). The PL spectra were recorded at room temperature using a 300 nm excitation from a Xe lamp (Avantes/Avaspec 2048). The ultraviolet-visible (UV-vis) absorption spectra were measured using a spectrophotometer (Rayleigh).
2.3. Gas sensing measurements
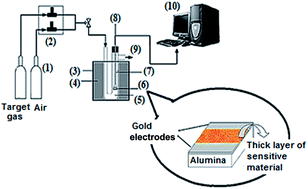
A homogeneous paste of ZnO, and Mn-, Fe-, Co- and Ni-doped ZnO was prepared by the addition of water. The paste was screen-printed onto an alumina substrate, on which gold electrodes were deposited. The sensors were dried and calcined at 400 °C for 4 h. Then, the sensors were located in a quartz holder in a furnace, the temperature of which was controlled by a PID temperature controller. The sensor was connected to an electrical circuit using platinum wires. The DC electrical measurement was made using a voltage of 4.0 V applied at a known resistance in series with the sensor.
The DC voltage across the sensor was read out using an A/D converter interfaced to a computer for further processing. The electrical resistance of the sensors was measured in air and in the target gases of ethanol, CO and acetone in a working temperature range of 200 °C to 400 °C. The gas response was defined by S at the ratio Ra/Rg, where Ra is the electrical resistance of the sensors in air and Rg is their resistance in 300 ppm CO, ethanol and acetone, at the same temperature. Fig. 1 shows the schematic diagram of the gas sensor system.
 |
| Fig. 1 Schematic diagram of the gas sensor system including: (1) gas capsules, (2) gas mass flow controller, (3) steel furnace, (4) asbestos, (5) glass reactor, (6) location sensor (schematic diagram of the gas sensor structure), (7) glass tubes and platinum wires, (8) thermocouple, (9) gas output, (10) computer. | |
3. Results and discussions
3.1. Crystal structure and morphology
X-ray diffraction (XRD) was performed to determine the crystalline structures of the samples. Fig. 2 shows the XRD patterns of the undoped and Mn–, Fe–, Co– and Ni–ZnO. The observed diffraction reflections, i.e. (100), (002), (101), (102), (110), (103), (200), (112) and (201) are similar to bulk ZnO and correspond to the wurtzite hexagonal phase of ZnO with the standard JCPDS data card no. 36-1451. No reflection characteristics related to Mn, Fe, Co, Ni or other related metal oxides or other crystalline forms are observed in the pattern, indicating that either the Mn, Fe, Co or Ni ions replace the Zn ions in the lattice of the ZnO crystals due to smaller or similar ionic radii or the formed crystallites are too small to be detected via XRD.12 Scanning electron microscopy (SEM) was employed to study the morphology of the samples. The morphologies of the undoped and doped ZnO are shown in Fig. 3, which shows that all of the samples are in a hexagonal plate structure, except for Ni–ZnO which is structured as rods with hexagonal plate cross sections. Its average height and diameter is 1000 and 400 nm, respectively. Mn–ZnO shows the smallest hexagonal plate with an average height and diameter of 100 and 175 nm, respectively (Table 1). The main reason for these different morphologies is the different ionic radii of the dopants. Mn2+ (0.066 nm) and Fe2+ (0.063 nm) have larger radii than Zn2+ (0.060 nm), while Co2+ (0.058 nm) and Ni2+ (0.055 nm) have smaller radii.13,14 Wu et al.15 pointed out that dopant atoms had a strong influence on the morphology and the doping process is a kinetic equilibrium process of thermodynamic equilibrium and dynamic equilibrium.
 |
| Fig. 2 XRD patterns of the (a) ZnO, (b) Mn–ZnO, (c) Fe–ZnO, (d) Co–ZnO and (e) Ni–ZnO samples. | |
 |
| Fig. 3 SEM images of the (a) ZnO, (b) Mn–ZnO, (c) Fe–ZnO, (d) Co–ZnO and (e) Ni–ZnO samples. | |
Table 1 Morphologies, diameter sizes and band gaps of the ZnO and doped ZnO nanostructured samples
Sample |
Morphology |
Average height and diameter of hexagonal plate (nm) |
Band gap (eV) (experimental) |
ZnO |
Hexagonal plates |
175 and 1000 |
3.27 |
Mn–ZnO |
Hexagonal plates |
75 and 100 |
3.24 |
Fe–ZnO |
Hexagonal plates |
150 and 250 |
3.21 |
Co–ZnO |
Hexagonal plates |
150 and 600 |
3.24 |
Ni–ZnO |
Nanorods with hexagonal plate cross sections |
1000 and 400 |
3.26 |
On the other hand, the incorporation of a dopant into the host is hindered by an increase of surface energy and lattice distortion. In particular, the thermodynamically unfavored, purely kinetically driven growth of a one dimensional structure is often restrained.15 Moreover, Zn2+ is tetrahedrally coordinated with four O2− ions, and the dopant ions are systematically substituted into the Zn2+ ion sites within the ZnO crystal lattice in the same coordination without changing the wurtzite structure of the parent ZnO, which is in good agreement with earlier reports.11 However, when Zn2+ is substituted with Ni, the morphology becomes rod-like with a hexagonal cross section. This means that Ni doping may decrease the nucleation rate of Ni–ZnO and hydrothermal production, which is helpful for the regular growth of the Ni–ZnO nanorods. According to a previous paper, it is reasonable to suggest that Ni doping favors the growth of ZnO rods.14
3.2. UV-vis absorption and PL spectra
It is well known that a dopant can affect the crystal defect and band gap of a semiconductor.16 Thus, we studied the band gap of undoped and doped ZnO using UV-vis reflectance and absorption spectra. Fig. 4 shows the observed UV-vis absorption spectra of the samples. Summarized in Table 1, the band gaps of the samples are calculated based on the maximum absorption waves, according to the Kubelka–Munk equation: α = K(hν − Eg)(1/n)/hν, where α is the absorption coefficient, Eg is the band gap energy (eV), K is a constant, n equals 0.5 for indirect transition and 2 for direct transition and ZnO is considered as a direct semiconductor. The band gaps of the doped ZnO samples are smaller than that of undoped ZnO. The smallest band gap is for Fe–ZnO.
 |
| Fig. 4 UV-vis adsorption and reflectance spectra of the ZnO and doped ZnO nanostructure samples. | |
The experimental band gap energy of the undoped ZnO, which is around 3.27 eV, was adopted as the benchmark to correct the calculated values of the ZnO band gaps.
Photoluminescence (PL) spectroscopy is a significant instrument to characterize the intrinsic and extrinsic defects in semiconductors. Fig. 5 and 6 show the PL spectra of all the samples using an excited wavelength of 300 and 400 nm, respectively. As shown in Fig. 5, there is a peak in the range of 380–390 nm in all samples that is attributed to the band edge excitonic luminescence of ZnO and doped ZnO. The defects could affect the position of the band edge emission as well as the shape of the luminescence spectrum.17 For all samples, except Fe– and Ni–ZnO, there are two blue emission bands in the range of 420–425 nm and at 488 nm. In addition, there is another blue emission band in the range of 445–450 nm for all samples.
 |
| Fig. 5 PL spectra of the ZnO and doped ZnO samples using an excitation wavelength of 300 nm. | |
 |
| Fig. 6 PL spectra of the ZnO and doped ZnO samples using an excitation wavelength of 400 nm. | |
Blue emission in the range of 420–425 nm is usually attributed to near band edge (NBE) emission due to free exciton recombination.18 The emission at about 488 nm is related to deep level emissions (DLE). This emission in ZnO has been frequently ascribed to several intrinsic and extrinsic defects that are due to electron recombination in the oxygen vacancy with a hole in the valence band.19
The peaks at 445–450 nm are attributed to different defects associated with the host lattice.
As shown in Fig. 6, there are two green emission bands at 530 and 590 nm. These bands are related to oxygen vacancies.
3.3. Gas sensing properties
3.3.1 Working temperature. The sensor response of undoped and doped-ZnO towards CO, C2H5OH and CH3COCH3 was investigated at various temperatures. The sensor response (S) is defined as S = Rair/Rgas, where Rair and Rgas are the resistance of the sensors in the presence of air and the target gas, respectively. Fig. 7 shows the sensor responses (S) to the gases measured in the temperature range of 200 °C to 400 °C.
 |
| Fig. 7 Response of ZnO and doped ZnO nanostructure sensors as a function of operating temperature to 300 ppm CO, ethanol and acetone. | |
All of the sensors exhibit maximum responses to CO, ethanol and acetone at 300 °C. On the other hand, the responses increase and reach their maximums at 300 °C, and then decrease rapidly with increasing temperature. According to a paper,20 this tendency results from the competition between slow kinetics at low temperatures and enhanced desorption at high temperatures.
Further, the increase in response with increasing working temperature can be explained by adsorption and desorption of oxygen. With an increasing testing temperature, the response increases for the sensors based on ZnO due to increasing the number of surface electrons. This causes the sensor to dissociate and adsorb higher amounts of oxygen molecules at the active sites. As a result, a depletion layer forms and the resistance increases. When the number of adsorbed oxygen molecules increases, the number of electrons withdrawing from the ZnO will increase and thus depletion layer formation will be larger. When reducing gases react with this adsorbed oxygen the change in resistance is higher which leads to improvement of the response. Therefore, response increases with increasing temperature.21
3.3.2 Sensor response and selectivity. Gas sensors for practical applications are required to have a very good sensor response and selectivity to the targeted molecules. Three typical gases (ethanol, acetone and CO) were selected as target gases to investigate the gas response at operating temperatures of 200–400 °C. The undoped ZnO and Co–ZnO gas sensors (Fig. 7) show good selectivity to ethanol, while, the Mn– and Ni–ZnO gas sensors show good selectivity to acetone gas. The maximum response of the Co–ZnO sensor to ethanol is 570 at 300 °C, whereas this sensor shows little response to CO and acetone.This sensor shows the highest response to ethanol compared with the other sensors. The response of this gas sensor to ethanol is more than 4 times higher than that of the undoped ZnO sensor. The maximum response of the Mn–ZnO sensor to acetone is 30 at 300 °C, whereas this sensor shows little response to ethanol and CO. The response of this gas sensor to acetone is about 1.5 times higher than that of the Ni–ZnO sensor. In contrast, the Fe–ZnO sensor shows no considerable responses to all of the mentioned gases. Fig. 8 shows the variation in sensor response of the Mn–ZnO sensor with the acetone concentration ranging from 50 ppm to 300 ppm. The sensor response is linear in this range of acetone concentration. When the sensor is exposed to 50 ppm acetone, the sensor response is ∼6, and as the acetone concentration is raised to 300 ppm, the sensor response increases nearly linearly up to ∼30.
 |
| Fig. 8 The variation in sensor response of the Mn–ZnO sensor with the acetone concentration ranging from 50 ppm to 300 ppm. | |
3.3.3 Response–recovery characteristics. Response and recovery times are defined as the time required, after switching from air to gas and vice versa, to reach a 90% response and return to the original resistance, respectively. Table 2 shows the response and recovery times of some of the sensors, such as undoped ZnO, and Co– and Mn–ZnO sensors. These selected Co– and Mn–ZnO sensors show the highest selectivity to ethanol and acetone gas, respectively. The response time to ethanol gas for undoped ZnO and Co–ZnO is ∼2 and ∼1 min at 300 °C, respectively. In addition, the response time to acetone gas for undoped ZnO and Mn–ZnO is ∼2 and ∼3 min at 300 °C, respectively.
Table 2 Response and recovery times of ZnO, Mn–ZnO and Co–ZnO sensors for different gases at 300 °C
Gas |
Sample |
T = 300 °C |
Response time (s) |
Recovery time (min) |
CO |
ZnO |
50 |
4 |
Mn–ZnO |
40 |
5 |
Co–ZnO |
200 |
8 |
Ethanol |
ZnO |
100 |
35 |
Mn–ZnO |
200 |
8 |
Co–ZnO |
50 |
5 |
Acetone |
ZnO |
120 |
5 |
Mn–ZnO |
200 |
7 |
Co–ZnO |
140 |
12 |
In n-type oxide semiconductors such as ZnO, the sensing response interaction to reducing gas involves in-diffusion of the target gas onto the sensing body surface and subsequent oxidation by negatively charged adsorbed oxygens, i.e. O− or O2−.22 The rapid response of the sensors indicates that the diffusion and its oxidation with O− or O2− occur very speedily. Response time is dependent on grain size and the size of the particle boundary in the material.23 The smaller the size of the particles, the slower the response time due to more diffusion of gas molecules. For Co–ZnO, the more rapid response to ethanol compared to undoped ZnO is due to a smaller crystallite size. While, Mn–ZnO, with the smallest crystallite size, shows a slower response than undoped ZnO. In some sensors, high responses imply slow response times. Covalent bonding in sensitive materials reduces sensitivity and increases the response times of these gas sensors.23 On the other hand, the recovery time values of the ZnO and Co–ZnO sensors at 300 °C to 300 ppm ethanol are 35 and 5 min, respectively. The overly long recovery times, particularly for the ZnO sensor at 300 °C, can be attributed to the inert surface adsorption, dissociation, and ionization of oxygen at the relatively low sensing temperatures.24 Fig. 9 shows response transients of the Co–ZnO sensor at 200–400 °C for 300 ppm ethanol gas.
 |
| Fig. 9 Response transients of the Co–ZnO sensor at 200–400 °C for 300 ppm ethanol gas. | |
3.3.4 Resistance change of the sensors with temperature and dopants. Fig. 10 shows the resistances of the sensors in air at 200–400 °C as a function of temperature. As shown in this figure it is clear that the resistance decreases as the temperature increases showing the semiconducting behavior of ZnO. The addition of dopants results in an extensive increase in the value of Rair, except for the Fe dopant. On doping ZnO with Co, Mn and Ni, the disorder produced in the lattice of ZnO is due to the difference between the ionic radii of Zn2+ and these ions. This disorder increases the efficiency of scattering mechanisms such as phonon scattering and ionized impurity scattering which, in turn, causes an increase in resistivity.25
 |
| Fig. 10 Resistances of the sensors in air as a function of temperature. | |
On the other hand, the doping of the ZnO with these donor dopants creates electronic defects in the same way that Al doping of ZnO does,26 which causes the variations in the adsorbed oxygen. This develops a potential barrier which enhances the resistance of the material.27
The increase in resistivity is related to the strong oxygen adsorption on the doped ZnO surface at a lower temperature, such as 200 °C. With an increasing temperature, the resistivity decreases, probably due to the dominant thermal excitation of electrons and the desorption of oxygen species.25 While, in Fe–ZnO, the resistivity reduces in comparison with undoped ZnO. It has been reported in some previous studies,28 that when Fe ions are substituted with Zn2+ ions in the tetrahedral sites of the wurtzite structure of ZnO, the valence state of Fe in ZnO is both +2 and +3, namely Fe in the ZnO matrix exists in a mixed valence state. Probably, the presence of Fe3+ ions in the Fe–ZnO sample is expected to give rise to donor defects, thereby making the sample more conducting.29
3.3.5 Gas sensing mechanism. The difference in the gas sensing properties of undoped and doped ZnO for ethanol, acetone and CO gases can be explained by considering their sensing mechanism. A schematic representation of the sensing mechanism is shown in Fig. 11. Gas sensing in ZnO sensors is based on the resistance change due to the chemical and electronic interaction between the gas and the ZnO.30
 |
| Fig. 11 Schematic diagram of the gas sensing mechanism. | |
When a ZnO sensor is exposed to air, oxygen molecules adsorb on the surface of the materials to form O2−, O−, O2− ions by capturing electrons from the conduction band. This leads to the formation of a thick space-charge layer which increases the potential barrier, and therefore, results in a higher resistance.
When the ZnO sensor is exposed to CO, ethanol and acetone the adsorbed gas then reacts with the chemisorbed oxygen anions of the surface, the reaction can be described as follows:
|
CH3CH2OH(ads) + 6O−(ads) → 2CO2(g) + 3H2O(l) + 6e−
| (2) |
|
CH3COCH3(ads) + 8O−(ads) → 3CO2(gas) + 3H2O(gas) + 8e
| (3) |
The gas molecules will react with the adsorbed O− to form CO2 and H2O, and release the trapped electrons back to the conduction band. The released electrons will reduce the thickness of the depletion region, and decrease the resistance of the ZnO. The doping of the ZnO by Co, Ni and Mn creates electronic defects and also changes the surface morphology of the films, which causes variations in the adsorbed oxygen. This develops a potential barrier which enhances the resistance of the material.26 When doped ZnO is exposed to the gas (ethanol, acetone or CO), the chemisorbed oxygen will react with the gas molecules due to the sensing reaction and re-inject the free carriers, thereby the resistance of the ZnO and doped ZnO reduce. The observed variations in the response of the ZnO films to various dopants can be attributed to the variations in the electronic defects created due to the different dopants and to the variations in the adsorbed oxygen quantity.31–33
In addition, the gas sensing performance of ZnO is also largely found to be dependent on the surface morphology.34
Recent studies have revealed the surface structures and composition to be the essential factors governing the efficiency of gas sensing properties. They demonstrated that the enhancement in the sensitivity of ZnO is attributed to the surface polarities of the different structures in the nanoscale.35–37
The polar [0001] and the [000
] surfaces are among the most common crystal orientations of ZnO, which are capable of seizing atmospheric oxygen (O2) through physical/chemical absorption due to unsaturated oxygen coordination. So, the (0001) facet has the highest chemisorption ability. The easy hydroxylation of this surface causes a metallization of the surface which can affect the conductivity response of such samples.34 Most of the exposed surfaces of undoped ZnO, Mn–ZnO and Co–ZnO with hexagonal plate morphologies are the Zn-terminated (0001) facets, and accordingly their performances as ethanol gas sensors are significantly enhanced compared to the Ni–ZnO sensor with a rod morphology.
In addition, the used dopants can significantly affect the sensing behavior of our gas sensors, especially the selectivity. These small dopant particles are located on the surface of a much bigger grain of zinc oxide, so their distribution is assumed to be more or less homogenous.21 According to spillover or the catalytic effect model,21 the dopants can act as catalysts to facilitate the activation of certain gas particles, meaning reactions can be accelerated and will influence the conductance, if the reaction takes place on the sensitive oxide surface. If a given catalyst facilitates the activation for only a definite gas, a higher selectivity can be obtained as we can observe in our sensors.
4. Conclusion
In summary, ZnO and doped ZnO nanostructures were prepared using a simple hydrothermal method. A systematic investigation into the effect of dopants on the sensing properties of the host ZnO crystals was presented. The results displayed that the use of dopants affects the structural, morphological, photoluminescence (PL), and sensing properties of ZnO. Co doped ZnO and undoped ZnO were selective sensors for ethanol and Ni–ZnO and Mn–ZnO were selective to acetone, while Fe–ZnO did not show a considerable response to the gases.
Acknowledgements
This work was supported by the Research Council of Shahid Rajaee Teacher Training University.
References
- P. T. Mosely and B. C. Tofield, Solid State Gas Sensor, Adam Hilger, Bristol and Philadelphia, 1987 Search PubMed.
- L. Schmidt-Mende and J. L. Mac Manus-Driscoll, Mater. Today, 2007, 10, 40–48 CrossRef CAS.
- D. Calestani, M. Zha, R. Mosca, A. Zappettini, M. C. Carotta, V. D. Natale and L. Zanotti, Sens. Actuators, B, 2010, 144, 472–478 CrossRef CAS.
- M. J. S. Spencer and I. Yarovsky, J. Phys. Chem. C, 2010, 114, 10881–10893 CAS.
- W. T. Moon, Y. K. Jun, H. S. Kim, W. S. Kim and S. H. Hong, J. Electroceram., 2009, 23, 196–199 CrossRef CAS.
- Q. Wan, Q. H. Li, Y. J. Chen, T. H. Wang, X. L. He, J. P. Li and C. L. Lin, Appl. Phys. Lett., 2004, 84, 3654–3656 CrossRef CAS.
- J. Li, H. Q. Fan and X. H. Jia, J. Phys. Chem. C, 2010, 114, 14684–14691 CAS.
- S. C. Navale, V. Ravi and I. S. Mulla, Sens. Actuators, B, 2009, 139, 466–470 CrossRef CAS.
- X. Niu, W. Du and W. Du, Sens. Actuators, B, 2004, 99, 405–409 CrossRef CAS.
- Y. Zeng, T. Zhang, L. J. Wang, M. H. Kang, H. T. Fan, R. Wang and Y. He, Sens. Actuators, B, 2009, 140, 73–78 CrossRef CAS.
- N. Hana, L. Chaia, Q. Wang, Y. Tiana, P. Deng and Y. Chen, Sens. Actuators, B, 2010, 147, 525–530 CrossRef.
- N. Faal Hamedani, A. R. Mahjoub, A. A. khodadadi and Y. Mortazavi, Sens. Actuators, B, 2012, 169, 67–73 CrossRef.
- R. D. Shannon, Acta Crystallogr., Sect. A: Cryst. Phys., Diffr., Theor. Gen. Crystallogr., 1976, 32, 751–767 CrossRef.
- L. Yanmei, W. Tao, S. Xia, F. Qingqing, L. Qingrong, S. Xueping and S. Zaoqi, Appl. Surf. Sci., 2011, 257, 6540–6545 CrossRef.
- D. Wu, M. Yanga, Z. Huang, G. Yin, X. Liao, Y. Kang, X. Chen and H. Wang, J. Colloid Interface Sci., 2009, 330, 380–385 CrossRef CAS.
- K. Samanta, P. Bhattacharya and R. Katiyar, J. Appl. Phys., 2009, 105, 113929 CrossRef.
- A. B. Djurisic, Y. H. Leung, K. H. Tam, Y. F. H. Su, L. Ding, W. K. Ge, Y. C. Zhong, K. S. Wong, W. K. Chan, H. L. Tam, K. W. Cheah, W. M. K. Wok and D. L. Phillips, Nanotechnology, 2007, 18, 095702 CrossRef.
- Y. Jin, Q. Cui, K. Wang, J. Hao, Q. Wang and J. Zhang, J. Appl. Phys., 2011, 109, 053521 CrossRef.
- C. Karunakaran, J. Jayabharathi, K. Jayamoorthy and P. Vinayagamoorthy, J. Photochem. Photobiol., A, 2012, 247, 16–23 CrossRef CAS.
- C. Wang, L. Yin, L. Zhang, D. Xiang and R. Gao, Sensors, 2010, 10, 2088–2106 CrossRef CAS.
- P. Rai, R. Khan, R. Ahmad, Y.-B. Hahn, I.-H. Lee and Y.-T. Yu, Curr. Appl. Phys., 2013, 13, 1769–1773 CrossRef.
- Z. Dai, L. Xu, G. Duan, T. Li, H. Zhang, Y. Li, Y. Wang, Y. Wang and W. Cai, Sci. Rep., 2013, 3, 1669 Search PubMed.
- R. Vargas-Bernal and G. Herrera-Pérez, Nanotechnology for optics and sensors, 2014, 1–34 Search PubMed.
- Y. Zhang, J. Q. Xu, Q. Xiang, H. Li, Q. Y. Pan and P. C. Xu, J. Phys. Chem. C, 2009, 113, 3430–3435 CAS.
- P. P. Sahay and R. K. Nath, Al-doped ZnO thin films as methanol sensors, Sens. Actuators, B, 2008, 134, 654–659 CrossRef CAS.
- K. F. Cai, E. Müller, C. Drašar and A. Mrotzek, Mater. Sci. Eng., B, 2003, 104, 45–48 CrossRef.
- T. T. Trinh, N. H. Tu, H. H. Le, K. Y. Ryu, K. B. Le, K. Pillai and J. Yi, Sens. Actuators, B, 2011, 152, 73–81 CrossRef CAS.
- M. S. Shubra Singh and R. Ramachandra, Phys. Rev. B: Condens. Matter Mater. Phys., 2009, 80, 045210 CrossRef.
- H. Colak and O. Turkoglu, Synthesis, J. Mater. Sci. Technol., 2012, 28, 268–274 CAS.
- P. Rai and Y.-T. Yu, Sens. Actuators, B, 2012, 173, 58–65 CrossRef CAS.
- H. Gu, Z. Wang and Y. Hu, Hydrogen Gas Sensors, 2012, 12, 5517–5550 CrossRef CAS PubMed.
- S. M. Chou, L. G. Teoh, W. H. Lai, Y. H. Su and M. H. Hon, Sensors, 2006, 6, 1420–1427 CrossRef CAS.
- N. Singh, C. Yan and P. S. Lee, Sens. Actuators, B, 2010, 150, 19–24 CrossRef CAS.
- R. Kumar, O. Al-Dossary, G. Kumar and A. Umar, Nano-Micro Lett, 2015, 7(2), 97–120 CrossRef.
- N. Han, X. Wu, L. Chai, H. Liu and Y. Chen, Sens. Actuators, B, 2010, 150(1), 230–238 CrossRef CAS.
- M. R. Alenezi, A. S. Alshammari, K. D. G. I. Jayawardena, M. J. Beliatis, S. J. Henley and S. R. P. Silva, J. Phys. Chem. C, 2013, 117, 17850–17858 CAS.
- Y. V. Kaneti, Z. Zhang, J. Yue, Q. M. Zakaria, C. Chen, X. Jiang and A. Yu, Phys. Chem. Chem. Phys., 2014, 16(23), 11471–11480 RSC.
|
This journal is © The Royal Society of Chemistry 2016 |
Click here to see how this site uses Cookies. View our privacy policy here.