DOI:
10.1039/C5RA24134K
(Paper)
RSC Adv., 2016,
6, 1581-1588
Biostimulation by direct voltage to enhance anaerobic digestion of waste activated sludge†
Received
15th November 2015
, Accepted 16th December 2015
First published on 18th December 2015
Abstract
Electrical stimulation has been used conventionally for stimulation of microorganisms, and also be a promising technology to manage wastewater treatment by stimulating microbial metabolism. Previous studies on electrical stimulation were mainly focused on sewage treatment and groundwater purification, while little attention has been paid to its effect on anaerobic digestion of waste activated sludge (WAS). In this study, different voltages (0.3–1.5 V) were applied to investigate the influence of electrical stimulation on the anaerobic digestion of WAS. The results revealed that applied voltages could accelerate sludge hydrolysis and acidification process. The best performance in terms of methane production and sludge reduction was obtained with the applied voltage of 0.6 V. In this case, methane production increased by 76.2% with an enhanced VS removal rate (26.6%) compared to the control group. The energy consumption at 0.6 V could be neglected compared to the incremental energy generated from the methane. However, methane production decreased and hydrogen was produced when the applied voltage increased to 0.9 V. At higher voltages (1.2 V and 1.5 V), more soluble organic matters were released. In particular, the VFAs concentration peaked at 640 mg L−1 and 1001 mg L−1, respectively. Pyrosequencing revealed that hydrogenotrophic methanogens consisted majority of methanogen population when the applied voltage was over 0.6 V, while acetoclastic methanogens showed overwhelming dominance at 0.3 V. Moreover, 0.6 V enriched Pseudomonas for protein degradation and Methanoregula for methane generation with species richnesses of 19.1% and 53.3%, respectively.
1. Introduction
Waste activated sludge (WAS) produced during wastewater treatment processes has been received widespread public attention in China because of its huge production, potential environmental risk and high cost for disposal.1 Meanwhile, as the main by-product of biological wastewater treatment, WAS contains abundant proteins, polysaccharides, and lipids which can be turned into biogas anaerobic digestion.2 Anaerobic digestion of WAS is a cost-effective and sustainable technology to realize sludge stabilization, mass reduction and methane production simultaneously.3 However, the application of conventional anaerobic digestion is often limited by its long retention time, low removal efficiencies of organic compounds and low biogas production rate. These limiting factors are generally associated with the slow hydrolysis of sludge4 and the slow growth rate of the methanogenic bacteria. To enhance hydrolysis rate and methane production, various sludge pre-treatments including thermal,5 chemical and mechanical,6 as well as combinations of these7 have been developed. Sludge pre-treatments can destroy extracellular polymeric substances (EPS) or sludge cells, thus releasing and solubilizing intracellular materials into liquor phase and then making more materials readily available for microorganisms.4 However, most above-mentioned approaches require the input of considerable amount of energy and chemicals, which results in high operating cost and serious secondary pollution.8 Thus, it is necessary to develop economic and environment friendly methods to enhance methane production in WAS anaerobic digestion.
Electrical stimulation refers to a microbial process performed in the presence of electrolysis by low direct current.9 Previous study showed that the exposure to low direct current may lead to an enhanced fermentation of yeast10 and protein secretion of Fusarium oxysporum.11 However, negative effects of applied current have also been reported since microorganism could be inhibited when the applied current was too high to suffer. Previous studies have found that an electric current of 20 mA could increase the surface hydrophobicity and result in cell apoptosis.12 The main mechanisms of electrical stimulation may include (i) direct electrical stimulation of microbial metabolism, which may induce changes in DNA synthesis, protein synthesis10 and membrane permeability9 thus accelerating cell growth10,13,14 and (ii) direct effect on cultivation ambient for microorganisms. The abiotic reactions on the electrodes surface could influence the environment pH and alkalinity, which exerted indirect impact on microorganisms.15
The operation of electrical stimulation is easy and energy conservation. Therefore, the potential for practical application of electrical stimulation to microbial processes is high. Meanwhile electrical stimulation is a green and environment friendly technology. Electrical stimulation has been applied in sewage treatment, groundwater purification and soil remediation.13,16,17 However, applying electrical stimulation in sludge anaerobic digestion under practical conditions was still limited, and the relationship between stimulating effects and applied voltage was not established to date. In this study, low voltages were applied in the anaerobic digestion system for accelerating sludge digestion. The effects of low voltages on hydrolysis, acidification and methanogenesis of the WAS were investigated, with the aim to providing a simple and effective method to enhance sludge anaerobic digestion. To clarify the effects of low voltages on biogas generation and sludge reduction, the composition of soluble COD and VFAs were measured. Also, the diversity of microorganism communities in the anaerobic digestion was identified.
2. Materials and methods
2.1 Characteristics of sludge and inoculum
Raw sludge was obtained from the secondary sedimentation tank of a municipal wastewater treatment plant (MWWTP) in Shanghai, China. The raw sludge was screened with a 1.0 mm mesh to eliminate large particles and hair before thickening to required solid concentration. Then the thickened sludge was stored at 4 °C for further use. The seed sludge was collected from a long-term continuous lab-scale anaerobic reactor in our lab. Before the digestion, the raw sludge was mixed with the seed sludge with a ratio of 4
:
1 (based on VS). The main characteristics of seed sludge (inoculum) and sludge mixture are given in Table 1.
Table 1 Characteristics of seed sludge and sludge mixture used in the experiment
Parameters |
Seed sludge |
Sludge mixture |
pH |
7.82–7.90 |
7.52–7.62 |
Conductivity (mS cm−1) |
10.22–10.31 |
3.41–3.50 |
TS (total solid, g L−1) |
135.73–138.08 |
50.31–50.41 |
VS (volatile solid, g L−1) |
50.36–51.54 |
29.65–29.73 |
SCOD (soluble chemical oxygen demand, mg L−1) |
1150–1460 |
685–820 |
Soluble proteins (mg L−1) |
91.36–92.45 |
51.20–53.62 |
Soluble carbohydrates (mg L−1) |
213.50–215.30 |
145.0–147.20 |
TVFAs (total volatile fatty acids, mg L−1) |
726.0–730.1 |
72.0–73.5 |
2.2 Batch experiments
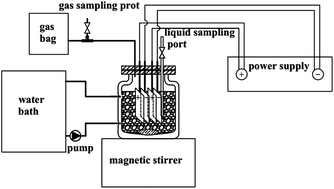
The batch experiments were carried out in six double-walled cylindrical vessels anaerobic reactors with an effective volume of 1 L (0.3 L headspace), as shown in Fig. 1. Two pairs of activated carbon fiber textile (ACF) electrodes were inserted into the reactor to form an electrical-anaerobic digestion (hereafter referred to as e-AD reactor). Each e-AD reactor consisted of two pairs of ACFs used as anode and cathode respectively. The electrode dimensions were 12 × 8 cm, with a distance of 1 cm between the electrodes, which were connected to a DC (Direct Current) power through copper wires. The applied voltages were fixed at 0.3 V, 0.6 V, 0.9 V, 1.2 V and 1.5 V, respectively. A common reactor without applied voltage was set as the control one. Before the start-up, oxygen was removed from the headspace by injecting nitrogen gas for 5 min after loading the sludge, and then sealed the reactors. A silica tube across the cap of reactors was connected to the gasbag. During the digestion, the biogas produced from each reactor was collected into gasbag, and the biogas in gasbag was drawn out by a syringe for measuring volume and component. All reactors were maintained at a mesophilic temperature of 35 ± 2 °C by water circulation, equipped with magnetic stirrers for mixing the sludge. The reactors were operated as a batch mode and the digestion lasted for 29 days.
 |
| Fig. 1 Schematic diagram of an e-AD reactor for WAS anaerobic digestion. | |
2.3 Analytical methods
Sludge samples collected from the reactors were analyzed for pH, total solids (TS) and volatile solids (VS) in triplicate. The pH was measured by a pH meter (pHs-3C, Leici Co. Ltd., Shanghai). Total solids (TS) and volatile solids (VS) were measured by gravimetric method before and after the digestion. The corresponding supernatant was obtained by centrifugation at 12
000 rpm for 5 min with a subsequent filtration through 0.45 μm pore size cellulose membrane filters. The supernatant was used for the analysis of SCOD, VFAs, carbohydrate and protein. SCOD was measured according to Standard Methods.18 Soluble proteins were analyzed according to the Bradford method19 with BSA (Bovine Serum Albumin) as standard while soluble carbohydrates were measured by the Anthrone method20 with glucose as standard. The concentration of methane and hydrogen content was analyzed by a gas chromatograph (GC-14B, Shimadzu) with a chromatographic column (TDX-02) and a thermal conductivity detector (TCD). VFAs (including acetic acid, propionic acid, butyric acid, iso-butyric acid, valeric acid and iso-valeric acid) were analyzed in another gas chromatograph (GC-2010, Shimadzu) with a chromatographic column (DB-FFAP: 30 m 0.25 mm 0.25 mm) and a flame ionization detector (FID). All experiments were repeated three times to obtain average values with an accuracy of ±5%.
2.4 DNA extraction and high throughput pyrosequencing
Anaerobic sludge was sampled from the bottom of the reactors on 29th day. The samples were washed with phosphate-buffered saline, after which the genomic DNA of the samples was extracted using an extraction kit (Felix bio-tech, USA) according to the manufacturer's instructions. The quality of the extracted DNA was checked by determining its absorbance at 260 and 280 nm, and agarose gel electrophoresis (AGE) was employed to test the DNA integrity. The PCR products of 16S rRNA gene were determined by pyrosequencing using Illumina MiSeq.21 Universal primers 8F (5′-AGAGTTTGATCCTGG CTCAG-3′) and 533R (5′-TTACCGCGGCTGCTGGCAC-3′) were used to amplify V1–V3 region (length of 455 bp) of the bacterial 16S rRNA gene. Archaeal were 787F (5′-ATTAGATACCCSBGTAGTCC-3′) and 1059R (5′-GCCATGCACCWCCTCT-3′).22 The PCR program consisted of an initial 5 min denaturation step at 94 °C, 27 cycles of repeated denaturation at 94 °C for 30 s, annealing at 54 °C for 30 s, and extension at 72 °C for 30 s, followed by final extension step of 5 min at 72 °C. Subsequently, the MOTHUR program was used to cluster effective sequences into operation taxonomic unit (OTU) by a 3% level. The effective sequences obtained from pyrosequencing were compared with Greengenes 16S rRNA gene database using NCBI's BLASTN tool, and the species distribution diagram was employed.23 Rarefaction curves, species richness estimator of Chao 1 and Shannon diversity index were analyzed according to the method described by Zhang et al.24
3. Results and discussion
3.1 Effect of different voltages on biogas production
Fig. 2 showed the current variations with time at the voltages of 0.3, 0.6, 0.9, 1.2 and 1.5 V, respectively. All the currents decreased from the beginning and gradually tended to be stable. The stable current density was 0.37, 0.41, 1.11, 2.24 and 2.55 A m−2 at the end of anaerobic digestion. It was obvious the stable current went up with the increase of applied voltages.
 |
| Fig. 2 Current production under different voltages. | |
The variations of cumulative methane production and methane yield with different voltages were shown in Fig. 3a. In the control group, the methane yield was 101.1 L CH4 per kg VS, whereas that was 140.9 L CH4 per kg VS at 0.6 V, 39.3% higher than the control. When the voltage increased to 0.9 V, the methane yield decreased to 58.1 L CH4 per kg VS. However the methane yield increased again when the applied voltage was higher than 0.9 V. The cumulative methane production at 0.6 V increased gradually from 1st to 19th day and no significant increase was observed later. The same trend was also obtained at 0 V and 0.3 V. Relatively, methane generated at 1.2 V and 1.5 V reached to the stable phase in a short period of 9 days, and that 0.9 V had a rapid inhibition and no distinct increase under the same conditions. Moreover, a specific methane production was also obtained at 0.6 V, 76.2% higher than the control group (834.3 mL). The results indicated that all applied voltages had positive effects on methane production except 0.9 V and the best stimulating performance was achieved at 0.6 V.
 |
| Fig. 3 Methane (a) and hydrogen (b) production during the anaerobic digestion. | |
In the e-AD reactor, methane was theoretically produced from two pathways. First, methane was generated from anaerobic digestion of sludge along with consumption of VFAs and hydrogen.25 Secondly, electrons from organics reacted with CO2 to produce methane via cathode reactions according to the following reaction:11
|
Anode: CH3COO− + 2H2O − 8e− → 2CO2 + 7H+, E = −0.28 V
| (1) |
|
Cathode: CO2 + 8H+ + 8e− → CH4 + 2H2O, E = −0.244 V
| (2) |
Among these e-AD reactors, methane production at 0.6 V was higher than others, indicating that 0.6 V increased methane production beyond cathode reaction (2). Thus we speculated that the activity of microbial metabolism was improved with the voltage of 0.6 V.
In this study, hydrogen was not detected at other groups except for 0.9 V, 1.2 V and 1.5 V (Fig. 3b). Moreover, the hydrogen production at 1.5 V reached the peak at 6th day and no significant increase was observed later. Hydrogen was an intermediate between acidification and methanogenesis, and could also be a product of water electrolysis in e-AD reactor according to Tartakovsky et al.:26
|
Cathode: 4H2O + 4e− → 2H2 + 4OH− E = −0.83 V
| (3) |
At standard conditions, reaction (3) requires a theoretical voltage of −0.83 V (vs. SHE) at pH 7. The undetectable hydrogen at 0.3 V and 0.6 V confirmed this consideration. Also, from the no hydrogen produced in the control, the generation of hydrogen from the acidification was also infeasible. Thus, the hydrogen produced at 0.9 V, 1.2 V and 1.5 V should be ascribed to the cathodic hydrogen production as described in reaction (3).
According to the contrast methane production under 0.9 V, 1.2 V and 1.5 V (Fig. 3a), it clearly revealed water electrolysis could significantly affect methane production.
|
Anode: 2H2O → O2 + 4H+ + 4e−, E = +1.23 V
| (4) |
Water electrolysis resulted in a continuous supply of oxygen (eqn (4)) and hydrogen (eqn (3)) when the applied voltages were 1.2 V and 1.5 V. The limited oxygen created micro-aerobic conditions, which improved methanogenic activity and methane yield.26,27 Moreover, a portion of the hydrogen produced electrolytically was converted to methane by hydrogenotrophic methanogens, increasing the net methane production. Thus, the failure of methanogenesis at 0.9 V might be attributed to excessive current, whereas the enhanced methane production at 1.2 V and 1.5 V was due to water electrolysis reactions as described in eqn (3) and (4).
3.2 Effect of different voltages on pH and sludge reduction
Fig. 4a describes the pH variations during the digestion. The pH of the digesters increased and was finally up to alkali pH ranges with the values of 7.57 (control), 7.56 (0.3 V), 7.48 (0.6 V), 8.41 (0.9 V), 8.12 (1.2 V) and 8.72 (1.5 V), respectively. It suggested that the pH of the e-AD reactors increased with applied voltages. This was seemingly resulted from the excessive utilization of H+ by the cathodic reduction of CO2 (eqn (2)) for producing CH4. The pH values of 0.9 V, 1.2 V and 1.5 V groups exceeded 8 when digested for 14 days while 0.3 V and 0.6 V groups were similar to the control group. It might be that the low applied voltages (0.6 V) were not enough to result in significant changes of pH. Methanogens grow at a neutral pH range (6.2–7.8) and the alkali pH (8) might inactivate methanogens to decrease the methane production.28 It was in agreement with the result of methane production at 0.9 V, 1.2 V and 1.5 V after 14 days' digestion (Fig. 3a).
 |
| Fig. 4 pH changes (a), VS/TS ratio and VS removal efficiency (b) of the reactors during the anaerobic digestion. | |
TS and VS before and after the anaerobic digestion were measured to verify the effect of applied voltages on sludge stabilization. The VS removal efficiencies of 27.8%, 33.0%, 35.2%, 25.6%, 34.7% and 39.3% were obtained with the applied voltage from 0 V to 1.5 V, as shown in Fig. 4b. This results indicated that electrical stimulation could significantly enhance the reduction of VS. The content of VS was lowest on 1.5 V (18.03 g L−1), at which the corresponding VS removal rate was 41.2% higher than the control. It suggested that the decomposition of sludge was more efficient at 1.5 V. The variations of organic matters in the solids were characterized in terms of the VS/TS ratio, and it decreased from 58.9% in the initial sludge to 50.1%, 47.8%, 45.3%, 48.5%, 42.7% and 40.8% later, respectively.
During the anaerobic digestion, the WAS would be finally mineralized into methane and carbon dioxide, accompanied with the sludge reduction.29 Generally, the methane yield and VS removal efficiency are positively correlated well. In this research methane yield at 0.9 V was the lowest (Fig. 3a), however its VS removal efficiency was higher than the control. As mentioned above, the pH values exceeded 8 after 14 days digestion and it kept increasing when the applied voltage was over 0.9 V. It has been demonstrated that alkaline environment can destroy sludge floc structure by hydroxy radicle.30 After destruction of EPS and gels, microbial cells were exposed to extreme pH thereby cannot keep the appropriate turgor pressure.31 In our study, the quantity of alkaline was not enough to damage microbial cells directly. However the sludge floc structure would be damaged when exposed to alkaline environment over a long period of time (Fig. 4a). Then the separated sludge microbial cells would die and release inner organic materials, thus enhancing sludge reduction. The high VS removal efficiency at 1.2 V and 1.5 V could also be attributed to this cause partly. Besides, micro-aerobic conditions at 1.2 V and 1.5 V could facilitate hydrolysis of WAS32,33 which partly contributed to high VS removal efficiency.
3.3 Effect of different voltages on sludge hydrolysis and acidification
During the anaerobic digestion of WAS, converting complex organic waste to soluble substrates in WAS is the first step and also the limiting step during the sludge anaerobic digestion process.1 SCOD was the production of the first two stages which mainly included soluble protein, soluble polysaccharide and VFAs. Hydrolysis and acidogenesis of sludge can be characterized by the changes in SCOD concentrations.34 Fig. 5a depicts the variations of SCOD during the digestion. Generally, SCOD in anaerobic fermentation kept increasing at the beginning of fermentation along with the hydrolysis and acidification of organic matters. Afterwards, SCOD would decrease when the soluble organic matters were gradually mineralized to CH4 and CO2.35 In our study, the SCOD increased rapidly and reached the maximum for the experiment groups in the initial 3 days, while the control group achieved its maximum after 6 days' digestion. The results indicated that the supplied voltages could accelerate hydrolysis step of anaerobic digestion. SCOD under the voltage of 0 V, 0.3 V and 0.6 V had same trends in line with traditional anaerobic digestion process, while 0.9 V, 1.2 V and 1.5 V showed different trends. SCOD under 0.9 V, 1.2 V and 1.5 V rose sharply to a high value on the 3rd day then kept a sharp decline on 14th day along with methane production, which was in line with traditional anaerobic digestion process. However, after 14 days digestion, SCOD under 0.9 V, 1.2 V and 1.5 V started to rise and remained this trend until the end of digestion, unlike 0 V, 0.3 V and 0.6 V. Changes in pH values (Fig. 4a) resulted in these differences since more organic substances were released with increase of pH after 14 days digestion for 0.9 V, 1.2 V and 1.5 V.
 |
| Fig. 5 Effect of different voltages on SCOD (a), TVFAs (b), acetic acid (c), propionic acid (d) concentrations in the supernatant. | |
VFAs are widely considered as process indicator during anaerobic process, because they are the main pre-methanogenic intermediates.36 Fig. 5b shows the changes in TVFAs under different applied voltages. The concentration of TVFAs rapidly increased at the initial stage for all groups because of the slow methane production rate and rapid acidification. After an obvious decrease, the concentration of TVFAs reached a relatively steady level at the end of digestion. The highest concentration of TVFAs in each reactor was in the following order: 1001 mg L−1 (1.5 V) > 640 mg L−1 (1.2 V) > 490 mg L−1 (0.6 V) > 482 mg L−1 (0.9 V) > 359 mg L−1 (0.3 V) > 341 mg L−1 (0 V). TVFAs concentrations at 1.2 V and 1.5 V were higher than other voltages, indicating that 1.2 V and 1.5 V could enhance production of TVFAs. This may be attributed to micro-aerobic conditions at 1.2 V and 1.5 V, which led to enhanced hydrolysis of complex organic matters with corresponding increase of TVFAs. The concentration of TVFAs under 0.3 V and 0.6 V kept a low level due to its fast consumption by methanogen, which was consistent with methane production. This suggested that the applied voltages of 0.3 V and 0.6 V can facilitate VFAs fermentation.
Acetate and propionic were the dominating types of TVFAs in each reactor, accounting for 58.8–86.2%. Acetate, as the most favorable substrate for methanogens, increased firstly and then decreased, similar to the results observed with TVFAs (Fig. 5c). The initial acetate concentration in the reactor was about 9.94 mg L−1. After 3 or 6 days' digestion, the acetate concentration increased significantly and achieved its highest values, which followed the order: 920 mg L−1 (1.5 V) > 528 mg L−1 (1.2 V) > 397 mg L−1 (0.9 V) > 360 mg L−1 (0.6 V) > 330 mg L−1 (0.3 V) > 252 mg L−1 (0 V). It indicated that applied voltages of 1.2 V and 1.5 V could not only enhance production of TVFAs, but also facilitate the acetate fermentation-type pathway. As shown in Fig. 5d, a stable trend of propionate was obtained at 0.3 V and 0.9 V, while that in other four groups increased at the initial stage then decreased and reached a relatively steady level at the end of digestion. Propionate under 1.5 V kept a high value at the initial 3 days then decreased to a low value on 6th day, meanwhile acetate increased (Fig. 5c). As the conversion of propionate to acetate was unfavorable in thermodynamics (ΔG = +76.1 kJ mol−1),37 enhancement of acetate indicated that the applied voltage of 1.5 V could facilitate the propionic fermentation-type pathway.
3.4 Microbial community structures
The bacteria communities were responsible for the conversion of organic matters into soluble organic compounds, such as VFAs, which could further serve as substrates for methanogens.38 Therefore taxonomic compositions of bacterial communities at different levels were analyzed. At the phylum level, the most abundant bacterial populations were found to be Proteobacteria, Firmicutes and Bacteroidetes for all reactors with different relative abundance (Fig. 6a). It was different from some literature values,39,40 and the result might be due to the differences of sludge and inoculum properties, or operating conditions like the reactors, hydraulic retention time (HRT). Proteobacteria are important microbes in anaerobic digestion process because most of Alpha-, Beta-, Gamma-, and Deltaproteobacteria are well-known microbial communities in utilizing glucose, propionate, butyrate, and acetate.41 The relative abundance of Proteobacteria for the control group (35.46%) approached to references.8 The highest relative abundance of Proteobacteria was achieved at 0.3 V (54.2%) and there was no distinct difference between other e-AD reactors (32–37%). It seemed that Proteobacteria was significantly enriched at 0.3 V. Firmicutes phylum is syntrophic bacteria that can degrade various VFAs, and showed a higher relative abundance at 0.6 V (35.9%) than that in other groups, contributing to the rapid decrease of VFAs at 0.6 V. Bacteroidetes, as the main fermentative bacteria, was enriched at 1.2 V (15.58%), while that in other samples was only 4–11%.
 |
| Fig. 6 Taxonomic compositions of bacterial communities at three levels (a) phyla, (b) classes, (c) genera and archaea communities (d) at genus level in the reactors retrieved from pyrosequencing (the relative abundance of genus less than 0.5% of total composition in the libraries was defined as “Unclassified”). | |
Obvious variations were observed in class level, Clostridia was found to be a dominant group with the applied voltages of 0 V (29.2%), 0.6 V (34.3%), 0.9 V (25.9%), 1.2 V (23.9%) and 1.5 V (21.1%), respectively (Fig. 5b). As for 0.3 V, Gammaproteobacteria was dominant (45.8%). Alphaproteobacteria also took up considerable proportion for 0.9 V and 1.5 V, with the relative abundance of 10.2% and 11.3%. These clear differences strongly indicated that the applied voltages enriched different bacteria community compared to that in the control group.
In genera level (Fig. 6c), there were 11 generas (Petrimonas, Flavobacterium, Proteiniclasticum, Sedimentibacter, Tissierella, Proteocatella, Fastidiosipila, Brevundimonas, Alcaligenes, Acinetobacter, Pseudomonas, Proteiniphilum) with relative abundance of higher than 0.5% in at least one sample. Other generas were grouped into the unclassified group. It seemed that relatively high bacterial diversity was found in all digesters except 0.9 V. This result consisted with the former discussion that 0.9 V had the harmful effect to the microorganisms. Acinetobacter, particularly could be capable to degrade macromolecular organics,42 was found to have the highest relative abundance at 0.3 V (33.1%), while that in other samples was very low (near to zero). Pseudomonas was found to live in strict syntrophic associations, and particularly could be capable to ferment proteins, growing well in presence of peptides.43 The highest relative abundance of Pseudomonas was achieved at 0.6 V (19.1%), which was in favor in providing available substrates for methanogens by degrading the proteins into micromolecular organics. This result consisted with the enhanced methane production at 0.6 V and also the absent of Pseudomonas at 0.9 V might account for the adverse substrate environment.
To clarify the effects of applied voltages on methanogens, the relative abundance of methanogens in each sample was identified at genus level as shown in Fig. 6d. There was no large gap among the reactors in terms of Methanobrevibacter, Methanocorpusculum, Methanosarcina and Methanospirillum, but distinct discrimination was observed in Methanobacterium, Methanoculleus, Methanosaeta, and Methanoregula. Among them, only two generas are known to use acetate for methanogenesis, i.e. Methanosaeta and Methanosarcina. Methanosaeta is a specialist that could utilize acetate exclusively, whereas Methanosarcina is a relative generalist that can utilize methanol, methylamine and acetate, as well as hydrogen and carbon dioxide for methane production.44 Another generas (e.g. Methanobacterium, Methanoculleus and Methanoregula) were hydrogenotrophic methanogens, which can reduce CO2 to CH4 with H2 as the primary electron donor, as well as formate.45 In Fig. 6d, hydrogenotrophic methanogens consisted majority of methanogen population when the applied voltages was over 0.6 V while acetoclastic methanogens were the prevalent methanogens at 0.3 V. The relative abundances of Methanosaeta in the reactors were 31.6% (0 V), 50.5% (0.3 V), 25.8% (0.6 V), 24.1% (0.9 V), 21.8% (1.2 V) and 37.8% (1.5 V), respectively. It implied that the applied voltage of 0.3 V enriched acetoclastic methanogenesis. The highest relative abundance of Methanobacterium was obtained in the control group (31.5%) in comparison with that at 0.3 V (19%), 0.6 V (12.1%), 0.9 V (7.8%), 1.2 V (14.9%) and 1.5 V (14.8%), respectively. Methanoculleus obtained its highest relative abundance at 0.3 V (14.3%). However, the Methanoregula abundance at 0.3 V was lowest (0.63%), compared with that of 12.3% (0 V), 53.3% (0.6 V), 49.7% (0.9 V), 5.7% (1.2 V) and 37.9% (1.5 V) respectively. The results indicated that hydrogenotrophic methanogens was enriched and that acetoclastic methanogens was weakened when the applied voltages was over 0.6 V.
3.5 Implications for electrical stimulation technology
To estimate the economic efficiency of the e-AD reactors, the energy input by the form of electricity and output by methane/hydrogen were calculated (Table 2). In this experiment, the electrical energy input calculated was 3.37 and 6.81 kJ for 0.3 V and 0.6 V groups, respectively. The energy output from methane was 32.49, 40.33 and 57.27 kJ for the control, 0.3 V and 0.6 V groups, respectively. Compared with the control, the net energy output for 0.3 V and 0.6 V was 4.47 and 17.99 kJ. Therefore, the energy consumption at 0.6 V could be neglected compared to the energy generated from methane. However, the net energy output were negative when the applied voltage was higher than 0.6 V, which meant that the experiments at 0.9 V, 1.2 V and 1.5 V were uneconomic under the test conditions. Besides, the environmental consequences of electrical stimulation technology were also evaluated based on CO2 emission. CO2 was a byproduct from the anaerobic digestion process of sludge. It indicated that the CO2 emission decreased by applying voltages (Table 2). The CO2 production of control was 86.48 L CO2 per kg VS removal, but it dramatically decreased to 54.64, 66.48 and 68.76 L CO2 per kg VS removal at 0.3 V, 0.6 V and 1.5 V, respectively. This result was in agreement with methane production. Therefore, the electrical stimulation technology is potentially environmentally friendly.
Table 2 Energy consumption, energy output and CO2 emission in the experiment
|
Energy consumption (kJ) |
Methane energy (kJ) |
Hydrogen energy (kJ) |
Net energy output (kJ) |
CO2 emission (L CO2 per kg VS removal) |
0 V |
— |
32.49 |
— |
32.49 |
86.48 |
0.3 V |
3.37 |
40.33 |
— |
36.96 |
54.64 |
0.6 V |
6.81 |
57.27 |
— |
50.48 |
66.48 |
0.9 V |
32.42 |
17.21 |
0.00085 |
−15.21 |
73.50 |
1.2 V |
49.98 |
45.66 |
0.018 |
−4.32 |
82.98 |
1.5 V |
98.37 |
49.93 |
0.52 |
−48.44 |
68.76 |
Previous studies showed that some WAS pretreatment technologies (e.g., free nitrous acid pretreatment and alkaline pretreatment) are economically attractive with low energy and chemical requirements. However, these pretreatment technologies require alkaline or acid environment which impose high quality demand on the reactor. Besides, the operation of these pretreatment technologies is complicated in comparison to the proposed electrical stimulation technology. Following that analysis, the electrical stimulation technology proved to be a novel approach to promote methane production from anaerobic sludge digestion.
4. Conclusion
Methane generation and VS removal efficiency were successfully enhanced at all applied voltages other than 0.9 V. Optimal applied voltage for methane production was 0.6 V, which was 76.2% higher than the control group. Further increasing the voltage from to 0.9 V to 1.5 V led to the accumulation of hydrogen because the excessive utilization of H+ by the cathodic hydrogen and caused an alkaline pH range. Higher voltages (1.2 V and 1.5 V) enhanced SCOD and VFAs concentrations in the supernatant. The reasons could be ascribed to the micro-aerobic conditions caused by water electrolysis. Based on the microbial community analysis, hydrogenotrophic methanogens were enriched with the voltages from 0.6 V to 1.5 V while acetoclastic methanogens were dominant at 0.3 V. Besides, both the highest relative abundance of Pseudomonas for protein degradation and Methanoregula for methane generation were found at 0.6 V, with the values of 19.1% and 53.3%, respectively.
Acknowledgements
This study was financially supported by the National Hi-Tech Research and Development Program of China (863) (No. 2011AA060906), National Natural Science Foundation of China (No. 51178261), and Open Funding Project of National Key Laboratory of Human Factors Engineering, Grant No. HF2012-K-05.
References
- Y. Feng, Y. Zhang, X. Quan and S. Chen, Water Res., 2014, 52, 242–250 CrossRef CAS PubMed
. - W. Rulkens, Energy Fuels, 2007, 22, 9–15 CrossRef
. - L. J. Wu, Y. Qin, T. Hojo and Y. Y. Li, RSC Adv., 2015, 5, 68531–68541 RSC
. - Y. Zhang, Y. Feng, Q. Yu, Z. Xu and X. Quan, Bioresour. Technol., 2014, 159, 297–304 CrossRef CAS PubMed
. - M. Gagliano, C. Braguglia, A. Gianico, G. Mininni, K. Nakamura and S. Rossetti, Water Res., 2015, 68, 498–509 CrossRef CAS PubMed
. - S.-K. Cho, H.-J. Ju, J.-G. Lee and S.-H. Kim, Bioresour. Technol., 2014, 165, 183–190 CrossRef CAS PubMed
. - M. Climent, I. Ferrer, M. del Mar Baeza, A. Artola, F. Vázquez and X. Font, Chem. Eng. J., 2007, 133, 335–342 CrossRef CAS
. - B. Yu, D. Zhang, A. Shan, Z. Lou, H. Yuan, X. Huang, W. Yuan, X. Dai and N. Zhu, RSC Adv., 2015, 5, 38538–38546 RSC
. - P. She, B. Song, X.-H. Xing, M. van Loosdrecht and Z. Liu, Biochem. Eng. J., 2006, 28, 23–29 CrossRef CAS
. - K. Nakanishi, H. Tokuda, T. Soga, T. Yoshinaga and M. Takeda, J. Ferment. Bioeng., 1998, 85, 250–253 CrossRef CAS
. - M. R. Hosseini, M. Schaffie, M. Pazouki and M. Ranjbar, Chem. Eng. Commun., 2014, 201, 160–170 CrossRef CAS
. - Q. Luo, H. Wang, X. Zhang and Y. Qian, Appl. Environ. Microbiol., 2005, 71, 423–427 CrossRef CAS PubMed
. - A. M. Hayes, J. R. Flora and J. Khan, Water Res., 1998, 32, 2830–2834 CrossRef CAS
. - N. H. McClenaghan and P. Flatt, J. Mol. Med., 1999, 77, 235–243 CrossRef CAS PubMed
. - J. C. Thrash and J. D. Coates, Environ. Sci. Technol., 2008, 42, 3921–3931 CrossRef CAS PubMed
. - V. Beschkov, S. Velizarov, S. N. Agathos and V. Lukova, Biochem. Eng. J., 2004, 17, 141–145 CrossRef CAS
. - X. Li, Y. Liu, G. Zeng, Y. Niu, X. Xiao, W. Xu, W. Xia, Y. Zhu and J. Liu, Bioresour. Technol., 2010, 101, 6035–6038 CrossRef CAS PubMed
. - APHA, Standard methods for the examination of water and wastewater, 20th edn, 1998 Search PubMed
. - M. M. Bradford, Anal. Biochem., 1976, 72, 248–254 CrossRef CAS PubMed
. - D. Herbert, P. Philipps and R. Strange, Methods Enzymol., 1971, 5, 265–277 Search PubMed
. - W. Rutvisuttinunt, P. Chinnawirotpisan, S. Simasathien, S. K. Shrestha, I. K. Yoon, C. Klungthong and S. Fernandez, J. Virol. Methods, 2013, 193, 394–404 CrossRef CAS PubMed
. - Y. Yu, C. Lee, J. Kim and S. Hwang, Biotechnol. Bioeng., 2005, 89, 670–679 CrossRef CAS PubMed
. - B. Yu, Z. Lou, D. Zhang, A. Shan, H. Yuan, N. Zhu and K. Zhang, Bioresour. Technol., 2015, 179, 291–298 CrossRef CAS PubMed
. - J. Zhang, Y. Zhang, X. Quan and S. Chen, Water Res., 2013, 47, 5719–5728 CrossRef CAS PubMed
. - C. Ting and D. Lee, Int. J. Hydrogen Energy, 2007, 32, 677–682 CrossRef CAS
. - B. Tartakovsky, P. Mehta, J.-S. Bourque and S. Guiot, Bioresour. Technol., 2011, 102, 5685–5691 CrossRef CAS PubMed
. - J. W. Lim and J.-Y. Wang, Waste Manage., 2013, 33, 813–819 CrossRef CAS PubMed
. - C. Zhang, H. Su and T. Tan, Bioresour. Technol., 2013, 145, 10–16 CrossRef CAS PubMed
. - W. Lv, F. L. Schanbacher and Z. Yu, Bioresour. Technol., 2010, 101, 9409–9414 CrossRef CAS PubMed
. - M.-F. Dignac, V. Urbain, D. Rybacki, A. Bruchet, D. Snidaro and P. Scribe, Water Sci. Technol., 1998, 38, 45–53 CrossRef CAS
. - V. K. Tyagi and S.-L. Lo, Bioresour. Technol., 2012, 119, 105–113 CrossRef CAS PubMed
. - P. Jenicek, F. Keclik, J. Maca and J. Bindzar, Water Sci. Technol., 2008, 1491–1496 CrossRef CAS PubMed
. - P. Jenicek, J. Koubova, J. Bindzar and J. Zabranska, Water Sci. Technol., 2010, 427–434 CrossRef CAS PubMed
. - K. Wang, J. Yin, D. Shen and N. Li, Bioresour. Technol., 2014, 161, 395–401 CrossRef CAS PubMed
. - S. Zhang, P. Zhang, G. Zhang, J. Fan and Y. Zhang, Bioresour. Technol., 2012, 118, 496–501 CrossRef CAS PubMed
. - F. Molina, M. Castellano, C. García, E. Roca and J. Lema, Water Sci. Technol., 2009, 60, 615 CrossRef CAS PubMed
. - V. Vavilin, L. Y. Lokshina, S. Rytov, O. Kotsyurbenko and A. Nozhevnikova, Bioresour. Technol., 1998, 63, 159–171 CrossRef CAS
. - Y. H. Feng, Y. B. Zhang, S. Chen and X. Quan, Chem. Eng. J., 2015, 259, 787–794 CrossRef CAS
. - Y. Feng, Y. Zhang, S. Chen and Q. Xie, Chem. Eng. J., 2015, 259, 787–794 CrossRef CAS
. - S. Rui, A. Zhou, J. Jia, Q. Liang, L. Qian, D. Xing and N. Ren, Bioresour. Technol., 2015, 175, 68–74 CrossRef PubMed
. - H. D. Ariesyady, T. Ito and S. Okabe, Water Res., 2007, 41, 1554–1568 CrossRef CAS PubMed
. - T. Mino, Biochemistry, 2000, 65, 341–348 CAS
. - K. Sasaki, M. Morita, D. Sasaki, J. Nagaoka, N. Matsumoto, N. Ohmura and H. Shinozaki, J. Biosci. Bioeng., 2011, 112, 469–472 CrossRef CAS PubMed
. - Y. Yu, C. Lee and S. Hwang, Water Sci. Technol., 2005, 52, 85–91 CAS
. - J. Cheon, T. Hidaka, S. Mori, H. Koshikawa and H. Tsuno, J. Biosci. Bioeng., 2008, 106, 134–140 CrossRef CAS PubMed
.
Footnote |
† Electronic supplementary information (ESI) available. See DOI: 10.1039/c5ra24134k |
|
This journal is © The Royal Society of Chemistry 2016 |
Click here to see how this site uses Cookies. View our privacy policy here.