W. Xu,
Z. Lan,
B. L. Peng,
R. F. Wen and
X. H. Ma*
State Key Laboratory of Fine Chemicals, Liaoning Provincial Key Laboratory of Clean Utilization of Chemical Resources, Institute of Chemical Engineering, Dalian University of Technology, Dalian, 116024, China. E-mail: xuehuma@dlut.edu.cn
First published on 14th January 2016
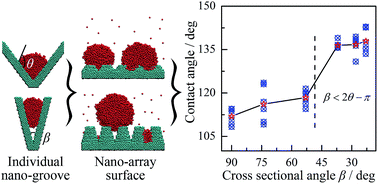
The geometrical structures of surfaces are important to the formation and growth of nuclei during water vapor condensation and the related heat and mass transfer performances. In the present research, the nucleus wetting modes on individual grooves and nano-array surfaces were investigated by molecules dynamics simulations. The results proposed a criterion that the nucleus wetting modes on a V-shaped groove are determined by the intrinsic contact angle θ and the cross sectional angle β. As the cross sectional angle decreases to β < 2θ − π, the nuclei can suspend in the groove center and the suspending height increases with decreasing β. For the nano-array surfaces, the nucleus can wet the grooves between adjacent nano arrays during the initial nucleation stage as the initial nuclei are very small and the nucleus surface are fluctuating frequently. The wetting mode may change as nucleation continuous and the nucleus can depart from the groove bottom to form a Cassie mode nucleus on a surface with β < 2θ − π. The apparent contact angle of nucleus also increases sharply with the wetting mode transition. Moreover, the dynamic behaviors of nucleating droplets were also observed on a nano-array superhydrophobic surface that meets the criterion. The droplets on this surface can recover the spherical shape after coalescence and the droplet jumping occurs, indicating a lower surface stiction. The results provide an insight of the interfacial phenomenon between the nucleus and the geometrical structures and propose a guideline to construct nano-array surfaces in the aim of promoting the Cassie mode nucleus.
Various theoretical and semi-empirical models have been proposed to describe the relationship between surface structures and the wetting modes. Amongst the Wenzel13 and Cassie14 models were widely used for the macroscale droplets. Depending on the configuration of structures15–21 and the intrinsic wetting angle of substrate materials, the droplet can either immerse into the bottom of micro structures to form a Wenzel droplet, or suspend on top of the structures to form a series of air-pockets between the liquid–solid interface, yielding a Cassie mode droplet. Bico et al.22 and Quéré23 proposed a model to predict the wetting state based on the interfacial free energy analyses, which takes into account of the solid–liquid contact area fraction and the surface roughness and gives a predicted critical contact angle for the Wenzel and Cassie wetting modes. Similar approaches based on the Gibbs free energies were also adopted by Marmur24 and Tuteja et al.25 to predict the droplet wetting state on a patterned surface. However, it was found that these models also have limitations as they were proposed for the macro droplets. For the nucleation process, the nuclei are usually in nano scale,2,4 which make it difficult to predict the wetting modes by classic wetting models. The structural parameters that used in these models are usually statistic parameters such as the surface roughness and the solid–liquid contact area fractions. The nucleation process, on the other hand, requires more detailed information on the interactions between individual nano nuclei and nano-structures where their sizes are comparable.
Furthermore, the wetting mode also can be affected by the surrounding environment and the formation process of droplets26–30 for the same structured surface. It has been noticed that the best-known superhydrophobic surface, lotus leaf, loses its hydrophobicity in a water vapor condensation environment.31,32 During the contact angle measurement, the droplet was usually generated by gently placing a macro droplet on the surface. For the vapor condensation processes, the condensate droplets were generated by continuous growth of the nuclei after the nucleation. Typically, this nucleation process includes the formation of clusters from vapor molecules and the growth of nuclei which occurs in nano scale. The vanishing of hydrophobicity for lotus leaf suggests that the physical process of nucleation also should be taken into consideration in designing the structured surfaces for vapor condensation applications.
Numerical modeling provides an advantageous solution to these limitations. In the literature, the Gibbs free energy analyses,24,33,34 finite element method,35 lattice Boltzmann method,36–39 lattice density functional method40 and molecular dynamics (MD) simulations41–43 were adopted to investigate the wetting behavior of droplets. Amongst these simulation methods, a unique advantage of the MD simulation is the ability to observe the physical process of nucleation which usually occurs within nano-scale and nanosecond time scale. In the previous researches, MD was used to discuss the relationship between contact angle and the solid–liquid interaction intensities for planar surface43 and investigate the apparent contact angles on patterned surfaces.41,42,44 Katasho et al.44 showed that the hydrophobicity of the close-packed CF3-terminated solid surface can be further enhanced by atomic-scale roughness. MD were also widely used to investigate the heterogeneous nucleation for water vapor43,46 and the results obtained reasonably accurate nucleation rates and fine details of the formation and growth of nuclei.
In the present study, MD simulation method was adopted to investigate the effect of nano structures on the nucleus wetting modes during water vapor condensation. Instead of discussing the relationship between the apparent contact angle and the statistic structural parameters such as the surface roughness and the effective solid–liquid contact area fraction, the effort described here focused on the interactions between individual nano nuclei and nano structures with comparable sizes. V-shaped grooves with different cross sectional angles were used to represent the geometrical structures that exist in practical surfaces and a criterion was proposed to predict the wetting mode of water nuclei based on the MD results and the model analysis. Further, the analyses were also examined on nano-array surfaces and experimental observations of condensation droplets on a nano-array superhydrophobic surface were presented as a typical case to demonstrate the potential applications. The results offer insight into the wetting theory with the presence of interfacial and structural effects and provide a guideline to construct nano-array surfaces which can be used in the droplet manipulations, including, but not limited to, droplet wetting mode regulation and the droplet jumping promotion in vapor condensation enhancement.
Two sets of simulations are conducted in the present study and the related simulation systems are demonstrated in Fig. 1. In Fig. 1b, a V-shaped groove is used to represent the typical nano-structures that exist in solid condensation surfaces, such as the randomly distributed surface defects, scratches, cavities and the gaps between adjacent nano-arrays. The V-shaped structures are constructed from the FCC atoms layer by layer and the ratios between the open width, W, and the depth, D, of the grooves are adjusted to give different cross sectional angles, β. The simulation parameters are listed in Table 1. In the present study, the ratios, W/D, are set to be 2/5, 2/4, 2/3, 2/2, 2/1.5, and 2/1 with cross sectional angles, β, of 23°, 28°, 37°, 53°, 74°, and 90°. The lengths of the groove walls, Lw, are kept as the same (108.6 ± 1.9 Å). In this way, the contacting area between vapor molecules and the solid surface are constant as β changes. The grooved structures are located under the bottom of the simulation box with a lateral dimension of 220.3 × 101.1 × 220.3 Å3, as shown in Fig. 1b. 2000 water molecules are randomly distributed in the simulation box acting as water vapor for heterogeneous nucleation.
Wa/Å | Da/Å | Lw/Å | W/D | β/deg | |
---|---|---|---|---|---|
a W and D are integral multiples of the thickness of a single layer FCC atoms. | |||||
V-shaped grooves | 151.7 | 75.9 | 107.3 | 2/1 | 90 |
130.0 | 86.7 | 108.4 | 2/1.5 | 74 | |
97.5 | 97.5 | 109.0 | 2/2 | 53 | |
68.6 | 102.9 | 108.5 | 2/3 | 37 | |
52.4 | 104.7 | 108.0 | 2/4 | 28 | |
43.3 | 108.4 | 110.5 | 2/5 | 23 | |
Nano-array surfaces | 14.4 | 7.2 | 10.2 | 2/1 | 90 |
14.4 | 10.8 | 13.0 | 2/1.5 | 74 | |
14.4 | 14.4 | 16.2 | 2/2 | 53 | |
14.4 | 21.7 | 22.8 | 2/3 | 37 | |
14.4 | 28.9 | 29.8 | 2/4 | 28 | |
14.4 | 36.1 | 36.8 | 2/5 | 23 |
In Fig. 1c, the individual nano-grooves in Fig. 1b are extended to be nano-array surfaces. 5 × 5 nano pillars are closely arranged on x–y plane with lateral dimension of 144.5 × 144.5 Å2. The nano pillar is centrosymmetric with a circular truncated cone shape and the profiles of x–z plane and y–z plane are identical for the simulation box. In order to save space, only the side view of x–z plane is demonstrated on the right side of Fig. 1c. The open widths, W, for the gaps between adjacent nano arrays are 14.4 Å for different nano-array surfaces, and the gap depth is adjusted to achieve different cross sectional angles, β, as listed in Table 1. The simulation box length in z direction is 577.9 Å for Fig. 1c, and the number of water vapor molecules is 5000 in order to observe the wetting mode and dynamic behavior of nucleus with relatively larger size. For both Fig. 1b and c simulations, the water molecules are distributed randomly and the overlap between surface–water or water–water molecules are carefully checked before simulation.
The water–water interactions are described by the rigid TIP4P/2005 water model47 for its overall accuracy in predicting vapor–liquid equilibrium parameters.48 The intermolecular potential in TIP4P/2005 model is defined as follows:
![]() | (1) |
The interactions between the surface atoms are LJ type only. The LJ parameters of the surface atoms are adopted from previous research,43 with σs = 2.616 Å, εs = 1.116 kJ mol−1. The previous MD simulations showed that the contact angle of water on the planar surface with this set of LJ parameters is 113.9°. In the present study, these surface atoms are used to represent the typical low energy surfaces or coatings.
The interactions between surface atoms and water molecules are calculated using the Lorentz–Berthelot mixing rules.49 Only LJ forces are considered for surface–water interactions as the surface atoms under consideration is electrically neutral. The Lorentz–Berthelot mixing rules49 write as:
σso = (σs + σo)/2 | (2) |
![]() | (3) |
The MD simulations were conducted under constant number of atoms, N, and constant volume, V. The temperature of the simulation system, T, was controlled by a more sophisticated method43 instead of the simple temperature quenching thermostat or the application of carrier gas. To simulate the practical vapor condensation process, the temperature of the solid surface was kept as Ts = 373 K during the entire simulations, while the initial vapor temperature was set as T0 = 500 K, which was slightly higher than the saturated temperature for the vapor density under consideration. The temperature of surface atoms was kept as constant43 throughout the nucleation simulations via a Langevin-dynamics thermostat. This temperature control method ensures that a temperature difference exists between water vapor and the solid surface, and the exchange of latent heat only occurs at the surface–vapor interface. As a result, the water vapor translates gradually from super-heated to super-saturated as simulation continues, creating a favorable environment for the nucleation of water nuclei.43 The initial vapor temperature and vapor density is relatively higher than practical applications, which is a tradeoff between box size and computational costs.
The cutoff distances for the LJ and electrostatic interaction calculations were 10 Å. The electrostatic interactions were also incorporated with particle mesh Ewald method to evaluate the long range effect. The time step was set as 2 fs. Each simulation was carried out for 2 × 10⁶ steps (4 ns). The coordinates of water molecules and surface atoms were outputted every 1000 steps for the convenience of visualization. VMD50 software was used to display and analysis the MD simulation results.
The contact angle was measured in ambient with a room temperature of ∼20 °C. The following experiments, however, were conducted under low pressure with a condensation temperature of 1 °C. Although the low pressure and the condensation/evaporation may lead to a contact angle slightly different51,52 from that observed in ambient, the difference is not significant and the measured contact angle can be used to characterize the surface wettability in vapor condensation experiments.
The nano-array surface was characterized by an environmental scanning electronic microscope (ESEM, Quanta 450, FEI Company, USA) and the results were shown in Fig. 2. During the chemical etching process, a lot of nano-arrays formed due to the directional growth of reaction product. The randomly distributed nano-arrays were closely packed with each other, and finally a lot of V-shaped gaps formed between adjacent nano-arrays. 10 nano gaps were measured for the surface in use and the averaged open width, W, of the nano-arrays was 171.3 ± 64.1 nm, and the averaged cross sectional angle, β, of the groove between two adjacent nano-arrays was 17.5 ± 7.4°.
![]() | ||
Fig. 2 ESEM images of the nano-array superhydrophobic surface and the V-shaped gaps between adjacent nano-arrays. |
The vapor condensation experiments were also conducted in ESEM. During the ESEM experiments, the surface was placed on top of the ESEM cooling platform. The vapor pressure of the ESEM chamber was decreased to 400 Pa, and the temperature of the cooling platform was then set to be 1 °C. After that, the vapor pressure of the chamber was increased gradually with an increment of ∼20 Pa until the nucleation of droplets can be observed. The vapor pressure was then kept as constant to observe the growth of droplets, which was 730–770 Pa in the present experiments. The results were captured by ESEM with 2000 times magnification.
Fig. 3 presents the MD simulation results for the nucleation of water nuclei in β = 53° and β = 28° grooves as typical cases. As simulation starts, the vapor molecules collide with the groove walls randomly. The molecules may be slowed down after colliding with the surface and a part of kinetic energy is transferred from vapor molecules to the surface atoms. The heat exchange between the vapor molecules and the surface atoms create a favorable environment for the nucleation of water nuclei. As shown in Fig. 3, at 0.2 ns, a lot of water molecules aggregate into clusters and deposit on the inner walls and the bottoms for both grooves. As nucleation continues, the clusters grow up by the addition of vapor molecules or by coalescing with adjacent clusters, and finally a nucleus arises in the groove bottom. Previous model analysis8 have pointed out that the nucleus that deposit in grooves and cavities have relatively lower interfacial free energies and are hence relatively more stable. As a result, the initial nuclei tend to form in these grooves or cavities, as shown in Fig. 3a and b, at 0.6 ns.
![]() | ||
Fig. 3 Nucleation of water nucleus and the resultant wetting modes on two V-shaped grooves. (a) β = 53°, (b) β = 28°. The local contact angle on the upper meniscus is ∼113.9° for the two grooves, which is identical to the contact angle on planar surface for the surface atoms in use.43 |
The nuclei that trapped in the grooves grow up even larger as the nucleation continues. Finally, different wetting modes can be observed for the two cases. For the wider β = 53° groove, the nucleus stays immersed into the groove bottom. On the contrary, a vapor-pocket arises between the nucleus and the groove bottom and the nucleus is suspended in the groove center for the narrower β = 28° groove. The vapor-pocket also becomes larger as nucleation continues, and the nucleus keeps suspended and departs away from the groove bottom, as shown in Fig. 3b, from 1 ns to 4 ns. Affected by the interfacial free energy minimization mechanism, the nucleus keeps climbing up from the groove bottom in order to retain the spherical profile and minimize its interfacial free energy.
To form a suspended droplet as demonstrated in Fig. 4a, a lower meniscus has to form and the suspending height, H, has to be larger than the curvature radius, r. The suspending height can be expressed as follows from geometry:
![]() | (4) |
The following criterion can be obtained for a suspended droplet:
H > r, θ − π/2 > β/2 | (5) |
Eqn (5) indicates that a droplet will be suspended in the groove with β < 2θ − π. As a result, a relatively narrower cross sectional angle β and a larger intrinsic contact angle θ are required when the suspended droplet is desired.
In order to test the criterion in eqn (5), similar simulations of nucleation process were performed on 6 other V-shaped grooves with different cross sectional angles and the resultant nucleus profiles were shown in Fig. 5. Consider the intrinsic contact angle of 113.9° for the simulated surface material, the critical value of β in eqn (5) is calculated to be 47.8° (β* = 2θ − π). For wider grooves with cross sectional angles, β, of 90°, 74°, and 53°, the nuclei stay immersed into the groove bottom during the nucleation. For other narrower grooves with β of 37°, 28° and 23°, the nuclei are suspended in the groove centers. Fig. 5 also shows that the suspending height (the distance between the curvature center of the nucleus and the groove bottom), H, is increasing as β decreases. In Fig. 5b, the solid line represents the calculated results from eqn (5) for a nucleus composed of 2000 water molecules while the scatters denote the results from the MD simulations. The MD simulation results are in supportive to the model analysis.
![]() | ||
Fig. 5 The nucleus wetting modes and the suspending heights in different grooves. (a) Nucleus profiles in different V-shaped grooves. (b) The suspending height H as a function of the cross sectional angle (the solid lines were obtained from calculation by eqn (4) for a droplet composed of 2000 water molecules; the scatters were obtained from MD simulation measurements). |
![]() | ||
Fig. 6 Nucleation of water nucleus and the time-lapse nucleus profiles on two nano-array surfaces. (a) β = 53°. (b) β = 28°. |
As nucleation starts, the vapor molecules collide with the nano-arrays and a part of molecules are trapped in the grooves between adjacent nano-arrays, as shown in Fig. 6, at 0.2 ns. The vapor molecules that trapped in the nano structures collide with each other and then aggregate in the form of clusters as nucleation continues. These clusters keep growing up by coalescing with each other and finally a nucleus is formed on each nano-array surface, as shown in Fig. 6, from 0.6 ns to 2 ns.
It can be found that the nucleus profiles on two nano-array surfaces are different when the nuclei have grown large enough. For the β = 53° surface, the small clusters stay in the groove bottom during the entire nucleation process and the resultant nucleus keep wetting the nano-arrays, as shown in Fig. 6a. In this case, the nucleus is contacting directly with the nano-structured surface and the gaps between adjacent nano pillars are immersed by the liquid, which is defined as the Wenzel wetting mode.13 For the β = 28° surface, the small clusters also stay in the groove bottom at the initial nucleation stage (Fig. 6b, 0.2–1.5 ns). According to the criterion of the nucleus wetting mode on individual nano-groove, a vapor-pocket should exist between the nucleus and the groove bottom as demonstrated in Fig. 5a for the β = 28° groove. During the initial nucleation stage, the vapor pocket does not appear because of the fact that the V-shaped grooves in the nano-array surface is relatively small and the molecules on the nucleus surface is fluctuating and colliding frequently with the groove bottom. However, the nucleus at this stage is not in its stable state and eventually the wetting mode will change as nucleation continuous even further. For the β = 28° surface, this transition occurs between 1.50–1.65 ns and the nucleus departs from the groove bottom to form a suspended one. The transition time is relatively longer than that of the individual groove with the same β, as demonstrated in Fig. 3. For the nano-array surface, the water molecules will be trapped in the gaps between adjacent nano pillars. The migration of small clusters are slowed down by these nano structures and the nucleus grows relatively slower as compared with that on the individual groove. As a result, the nano-array surface shows a slower transition time for the nucleus wetting mode. After the wetting mode transition, the nucleus keeps suspended on top of the nano arrays. For this nucleus, the gaps between adjacent nano arrays are not occupied by the liquid and the nucleus is only contacting with the top of these nano arrays, which is usually referred as the Cassie wetting mode.14 From 2 ns to 4 ns, the wetting modes can be well maintained for the nuclei on two nano-array surfaces, indicating that the nuclei are in their stable state and the results of the wetting modes are representative.
The resultant nucleus profiles on different nano-array surfaces are shown in Fig. 7, where the cross sectional angles of the grooves between adjacent nano-arrays, β, are 90°, 74°, 53°, 37°, 28°and 23°.
As expected, the nuclei on surfaces with wider nano-arrays (β = 90°, 74° and 53°) are in Wenzel mode, while Cassie mode nuclei are formed on surfaces with narrower nano-arrays (β = 37°, 28° and 23°). The criterion of eqn (5) is obtained from the force balance of the local contact line and the physical model in Fig. 4a is universal for V-shaped cross sections. As a result, the criterion is suitable for both individual grooves and the nano-array surfaces as they have the same V-shaped cross sections.
Fig. 7 also shows that the apparent contact angles of the nuclei are increasing as the nano-arrays become narrower. In Fig. 7b, the apparent contact angles were measured from the MD simulation results following the previous methods.43,45 For each surface, 6 contact angles were measured for the nucleus profiles in 3.6–4 ns range. Affected by the asymmetric forces from impacting vapor molecules, noticeable fluctuation of vapor–liquid interfaces can be observed for the nuclei which lead to the fluctuation of contact angles, as shown in Fig. 7b. The averaged apparent contact angles are 112.0°, 116.2°, 118.4°, 136.5°, 136.7° and 137.9° for the nano-array surfaces with β of 90°, 74°, 53°, 37°, 28° and 23°. The contact angle increases nonlinearly with β and a great difference can be observed when the wetting mode of nucleus translates from Wenzel to Cassie mode. For the nano-array surfaces with β of 90°, 74° and 53°, the differences between the apparent contact angles and the contact angle on planar surface are not significant as the nuclei are in Wenzel mode. For narrower nano-array surfaces with β of 37°, 28° and 23°, the nuclei translate into Cassie mode and hence reach up to a higher apparent contact angle. It is necessary to point out that, the nucleus sizes are still competitive to the size of nano-arrays, and the apparent contact angles are thus affected greatly by the nucleus sizes.53 More detailed discussions on the nucleus size effect will be carried out in the future.
The growth rate of the nucleus is also different on the surfaces with different structural parameters. Fig. 8 shows the evolution of nucleus size as a function of nucleation time, where the largest nucleus on each surface is monitored throughout the simulation. Affected by the coalescence, the growth of nucleus is in inconsecutive manner and several abrupt increase of nucleus size can be found for each surface. For the β = 28° case, the nucleus and small clusters are suspending on top of the nano structures and hence they can migrate freely on the surface. As a result, the coalescence occurs more frequently and the resultant nucleus is also larger on the β = 28° surface as compared with the β = 53° one. On the other hand, the growth rate of nucleus by direct condensation (growth by the addition of vapor molecules) shows no significant difference for the two surfaces, as demonstrated in Fig. 8 by the slope of the nucleus size curve.
![]() | ||
Fig. 8 Evolution of the largest nucleus size and the growth rate of nucleus on two nano-array surfaces. |
In conclusion of this section, similar wetting behaviors are found for the nuclei on individual nano-grooves (Fig. 5) and nano-array surfaces (Fig. 7). Consequently, the criterion of eqn (5) that describes the wetting mode of nucleus on individual nano-grooves can also be adopted as a guideline to construct nano-structured surfaces that is suitable for the promotion of Cassie mode. The latter one is very important in the fabrication of superhydrophobic surfaces and the related heat and mass transfer processes.
The nucleation and growth of condensate droplets on a nano-array surface were observed in ESEM experiments and the resultant time-lapse images of nucleating droplets at different growth stages were shown in Fig. 9. The characterization results of the nano-array surface were demonstrated in Fig. 2, with β < 2θ − π. For this nano-array surface, the Cassie mode can be expected according to eqn (5).
According to the classic nucleation theory, the nucleus size is in nanoscale and the nucleation occurs very rapidly.1–4 As a result, the detailed physical process of the nucleation can not be observed directly due to the limitation of spatial resolution and frame rate. Fortunately, we can speculate the possible nucleation process by investigating the subsequent droplet growth and coalescence.
Fig. 9a shows that the initial droplets start to arise on the surface as the vapor pressure is gradually increased and the droplets are in spherical shape. As nucleation continues, the droplets grow up and start to coalesce with adjacent ones. In Fig. 9a, three droplets coalesce with each other to form a larger one. It can be found that the droplet can recover its spherical shape after coalescence and no residual liquid was left on their original positions. These phenomena indicate that the nucleating droplets on the present nano-array surface are in Cassie mode.
Fig. 9b shows that the nano-array surface can also be used to accelerate droplet departure. In Fig. 8b, several droplets are about to coalesce with each other at 9 s, and these droplets disappear on the next frame. As the other droplets that surround these droplets remain uninfluenced, it can be affirmed that these droplets depart from the surface by jumping instead of sliding on the surface. The droplet jumping is induced by the coalescence. During the condensation process, the droplets coalesce frequently with each other and a part of interfacial free energy is released as the interfacial area of the newly formed larger droplet is smaller than that of the coalesced droplets. As the droplets are in Cassie mode, only a small fraction of excess interfacial free energy is dissipated during droplet coalescence and the remaining part can transform into kinetic energy and drives the droplet to depart from the surface by jumping. The coalescence induced droplet jumping phenomena have drawn great attention in recent years, and a lot of theoretical54,55 and experimental11,12,56 investigations have been contributed. The results indicate that the coalescence induced droplet jumping is affected greatly by the surface characteristics and the droplet diameters. Amongst these discussions, a generally accepted verdict is that the Cassie mode is required for effective jumping phenomenon. Benefited from the nano-array structures with β < 2θ − π for the surface in use, Cassie mode droplets formed on this surface and the droplet jumping finally occurred.
The experimental result provides direct evidence that the present analyses are valid and it also provides a guideline for the superhydrophobic surface fabrication. For the superhydrophobic surface, the key parameters are the surface free energy and the micro–nano structures. In the criterion of eqn (5), the intrinsic contact angle, θ, denotes the surface free energy, while the cross sectional angle, β, denotes the structural parameter of the nano-structured surface. The analyses indicate that the surface will be superhydrophobic when its parameter meets the criterion, β < 2θ − π. This result is helpful to the droplet manipulation applications, including the wetting mode control, rapid removal of condensate droplets, promotion of self-propelled droplet jumping, and certainly can be used in other potential applications where the Cassie mode droplet is desired.
The wetting modes of nuclei in nano grooves are determined by the structural parameters including the intrinsic contact angle θ and the cross sectional angle β. As the cross sectional angle decreases to β < 2θ − π, the nucleus can suspend in the groove center and the suspending height increases as β decreases even further. The nucleus also keeps climbing up from the groove bottom as nucleation continues in order to retain the spherical profile and minimize its interfacial free energy.
For the nano-array surfaces, the nucleus wetting modes are also affected greatly by the geometrical parameters of the grooves between adjacent nano arrays. At the initial nucleation stage, the nucleus can wet the grooves of nano-array surfaces as the initial nuclei are very small and the nucleus surfaces are fluctuating and contacting frequently with the groove bottom. The wetting mode may change as nucleation continuous and the nucleus departs from the groove bottom to form a Cassie mode nucleus on surfaces with β < 2θ − π. The criterion that proposed for the nucleus wetting mode on individual nano grooves also applies to the nano-array surfaces. As the structural parameter translates to β < 2θ − π, the apparent contact angle of the nucleus increases sharply with the wetting mode transition. The analyses provide an insight of the interfacial phenomenon between nucleus and geometrical structures and propose a guideline to construct nano-array surfaces in the aim of promoting Cassie mode nucleus.
This journal is © The Royal Society of Chemistry 2016 |